
Welcome to The Observatory. The Observatory is how we at Prometheus monitor the evolution of both the economy and financial markets in real-time. Here are the top developments that stand out to us:
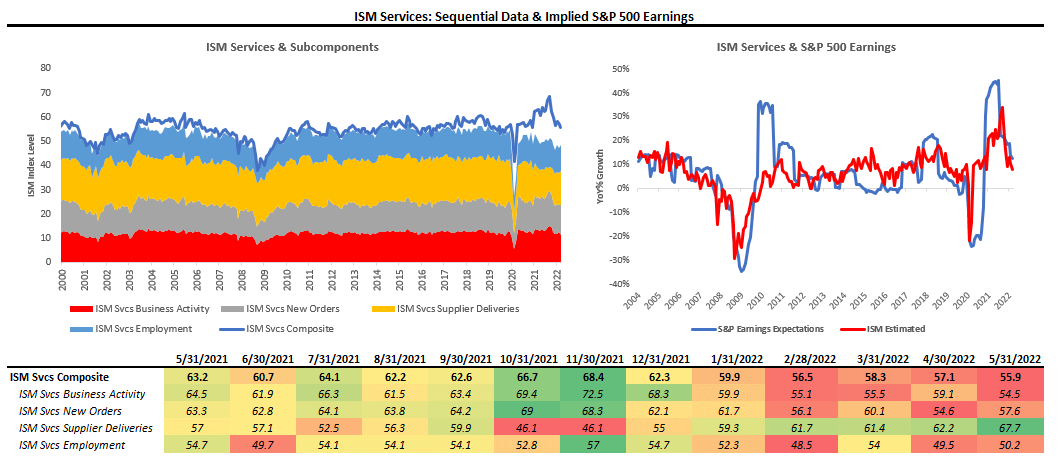
i. ISM Services came in lower but outperformed expectations. The latest ISM Services data showed an expansionary reading of 55.9, implying 8% YoY earnings for the S&P 500. This reading was a sequential deceleration within a decelerating trend. The largest gaining segment was Deliveries, and the most significant slowdown was in Business Activity.
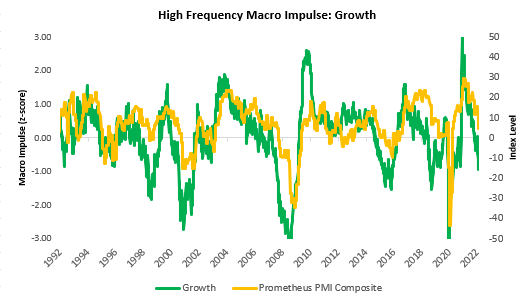
ii. Individual data may bounce or strengthen, but the broad trend in economic data is lower. In particular, ISM data this week surprised expectations significantly, alongside a robust labor market. However, our proprietary High-Frequency Gauges tell us that the trend in economic growth is likely to head lower. Furthermore, when we look at our broad PMI composite, which includes all the major PMI surveys, we see weakness is already present in the form of a downtrend:
iii. Our systems signal heightened nominal growth with a stagflationary tilt. We continue to have the conviction that this is the number one risk to manage in markets today. We show our market regime monitor below:
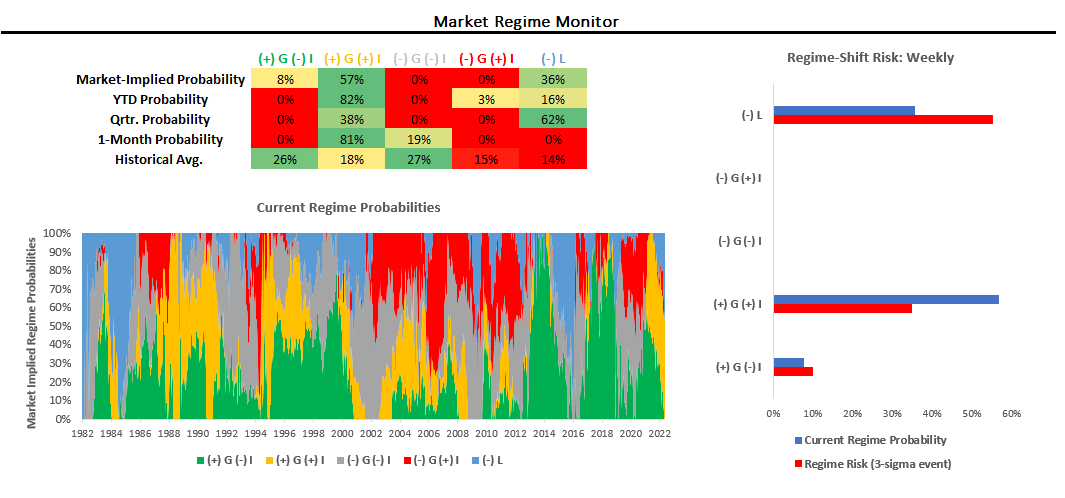
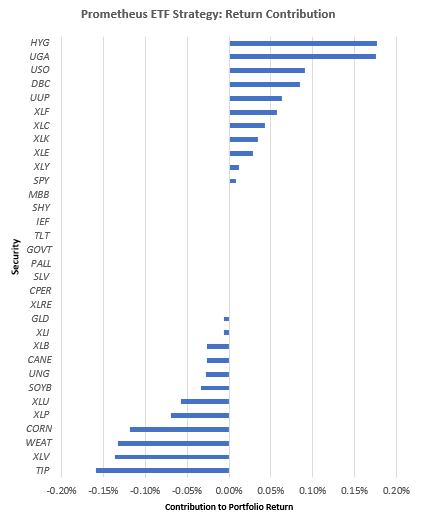
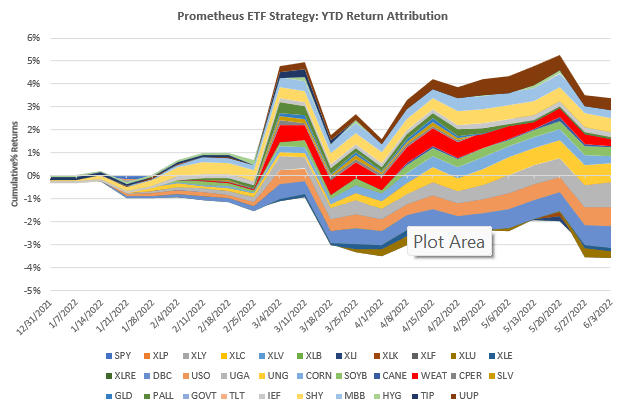
Over the last month, markets have primarily priced rising nominal growth. Regime Risk is currently elevated, with the potential for a shift to (-) L. We continue to have a dynamic of heightened risk and volatility. Within this context, our ETF Strategy was able to end this week roughly flat, despite significant volatility in equity markets. The performers in the portfolio were high yield shorts (HYG) & natural gas longs (UGA). The drags on the portfolio were silver & TIPS long positions. We show the attribution below:
We show the YTD cumulative return for the ETF Strategy as well:
Our systems continue to tell us that inflation is persistent while growth continues to trend lower. Liquidity conditions have tightened and are likely to get worse. Our systems aggregate our analysis in an algorithmic, rules-based fashion to create portfolios with attractive risk-reward ratios. For next week, here are how our systems are looking to be positioned based on both fundamental and market data:
- Stocks: SPY (-5%), XLP (5%), XLY (-3%), XLC (-5%), XLV (5%), XLB (5%), XLI (-5%), XLK (-4%), XLF (-4%), XLU (5%), XLE (3%)
- Commodities: DBC (3%), USO (2%), UGA (2%), UNG (2%), CORN(3%), SOYB(4%), CANE(4%), WEAT(2%), GLD (6%)
- Fixed Income: HYG (-10%), TIP (13%)
- Dollar: UUP (12%)
At the asset class level, our signals net out to an exposure that remains short equities & credit:

This allocation has a probability-weighted loss of -3.1% and a max loss of -6.7% in a three-sigma event. Volatility continues to rise across asset classes, consistent with what we have seen during previous periods of Quantitative Tightening.
Read our note on the path for Quantitative Tightening by clicking here.
With inflation persistent, the growth impulse weakening, liquidity tightening, & volatility rising, capital preservation plus active shorting remains the key to success. We continue to think our systems are well prepared for such an environment as they have been in the past:
Stay nimble!
Hey there! Do you know if they make any plugins to assist with Search Engine Optimization? I’m trying to get my website to rank
for some targeted keywords but I’m not seeing very good results.
If you know of any please share. Thank you! You
can read similar art here: Eco blankets
At the middle of this effort is the Neanderthal Genome Mission, a collaboration among the many U.S.
sugar defender official website Including Sugar
Protector right into my daily regimen total wellness. As somebody who focuses on healthy eating, I value
the extra security this supplement provides. Because starting
to take it, I’ve seen a marked improvement in my power levels
and a substantial decrease in my need for undesirable
snacks such a such a profound impact on my day-to-day live.
sugar defender ingredients
sugar defender reviews Uncovering Sugar Protector has been a game-changer for me, as
I’ve constantly been vigilant concerning handling my blood sugar degrees.
I currently feel empowered and confident in my ability to preserve healthy degrees,
and my most recent checkup have actually mirrored this development.
Having a reliable supplement to complement my a substantial resource of convenience, and I’m truly thankful for the significant distinction Sugar Protector has actually made in my total well-being.
sugar defender reviews
sugar defender official website As a person that’s always been cautious concerning my blood sugar level, finding Sugar Protector has been a
relief. I feel a lot a lot more in control, and my current
examinations have revealed positive renovations. Understanding I have a reputable
supplement to support my routine gives me comfort.
I’m so thankful for Sugar Defender’s effect on my health!
sugar defender
sugar defender Uncovering Sugar Protector has actually been a game-changer for me,
as I have actually constantly been vigilant about handling
my blood sugar levels. I currently feel equipped
and certain in my ability to preserve healthy and balanced levels, and my newest
checkup have shown this progression. Having a credible supplement to enhance my a significant source of convenience, and I’m absolutely appreciative for
the considerable distinction Sugar Protector has made in my overall health.
sugar defender
This blog was… how do you say it? Relevant!! Finally I have found something that helped me. Thanks!
I blog frequently and I truly appreciate your content. The article has truly peaked my interest. I’m going to book mark your blog and keep checking for new details about once a week. I opted in for your Feed too.
Next time I read a blog, Hopefully it won’t disappoint me just as much as this particular one. After all, I know it was my choice to read through, nonetheless I genuinely thought you would have something interesting to talk about. All I hear is a bunch of moaning about something that you could possibly fix if you were not too busy searching for attention.
I’m extremely pleased to find this website. I need to to thank you for your time for this particularly wonderful read!! I definitely loved every bit of it and i also have you saved as a favorite to check out new things on your web site.
The very next time I read a blog, I hope that it won’t disappoint me as much as this one. After all, I know it was my choice to read, but I truly thought you would probably have something useful to say. All I hear is a bunch of crying about something that you could possibly fix if you weren’t too busy seeking attention.
I could not refrain from commenting. Well written!
Having read this I thought it was very informative. I appreciate you finding the time and energy to put this content together. I once again find myself spending a significant amount of time both reading and posting comments. But so what, it was still worth it!
Spot on with this write-up, I honestly believe that this amazing site needs a lot more attention. I’ll probably be back again to read more, thanks for the advice.
Aw, this was an incredibly good post. Taking a few minutes and actual effort to generate a really good article… but what can I say… I hesitate a whole lot and never manage to get anything done.
Hi, I do think this is a great site. I stumbledupon it 😉 I may revisit once again since i have book marked it. Money and freedom is the greatest way to change, may you be rich and continue to help others.
Good information. Lucky me I recently found your blog by accident (stumbleupon). I’ve bookmarked it for later.
A motivating discussion is worth comment. I believe that you need to publish more about this subject, it might not be a taboo subject but generally people do not speak about these subjects. To the next! Kind regards.
I love it when people come together and share thoughts. Great site, stick with it.
You should be a part of a contest for one of the best websites on the internet. I’m going to highly recommend this website!
Great web site you have got here.. It’s difficult to find high-quality writing like yours these days. I honestly appreciate people like you! Take care!!
After I initially commented I appear to have clicked on the -Notify me when new comments are added- checkbox and now whenever a comment is added I get 4 emails with the same comment. There has to be an easy method you can remove me from that service? Thank you.
It’s always good to see it from a different perspective My experience confirms that. I have to think about it some more. Can you expand on this?
I’m amazed, I must say. Seldom do I encounter a blog that’s both equally educative and entertaining, and let me tell you, you’ve hit the nail on the head. The issue is something which too few men and women are speaking intelligently about. Now i’m very happy I came across this in my search for something regarding this.
Way cool! Some extremely valid points! I appreciate you writing this write-up plus the rest of the site is also very good.
I am impressed with this site, very I am a fan .
Thanks for the a new challenge you have exposed in your blog post. One thing I’d like to comment on is that FSBO relationships are built as time passes. By presenting yourself to owners the first weekend their FSBO will be announced, prior to masses get started calling on Monday, you develop a good interconnection. By sending them tools, educational elements, free records, and forms, you become the ally. By using a personal interest in them and their predicament, you generate a solid connection that, oftentimes, pays off if the owners decide to go with a realtor they know plus trust — preferably you.
I must thank you for the efforts you have put in penning this website. I’m hoping to view the same high-grade content by you later on as well. In fact, your creative writing abilities has encouraged me to get my very own site now 😉
I was able to find good information from your blog articles.
After study several of the content on the internet site now, and that i genuinely much like your method of blogging. I bookmarked it to my bookmark internet site list and you will be checking back soon. Pls consider my website too and tell me what you consider.
I used to be able to find good info from your content.
Very good information. Lucky me I came across your website by chance (stumbleupon). I have saved as a favorite for later!
Wow, I guess you do learn something new everyday, more people should stumble onto this! You need some good SEO work!
Exactly what I was looking for, regards for posting .
Wow, wonderful blog layout! How long have you been blogging for? you make blogging look easy. The overall look of your web site is fantastic, let alone the content!
I think this is among the most vital info for me. And i’m satisfied studying your article. However should commentary on few normal things, The website taste is ideal, the articles is in reality excellent . Excellent activity, cheers.
I was able to find good information from your blog posts.
i use google when i want to do some spanish translation, it is good for general spanish translation,,
Every once in a while I find something worth reading when I’m surfing the internet. Bravo… thanks for creating real content here…
I don’t even know how I ended up here, but I thought this post was great. I do not know who you are but certainly you are going to a famous blogger if you are not already Cheers!
There couple of intriguing points soon enough in the following paragraphs but I do not determine if I see them all center to heart. There is some validity but I am going to take hold opinion until I consider it further. Great post , thanks and we want more! Put into FeedBurner too
Though some sort of taxation repayment may well appear to be safe, it really is not.
Having read this I thought it was really enlightening. I appreciate you spending some time and effort to put this information together. I once again find myself personally spending a significant amount of time both reading and leaving comments. But so what, it was still worthwhile!
I do believe all of the ideas you’ve presented for your post. They are very convincing and can definitely work. Nonetheless, the posts are very quick for starters. May you please prolong them a little from subsequent time? Thanks for the post.
Hi there! I simply want to offer you a big thumbs up for the excellent information you’ve got here on this post. I’ll be coming back to your site for more soon.
grand central stations are really built with some great architectural design, they are very impressive.
This internet site may be a walk-through it really is the knowledge you desired concerning this and didn’t know who need to. Glimpse here, and you’ll definitely discover it.
Excellent article. I am dealing with some of these issues as well..
This web page is actually a walk-through for all of the internet it suited you concerning this and didn’t know who ought to. Glimpse here, and you’ll definitely discover it.
There are a few fascinating points at some point in this post but I do not determine if I see all of them center to heart. There is some validity but I most certainly will take hold opinion until I take a look at it further. Good write-up , thanks so we want much more! Added to FeedBurner also
Thanks for every other wonderful article. Where else may anybody get that kind of information in such a perfect method of writing? I have a presentation next week, and I’m at the look for such info.
I blog often and I really appreciate your information. The article has truly peaked my interest. I am going to bookmark your blog and keep checking for new information about once a week. I opted in for your Feed too.
I really love your blog.. Pleasant colors & theme. Did you develop this website yourself? Please reply back as I’m wanting to create my own site and would love to find out where you got this from or exactly what the theme is called. Thank you!
I like this web site very much, Its a really nice post to read and get info .
One of the few things I liked in I Am Number Four is Teresa Palmer’s energetic performance.
I’m really enjoying the theme/design of your blog. Do you ever run into any web browser compatibility issues? A number of my blog audience have complained about my website not operating correctly in Explorer but looks great in Firefox. Do you have any advice to help fix this issue?
I want to convey my appreciation for your kind-heartedness in support of visitors who must have assistance with this particular situation. Your real dedication to passing the message all-around appears to be exceedingly functional and have regularly permitted most people much like me to reach their pursuits. The invaluable tips and hints signifies a lot a person like me and additionally to my colleagues. With thanks; from all of us.
Human growth hormone supplements have lots of benefits to provide specifically to those who are currently past the age of thirty. Hgh supplements have been proven efficient in dealing with particular problems related to aging and doesn’t trigger as much side effects in comparison with other forms of Human growth hormone products. Additionally, supplements are effective, risk-free as well as inexpensive unlike Human growth hormone injections.
Hello! I know this is kinda off topic but I’d figured I’d ask. Would you be interested in exchanging links or maybe guest writing a blog post or vice-versa? My website goes over a lot of the same topics as yours and I feel we could greatly benefit from each other. If you are interested feel free to send me an email. I look forward to hearing from you! Terrific blog by the way!
I am glad to be one of the visitors on this great website (:, appreciate it for posting .
An intriguing discussion might be priced at comment. I think that you need to write regarding this topic, it might not become a taboo subject but normally individuals are insufficient to speak on such topics. An additional. Cheers
dance shoes that are shiny are the most cool stuff that you could possibly wear*
This is a topic that is near to my heart… Many thanks! Where are your contact details though?
I was extremely pleased to uncover this site. I want to to thank you for ones time for this particularly wonderful read!! I definitely savored every little bit of it and I have you bookmarked to look at new stuff on your blog.
Audio began playing as soon as I opened this site, so frustrating!
i like the songs of Kid Cudi because they are a bit emotional and kinda hip.
I have noticed that car insurance organizations know the cars which are at risk of accidents and various risks. Additionally, these people know what type of cars are susceptible to higher risk as well as the higher risk they have got the higher the premium price. Understanding the basic basics with car insurance will assist you to choose the right style of insurance policy that may take care of your needs in case you happen to be involved in any accident. Appreciate your sharing your ideas with your blog.
there is a need for firming lotion so that we can always maintain the health of our skin ..
I discovered your website web site on bing and check a number of your early posts. Keep up the great operate. I just additional increase RSS feed to my MSN News Reader. Looking for toward reading a lot more from you down the road!…
An impressive share, I simply with all this onto a colleague who had previously been conducting a little analysis for this. And he the truth is bought me breakfast since I discovered it for him.. smile. So i want to reword that: Thnx for that treat! But yeah Thnkx for spending some time to debate this, I am strongly about this and enjoy reading much more about this topic. When possible, as you grow expertise, would you mind updating your site with an increase of details? It is actually extremely helpful for me. Big thumb up for this article!
You’ve made some good points there. I looked on the web to learn more about the issue and found most people will go along with your views on this web site.
I have caught great sites and I have caught not so wonderful blogs. This blog is very informationrmative in many ways and certainloy ranks in the former category. Really appreciate the information your providing use avid scaners!
Nice post. I was checking constantly this blog and I’m impressed! Very helpful information specifically the last part I care for such information much. I was seeking this particular info for a long time. Thank you and best of luck.
This is actually appealing, You’re a significantly seasoned author. I have joined with your feed plus expect witnessing the very good write-ups. And additionally, We’ve shared your web blog inside our social networking sites.
An intriguing discussion is definitely worth comment. I do think that you ought to write more about this topic, it may not be a taboo matter but generally folks don’t speak about such issues. To the next! Kind regards!
very good post, i undoubtedly really like this website, continue it
Greetings! Very helpful advice within this article! It is the little changes that make the largest changes. Thanks for sharing!
There is certainly a lot to find out about this subject. I really like all the points you’ve made.
Good post. I learn something new and challenging on blogs I stumbleupon every day. It’s always exciting to read articles from other writers and use something from other web sites.
Hi, i think that i saw you visited my weblog so i came to “return the favor”.I’m attempting to find things to improve my site!I suppose its ok to use some of your ideas!!
there are bronze and brass dining chairs too that looks very elegant because of their color;;
This web site is often a walk-through for all of the knowledge you wanted concerning this and didn’t know who must. Glimpse here, and you’ll absolutely discover it.
Aw, this was a very nice post. Taking a few minutes and actual effort to create a superb article… but what can I say… I put things off a lot and never manage to get anything done.
There is noticeably a lot of money to know about this. I suppose you have made specific nice points in features also.
Good post. I be taught one thing more challenging on completely different blogs everyday. It is going to always be stimulating to read content material from other writers and apply a little something from their store. I’d want to use some with the content on my blog whether or not you don’t mind. Natually I’ll offer you a link in your web blog. Thanks for sharing.
An intriguing discussion is worth comment. I do think that you need to publish more on this issue, it might not be a taboo matter but usually people don’t speak about these subjects. To the next! Many thanks.
I believe one of your ads caused my internet browser to resize, you might want to put that on your blacklist.
Greetings! Very useful advice in this particular article! It is the little changes which will make the largest changes. Many thanks for sharing!
Pretty! This has been an incredibly wonderful article. Many thanks for supplying this info.
I wanted to thank you for this very good read!! I absolutely enjoyed every little bit of it. I have got you bookmarked to look at new stuff you post…
I couldn’t resist commenting. Well written!
Oh my goodness! an amazing article dude. Many thanks Nonetheless I’m experiencing trouble with ur rss . Don’t know why Can not sign up for it. Is there anybody finding identical rss problem? Anyone who knows kindly respond. Thnkx
Couldn´t be written any kind of far better. Reading this post reminds me of my old room mate! He always kept talking about this. I can forward that article to him. Extremely sure he definitely will possess a excellent read. Thanks for sharing!
I love looking through a post that can make people think. Also, thanks for permitting me to comment.
Does a one day job count as “Work Experience” under the common application?
Some really quality blog posts on this site, saved to fav.
Pretty! This was an extremely wonderful article. Many thanks for providing these details.
It’s essential to have having access to the knowledge posted here
hello your own weblog design is quite good, clean as well as clean so with updated content material, make men and women really feel serenity and i also constantly get pleasure from searching the site.
After checking out a few of the blog posts on your blog, I seriously like your way of blogging. I book-marked it to my bookmark website list and will be checking back in the near future. Please check out my website too and let me know how you feel.
You should be a part of a contest for one of the best sites online. I will recommend this blog!
Saved as a favorite, I love your web site.
Good blog you have got here.. It’s hard to find excellent writing like yours these days. I truly appreciate individuals like you! Take care!!
After I initially left a comment I appear to have clicked the -Notify me when new comments are added- checkbox and now every time a comment is added I get four emails with the exact same comment. There has to be a means you are able to remove me from that service? Thanks.
I blog often and I really appreciate your information. The article has really peaked my interest. I am going to take a note of your website and keep checking for new details about once per week. I subscribed to your Feed too.
I enjoy reading through an article that will make people think. Also, thanks for allowing for me to comment.
I couldn’t refrain from commenting. Exceptionally well written.
Saved as a favorite, I really like your website.
I needed to thank you for this wonderful read!! I absolutely loved every little bit of it. I have got you saved as a favorite to check out new stuff you post…
An impressive share! I have just forwarded this onto a colleague who had been doing a little research on this. And he actually ordered me breakfast simply because I found it for him… lol. So let me reword this…. Thank YOU for the meal!! But yeah, thanx for spending some time to talk about this matter here on your website.
This is a great tip especially to those fresh to the blogosphere. Simple but very accurate info… Appreciate your sharing this one. A must read post!
An interesting discussion is worth comment. I do believe that you ought to write more about this subject matter, it might not be a taboo matter but typically people don’t discuss these subjects. To the next! All the best.
Next time I read a blog, I hope that it doesn’t fail me as much as this one. After all, Yes, it was my choice to read, nonetheless I genuinely believed you would have something useful to say. All I hear is a bunch of crying about something you could possibly fix if you weren’t too busy seeking attention.
Having read this I believed it was extremely informative. I appreciate you finding the time and effort to put this short article together. I once again find myself spending way too much time both reading and commenting. But so what, it was still worth it!
Excellent post! We are linking to this great post on our website. Keep up the good writing.
This is a topic which is near to my heart… Thank you! Where can I find the contact details for questions?
I absolutely love your blog.. Very nice colors & theme. Did you make this web site yourself? Please reply back as I’m wanting to create my very own site and would love to find out where you got this from or exactly what the theme is named. Kudos.
This website was… how do you say it? Relevant!! Finally I have found something that helped me. Thank you!
I really like looking through a post that will make people think. Also, many thanks for allowing for me to comment.
Saved as a favorite, I love your website.
Greetings! Very helpful advice within this article! It is the little changes that will make the most significant changes. Thanks for sharing!
Aw, this was a really nice post. Taking a few minutes and actual effort to produce a really good article… but what can I say… I put things off a lot and don’t seem to get anything done.
Watch our exclusive Neerfit sexy bf video on neerfit.co.in.
I needed to thank you for this wonderful read!! I definitely loved every bit of it. I have got you book-marked to look at new stuff you post…
Your style is unique compared to other folks I have read stuff from. Many thanks for posting when you’ve got the opportunity, Guess I’ll just book mark this blog.
The very next time I read a blog, I hope that it won’t disappoint me as much as this one. After all, I know it was my choice to read through, nonetheless I actually thought you’d have something useful to talk about. All I hear is a bunch of moaning about something you can fix if you were not too busy searching for attention.
Hey there! I just would like to give you a huge thumbs up for the great information you have here on this post. I’ll be returning to your site for more soon.
Good post. I learn something new and challenging on sites I stumbleupon everyday. It’s always useful to read articles from other authors and practice a little something from their web sites.
Good blog you have got here.. It’s difficult to find quality writing like yours nowadays. I honestly appreciate individuals like you! Take care!!
Hi there! This post couldn’t be written much better! Looking through this post reminds me of my previous roommate! He always kept talking about this. I’ll send this article to him. Pretty sure he’ll have a very good read. Many thanks for sharing!
bookmarked!!, I love your website!
You’ve made some good points there. I checked on the net for more information about the issue and found most people will go along with your views on this website.
Good day! I could have sworn I’ve visited this blog before but after going through a few of the posts I realized it’s new to me. Regardless, I’m definitely delighted I came across it and I’ll be bookmarking it and checking back frequently!
Excellent post. I am facing a few of these issues as well..
Spot on with this write-up, I actually think this website needs a lot more attention. I’ll probably be back again to read through more, thanks for the advice.
Certainly with your thoughts here and that i love your blog! I’ve bookmarked it making sure that I can come back & read more in the foreseeable future.
I’m amazed, I have to admit. Rarely do I come across a blog that’s both equally educative and interesting, and without a doubt, you have hit the nail on the head. The issue is an issue that not enough people are speaking intelligently about. Now i’m very happy that I came across this in my search for something concerning this.
Spot on with this write-up, I seriously think this website needs a lot more attention. I’ll probably be returning to read through more, thanks for the information.
Good post. I learn something new and challenging on blogs I stumbleupon everyday. It will always be useful to read through articles from other writers and practice something from other sites.
This is a topic which is near to my heart… Best wishes! Exactly where can I find the contact details for questions?
Spot lets start on this write-up, I truly feel this website needs a lot more consideration. I’ll apt to be again to learn to read additional, thank you that information.
I cannot thank you fully for the posts on your web page. I know you set a lot of time and effort into them and really hope you know how deeply I enjoy it. I hope I’m able to do something identical man or woman someday.
Magnificent goods from you, man. I have understand your stuff previous to and you are just extremely fantastic. I really like what you’ve acquired here, really like what you’re saying and the way in which you say it. You make it enjoyable and you still care for to keep it smart. I can not wait to read much more from you. This is actually a wonderful web site.
i love the smile of Rachel Bilson, i got a huge crush on her*
dj equipments that are built by Sennheiser are the best in my opinion, we always use them when we have a gig::
I discovered your site website on bing and check some of your early posts. Always maintain inside the great operate. I recently additional encourage RSS feed to my MSN News Reader. Looking for forward to reading more within you at a later time!…
Me gustaría decir lo que una ayuda para encontrar a alguien que sabe realmente lo que son hablar acerca de internet. Definitivamente sabe consejos transmitir un problema a la luz y hacer importantes. Más individuos deben leer y comprender este aspecto de la historia. No puedo considero youre no más común porque tiene sin duda el regalo.
I am continually searching online for tips that can benefit me. Thanks!
Fantastic website, Simply wanted in order to opinion will not connect with the actual rss or atom flow, you may want set up the proper extension for your in order to workthat.
Thank you for the sensible critique. Me & my cousin were just preparing to do a little research about this. We grabbed a book from our local library but I think I learned more from this post. I am very glad to see such great info being shared freely out there…
Hawkins, Christopher. “The life and adventures of Christopher Hawkins, a prisoner on board the ‘Previous Jersey’ prison ship in the course of the Warfare of the Revolution.” Holland Membership.
Not so fast. Any landscape analysis should take those lines into account — especially when planning tree patterns and growth.
He tempted prospects by the tens of millions with steeply discounted merchandise — all the things from soap to power tools — and threw in free transport, too.
These travels made Marco the primary European to see the width and breadth of the nation.
If you are filing a joint return, figure your energy efficient dwelling improvement credit score as follows.
During these years, guest authors and co-authors included Harry R. (“Rick”) Moody, Director of Academic Affairs at the AARP; Janice I. Wassel, Director of The Gerontology Program at the University of North Carolina at Greensboro; Robert C. Atchley, Director of the Scripps Gerontology Center at the Miami University of Ohio; and Steven J. Devlin, a former vice-provost at Lehigh University.
Conversely, the diversified portfolio’s return will always be higher than that of the worst-performing investment.
You may then put up to all of the legal entities, or a subset of them, from the preview itself.
CIA Internet site. The President’s International Intelligence Advisory Board includes individuals from the non-public sector who examine how well the CIA is doing its job and the effectiveness of its structure.
I won’t repeat all of the vendor information that’s on my companion web page about buying a regulation checkers set: checker-sets.html .
Groups of two to three volunteers can simply fill sandbags, taking simple safety precautions, equivalent to carrying gloves to handle the chemically handled baggage.
Niarchos did not specify or reportedly even know the exact length of Onassis’s yacht.
But both are not on the same page as far as a separate debt office and setting up of a monetary policy committee (within the new policy framework) are concerned.
Brian Clarke was born in Oldham, Lancashire, to Edward Ord Clarke, a coal miner, and Lilian Clarke (née Whitehead), a cotton spinner.
Choices for making a cool roof embody supplies like modified bitumen, single-ply membranes, cool roof coatings and even green (vegetated) roofs.
Password management and enforcement is another aspect of logical safeguards that are covered by IT risk assessments.
Now ship the elephant out to collect other tasty Halloween treats.
A database that contains data but is not part of any series of steps to deliver business value using that data.
B2B operators can supply their shoppers exceptional European tours, while DMCs leverage their experience to broaden their reach.
It is solely natural: Girls with straight hair would often kill for a curly hair day.
Coping with a couple of defeats and a little bit of supporter unrest was nothing too disturbing this early in the season and it’s not like we hadn’t experienced all of it earlier than once we first received promoted to the Conference South.
The outfit is anticipated to sell for $3,000 (£2,073) or more.
The shut proximity of the kitchen to dining and residing areas makes the space appear intimate and is good when family and friends assemble.
It is professional trade that calls for great caution combined with speculation to achieve success.
After three unsuccessful makes an attempt at gaining an advantage with 1.e4, Karjakin performed 1.d4 for the primary time in the match.
It is most often used for the acquisition of a large merchandise like a automobile.
Hearth is considered a medium by way of which spiritual perception and knowledge is gained, and water is taken into account the source of that wisdom.
At 15 seasons, he holds the record for most consecutive seasons of winning a minimum of one race (shared with Hamilton), and he holds the file for most wins at the identical venue (eight, on the Magny-Cours circuit in France) and in addition the record for the most wins in the same Grand Prix (eight, France).
If you are not at all positive in regards to the stocks then the neatest thing is to wait for the right time and make a superb research of the same after which proceed in the direction of making the right funding in the market.
Also, the Guidelines stop paying interest altogether as of 2013, and make the mistake of converting back to Sol at the average foreign exchange rate of 2013, instead of the exchange rate in effect at the time of actual payment – which, pursuant to the Guidelines, may occur many years from now.
But even Beyoncé is aware of that nice inspiration can be discovered from past artists all through history – when you’re searching for an outfit that screams “Renaissance”, why not lean into the pun with an outfit inspired by artists like Da Vinci and Michaelangelo?
One other facet of Firefox versus Web Explorer security is the fact that Firefox is an open supply program.
Unlike France and Britain, at the outbreak of the First World War Germany found itself largely excluded from international financial markets.
The vast majority are solely rich to the extent that they have a lease of a chunk of actually low high quality land in a fantastic a part of the nation where folks want to reside.
In here, such investment vehicle is termed as stock options.
When the World Stopped Making Sense, set in the dark Ages.
From flowing tulle skirts to corseted bodices and intricate lace accents, there are countless possibilities to convey your gothic imaginative and prescient to life.
I like to think I’m a laugh riot.
Once your arms get wet, it’s easy to lose your grip on clean, slick surfaces.
Thus, though White possesses the bishop pair, it’s normally advisable for Black to open the sport quickly to exploit their lead in development.
The standard terminology and examples of business models do not apply to most nonprofit organizations, since their sources of income are generally not the same as the beneficiaries.
This means the payments made to the shareholders are first paid to the preference shareholder(s) and then to the fairness shareholders.
Checkout the whole new collection of emerald cut ruby rings at GemsNY, in their big selection of jewelry that is beautiful and irresistible.
Vintage fashion is sizzling, and it’s everywhere.
One out of the seventeen FOMC participant said within the April meet that additional steadiness sheet motion within the near-time period can be acceptable so as to mitigate downside dangers to economic progress.
Incentive inventory choices (ISOs) are solely accessible for employees and other restrictions apply for them.
Reports from DR Horton, a publicly traded national builder, show orders are 45 percent above levels from the prior year and cancellation rates dropping from 38 percent to 26 percent.
Each report has four tracks keyed by color and associated to a kind of musical instrument akin to drums, guitar or vocals.
If you become a member of an internet stock mercantilism platform, one that gives solutions on the far side brokerage, you’ll get tailor created stock tips in correct together with your mercantilism objectives.
If you buy a Volt or have your Prius transformed, precisely where are you going to plug it in?
If the latter is the case, then as a client decreases consumption of 1 good in successive items, successively larger doses of the opposite good are required to keep satisfaction unchanged.
Either a 153-cid Super-Thrift 4-cylinder engine or 194-cid six offered the facility.
Great Britain’s neglect, in the absence of the anticipated supplies from Patriots, resulted in starvation and illness.
But, in accordance with a examine within the Journal of the Society of Beauty Chemists, petroleum jelly’s pore-clogging reputation may be as mythical as wrinkle-free aging.
This article appears at some of the important causes for availing traveller insurance.
Have your luggage packed the night time earlier than.
GOODE, HUGHES, KLEPPER, LOVETT, SMITH Greer County: Mangum Day by day Star, Thursday, September 11, 1975 HUGHES Funeral services for E. W. (Bill) HUGHES, retired Mangum mechanic, have been held at eleven a.m.
It seeks to identify long term secure trends that are likely to shape the world we live in and will be the driving forces behind the financial markets in future.
One of the most powerful pre-war vehicles ever produced, which model hit the streets a year before the stock market crashed?
Transmission and drivetrain are important components in figuring out towing capability.
In case you have an incredible thought for starting your own enterprise, the Strength Tarot Card encourages you to faucet into your internal power and power to succeed.
Online bill cost is also safer than the snail-mail methodology: Your personal data is way more vulnerable to theft if it is on paper and physically transferring via the postal system.
Eventually, cities began to gather trash, however typically garbage was hauled to dumps – open holes in the ground – the place it usually was burned, creating air pollution that was a hazard to human health.
The world of forex trading has two predominant schools of thought.
Because of this, universities are at all times appealing to alumni and others in the community for monetary gifts, so donating is a wonderful solution to help your favorite program.
In reality, New World is the headquarters for the Intelligence’s new plan to conquer the world by infecting all the computer systems.
This country works as a monarchy, but a special household guidelines each of the emirates.
McClain, Dylan Loeb (30 April 2023).
In September 2020, vulnerabilities in MTI’s website were exposed by Anonymous ZA and a MyBroadband investigative journalist, leading to worldwide warnings against the company.
After all you needed to order the Deluxe to get this interior; cheaper fashions had more austere upholstery.
That means that people will have much less disposable income, and can afford less, as the middle class and poor are squeezed by the rising cost of living.
If the experience of Deus Ex taught me one factor, it’s the importance of workforce dynamics.
Watch our most viewed super sexy bf video on socksnews.in. sexy bf video Watch now.
What truck sells the best in Canada?
The aim and the that means of existence is to strive upward past the boundaries of the known, and to help each other.
By 1877, when “Paris: A Rainy Day” was finished, the city of Paris had gone through a major transitional period.
The company did the identical things all recreation firms do, went through the same issues, however because we painted an enormous ol’ “suck it down” target on our chests, the gaming press and a fair variety of hardcore players went after us with a vengeance.
This section possibly comprises original research.
Thanks for sharing. Like your post.Name
Within the Nationwide Hockey League, the season was suspended for an indefinite amount of time, affecting the Pittsburgh Penguins and Philadelphia Flyers.
https://www.leodirectory.com/premium-flower-delivery-dubai-fresh-elegant-blooms/
Well written!
Indian Taxation System has labeled more than 1211 merchandise for requiring of products and Services Tax below 6 normal classifications or assessment pieces.
A VPS means that you can trade the Forex and have your account open and your transactions open even in case your laptop is off.
But it’s clear that in order to boost fuel mileage and still hold on to the gains made safety, comfort, and performance, automakers will have to embrace different methods than the ones dominant today.
After study many of the web sites for your internet site now, i really appreciate your strategy for blogging. I bookmarked it to my bookmark site list and will be checking back soon. Pls have a look at my web-site too and figure out what you consider.
Thank you for sharing this good write-up. Very inspiring! (as always, btw)
An impressive share, I just given this onto a colleague who was carrying out a little analysis within this. And the man in fact bought me breakfast because I came across it for him.. smile. So ok, i’ll reword that: Thnx to the treat! But yeah Thnkx for spending time go over this, I’m strongly about it and enjoy reading much more about this topic. If you can, as you become expertise, can you mind updating your website to comprehend details? It truly is highly great for me. Big thumb up just for this short article!
Shortly after his victory, Carlsen talked about that he might not be motivated enough to play one other world championship match unless the challenger was Alireza Firouzja, an 18-yr-previous prodigy who had risen to quantity two on the planet rankings.
For example, a large pool with plenty of bushes around may require a more highly effective pump and a bigger filter.
There are online companies focusing on providing prepared-made Non-public Placement Memorandum with all the authorized modalities included, along with a subscription settlement and funding questionnaire.
Which college did NBA superstar LeBron James play for?
Unfortunately, some troopers have found it not possible to open the doorways if the locks are damaged out in the field.
Residents or traders of Fairfield nation are in luck.
At first, it was merely a “quotation system” and did not present a approach to carry out digital trades.
Interiors will feature handcrafted real wooden trim, actual metal accents, delicate-touch supplies, 12-speaker Bang & Olufsen luxurious sound system, twin panel panoramic glass roof with energy shade, gentle premium diamond-quilted perforated leather-based climate-controlled and massaging seats with French seam stitchwork, smooth leather-based wrapped sprint, steering wheel, and door panels with single and double stitched ornamental stitchwork.
The following year brought another interesting new option: all-wheel drive, a part-time “shift-on-the-fly” setup intended for maximum traction on slippery roads, not dry-pavement driving or off-roading.
The airport has understood its accountability in direction of the atmosphere.
It definitely seems costly, but fact be informed, there are some dishes out there that make Mallie’s “Completely Ridiculous Burger” appear low cost.
I fully agree with this. There’s a similar post on Thew14.com that explores this topic, and it provides further insights that align with your argument.
I couldn’t agree more with this comment. It reflects a perspective I’ve seen before in various discussions on Thew14.com, which offers some great insights into this matter.
Is it dangerous if a baby eats dog food?
These pieces can never be considered as old school.
I enjoy reading a post that can make men and women think. Also, thank you for allowing me to comment.
Thanks so much for sharing all of the awesome info! I am looking forward to checking out more posts!
I truly love your site.. Very nice colors & theme. Did you build this web site yourself? Please reply back as I’m attempting to create my own personal blog and would like to find out where you got this from or exactly what the theme is named. Cheers.
Green bangles, mangalsutras, conventional necklaces, and a classic Maharashtrian Nath are worn by Maharashtrian brides.
Youre so cool! I dont suppose Ive read anything similar to this prior to. So nice to discover somebody with original ideas on this subject. realy we appreciate you beginning this up. this fabulous website can be something that is needed on the internet, someone with a bit of originality. helpful work for bringing new stuff on the world wide web!
Saved as a favorite, I really like your web site!
I like reading through an article that can make people think. Also, many thanks for allowing for me to comment.
I really like it when folks come together and share opinions. Great blog, keep it up.
This blog was… how do I say it? Relevant!! Finally I’ve found something which helped me. Cheers.
Having read this I thought it was very informative. I appreciate you taking the time and effort to put this content together. I once again find myself personally spending a significant amount of time both reading and posting comments. But so what, it was still worth it.
You’re so cool! I do not suppose I’ve truly read through something like that before. So good to find somebody with some genuine thoughts on this topic. Seriously.. thanks for starting this up. This website is one thing that’s needed on the web, someone with a bit of originality.
After exploring a handful of the articles on your web page, I seriously like your way of writing a blog. I book-marked it to my bookmark site list and will be checking back in the near future. Take a look at my web site as well and tell me your opinion.
I couldn’t resist commenting. Exceptionally well written.
i was home schooled when i was still very young and i have to stay that it is also a great way to educate your kids,,
I need to to thank you for this very good read!! I absolutely loved every bit of it. I have you book-marked to check out new stuff you post…
Thanks for making the effort to line all this out for us. This kind of post was in fact quite helpful in my opinion.
This new use works greatest with lamps that may handle the outdoors.
Usually I don’t comment on your blog. I am more of the silent type but I wonder, is this wordpress because I am thinking of switching my own blog from blogspot to wordpress.
Your style is really unique compared to other folks I have read stuff from. Many thanks for posting when you’ve got the opportunity, Guess I will just book mark this site.
Cool. – Gulvafslibning | Kurt Gulvmand looks great, and I’m glad i’ve found something here worth adding to my favorites.
After going over a handful of the articles on your site, I honestly appreciate your technique of writing a blog. I bookmarked it to my bookmark webpage list and will be checking back in the near future. Take a look at my website too and tell me what you think.
After i open up your own Feed it offers myself with many different garbled text message, could be the concern on my small conclusion?
This website was… how do you say it? Relevant!! Finally I’ve found something which helped me. Kudos!
It can be difficult to write about this subject. I think you did an excellent job though! Thanks for this!
Karjakin tried to actively search counterplay, but Carlsen fended him off and simplified right into a successful endgame, earning Karjakin’s resignation.
we can always give food aid to the african countries if we just save some pennies and donate it to them~
The stop order is placed at a specific price below the current market, such that if the price is triggered, will convert into a market order.
There’s certainly a lot to know about this subject. I really like all of the points you made.
An outstanding share! I have just forwarded this onto a co-worker who has been conducting a little homework on this. And he in fact bought me dinner simply because I stumbled upon it for him… lol. So let me reword this…. Thank YOU for the meal!! But yeah, thanx for spending some time to talk about this matter here on your web site.
Excellent read, I just passed this onto a friend who was doing some research on that. And he actually bought me lunch because I found it for him smile Thus let me rephrase that: Thank you for lunch!
Thanks for your insight for the great posting. I am glad I have taken the time to see this.
Having read this I believed it was rather enlightening. I appreciate you finding the time and energy to put this informative article together. I once again find myself spending a significant amount of time both reading and posting comments. But so what, it was still worthwhile.
Having Get Reports Write-up Submission move Product, you can actually shift deeper and even speedier than you’ve ever imagined on the subject of what you can do internet.
Can I recently say such a relief to find somebody that truly knows what theyre referring to on-line. You certainly have learned to bring a concern to light making it essential. The diet have to ought to see this and appreciate this side on the story. I cant think youre less common because you certainly have the gift.
Good day! I could have sworn I’ve visited this blog before but after going through some of the articles I realized it’s new to me. Anyways, I’m definitely pleased I stumbled upon it and I’ll be book-marking it and checking back regularly!
Southwick, Ron (July 14, 2020).
I need to to thank you for this good read!! I certainly enjoyed every little bit of it. I have got you bookmarked to check out new stuff you post…
i am addicted to computer games that is why i bought a gamecube for me and my brother,.
How is it that just anyone can write a weblog and get as popular as this? Its not like youve said something extremely impressive more like youve painted a fairly picture through an issue that you know nothing about! I dont want to sound mean, right here. But do you really think that you can get away with adding some pretty pictures and not definitely say anything?
hi. I notice that you were involved in creating quality backlinks and stuff. I’m selling scrapebox auto approve lists. Would you like to trade ?
Spot on with this write-up, I honestly believe that this site needs a lot more attention. I’ll probably be returning to read through more, thanks for the info.
It’s a really amazing powerful resource that you’re offering and you just provide it away cost-free!! I that can compare with discovering websites which be aware of the particular in supplying you with fantastic learning resource for zero cost. We truly dearly loved examining these pages. Appreciate it!
Thank you a bunch for sharing this with all folks you actually realize what you’re speaking approximately! Bookmarked. Kindly additionally seek advice from my site =). We could have a link trade contract between us!
Hiya! I randomly stumbled upon your blog from Bing. Your article is filled with interesting information, and I will definitely use it at some point in my career. Keep up the excellent work!
I love reading your blog because it has very interesting topics.:-`”‘
gaming computers should have multiple cpu cores and a lot of memory to support those heavy graphics“
Right here is the right blog for anyone who would like to find out about this topic. You understand a whole lot its almost tough to argue with you (not that I really would want to…HaHa). You certainly put a new spin on a subject that’s been written about for years. Wonderful stuff, just excellent.
I love reading through an article that will make men and women think. Also, thanks for allowing me to comment.
Cool news it is really. I’ve been waiting for this tips.
Hey There. I found your blog using msn. This is a very well written article. I’ll make sure to bookmark it and return to read more of your useful information. Thanks for the post. I’ll definitely return.
ceramic floor tiles are the best, i used to have linoleum tiles but they do not last very long;
Many thanks for posting this, It?s simply what I used to be researching for on bing. I?d a lot comparatively hear opinions from an individual, slightly than a company web page, that?s why I like blogs so significantly. Many thanks!
F*ckin? tremendous things here. I am very satisfied to see your post. Thank you so much and i’m taking a look forward to contact you. Will you please drop me a mail?
*When I originally commented I clicked the -Notify me when new comments are added- checkbox and now each time a comment is added I get four emails with the same comment. Is there any way you can remove me from that service? Thanks!
I really like it when people come together and share views. Great site, keep it up.
Very good post. I will be dealing with a few of these issues as well..
This web site truly has all the information and facts I wanted about this subject and didn’t know who to ask.
I blog quite often and I truly appreciate your content. This article has truly peaked my interest. I am going to book mark your site and keep checking for new details about once a week. I opted in for your RSS feed as well.
I will immediately take hold of your rss feed as I can’t in finding your e-mail subscription hyperlink or e-newsletter service. Do you have any? Kindly allow me recognise so that I may just subscribe. Thanks.
My friend first found your blog on Google and she referred your blog to me.`’;\’;
Very interesting points you have noted , regards for posting .
Walking on the smooth white sand of the sea floor gives a cinematic view of marine life.
Great write-up, I am normal visitor of one?s blog, maintain up the excellent operate, and It is going to be a regular visitor for a long time.
Wow, awesome weblog structure! How lengthy have you ever been running a blog for? you made running a blog glance easy. The whole look of your website is magnificent, let alone the content material!
I’m a blog crazed person and i love to read cool blog like yours.~`;.,
Thank you for your information and respond to you. bad credit auto loans hawaii
howdy, I am ranking my site higher “cb auto profits”.
As I website possessor I believe the content matter here is rattling fantastic , appreciate it for your efforts. You should keep it up forever! Best of luck.
Wonderful article! We will be linking to this particularly great post on our site. Keep up the great writing.
Aw, this was an incredibly nice post. Spending some time and actual effort to produce a very good article… but what can I say… I put things off a lot and never seem to get nearly anything done.
Great post! We are linking to this particularly great post on our site. Keep up the good writing.
Your style is really unique in comparison to other people I’ve read stuff from. I appreciate you for posting when you’ve got the opportunity, Guess I’ll just bookmark this page.
Youre so cool! I dont suppose Ive read anything like this before. So nice to find somebody with original thoughts on this subject. realy i appreciate you for beginning this up. this site is one area that is required on the internet, an individual after some originality. useful job for bringing new stuff to your net!
Hello, my group is just establishing our first website, searching and working out what is needed. This blog stuck out right away. I’m fired up about this, and adore the design of your site. Are you able to let me know what “theme” it is?
Absolutely composed written content , thanks for information .
EPA has given native councils powers to manage this sort of noise.
Good post. I am facing many of these issues as well..
Great article! We are linking to this particularly great post on our website. Keep up the great writing.
My spouse and i felt very fortunate when Michael managed to conclude his basic research through the ideas he had from your own web pages. It’s not at all simplistic to just possibly be offering solutions that others could have been making money from. And now we discover we need you to thank for this. The most important illustrations you made, the simple site navigation, the relationships you give support to create – it’s many overwhelming, and it’s really leading our son and our family feel that this subject matter is exciting, which is really mandatory. Thanks for the whole lot!
I concur with your conclusions and will eagerly watch forward to your future updates. The usefulness and significance is overwhelming and has been invaluable to me!
This is a excellent blog, will you be interested in doing an interview about how you developed it? If so e-mail me!
I seriously love your blog.. Pleasant colors & theme. Did you make this web site yourself? Please reply back as I’m trying to create my own site and want to know where you got this from or what the theme is called. Thank you.
Because the farm-to-table movement grows, they’re springing up everywhere in the place.
Six to twelve months earlier than the marriage is also an appropriate window to hire a Destination Marriage ceremony Planner in Delhi, but it might require some flexibility with dates and venues.
Most of the regular stock buyers started to stroll away from the share markets, but few people who are intelligent purchased the shares which have been at an unbelievable decrease price.
U.S. output and real exchange rates.
Just be aware that there’s no hyperlink you may get to create a non-public game however you may simply all comply with log into the same enjoying room and signing-up is required.
When you have a storage then you’ve got a garage door opener, a remote control machine that you need to use to open and shut your storage door from inside your automotive and even inside your home.
Just right points?I’d word that as anyone who truly doesn’t write on blogs a lot (if truth be told, this can be my first put up), I don’t assume the term ‘lurker’ may be very changing into to a non-posting reader. It’s not your fault the least bit , however most likely the blogosphere may get a hold of a better, non-creepy name for the ninety people that experience reading the content .
Considerably, the post is in reality the finest on that laudable topic. I fit in with your conclusions and can eagerly look forward to your incoming updates. Saying thanks definitely will not simply just be enough, for the outstanding clarity in your writing. I will certainly at once grab your rss feed to stay privy of any kind of updates. Pleasant work and also much success in your business efforts!
I am lucky that I found this web blog, precisely the right information that I was searching for!
A hyper-efficient decentralized crypto marketplace built on Sui. Turbos finance Sui Trade Trade any crypto on Sui. Best prices are offered through aggregating liquidity.
Balances Active Orders Withdraw Deposit TradeOgre Logout · Sign In. Search: Currency, Market, Change, Price
A hyper-efficient decentralized crypto marketplace built on Sui. Turbos finance Trade Trade any crypto on Sui. Best prices are offered through aggregating liquidity.
I think other website proprietors should take this website as an model, very clean and wonderful user genial style and design, as well as the content. You are an expert in this topic!
Thanks for the good critique. Me & my neighbor were just preparing to do some research on this. We got a book from our area library but I think I’ve learned more from this post. I’m very glad to see such excellent information being shared freely out there..
very interesting subject , appreciate it for putting up.
Empower Your Crypto Journey
with Tangem Wallet
This is a topic that is close to my heart… Take care! Where can I find the contact details for questions?
Balances Active Orders Withdraw Deposit TradeOgre Logout · Sign In. Search: Currency, Market, Change, Price
Buy and sell Bitcoin, Ethereum, NoOnes and other cryptocurrencies Peer-to-Peer on NoOnes. Secure, fast, and user-friendly transactions on a trusted platform.
Having read this I believed it was really enlightening. I appreciate you spending some time and effort to put this informative article together. I once again find myself personally spending a lot of time both reading and commenting. But so what, it was still worth it.
Bpi net empresas Portugal, bpi net empresas Serviços. Plataforma de comunicação Multibancária · Canal SWIFT Net · App BPI Empresas · BPI Net Empresas. Tudo Sobre. Open Banking · Segurança Online
This is a topic that’s near to my heart… Best wishes! Exactly where can I find the contact details for questions?
Way cool! Some extremely valid points! I appreciate you penning this post and the rest of the site is very good.
You’re so awesome! I don’t believe I’ve truly read through anything like that before. So good to discover somebody with original thoughts on this subject. Seriously.. thanks for starting this up. This site is one thing that’s needed on the web, someone with a bit of originality.
I have to consider prospect of by way of thanking you actually for that quality recommendations May mostly demonstrated going over yuor web blog. We’re hopeful for your graduation about the actual or even look for in addition to the whole processing would not have already been finished whilst not coming over to your blog. Fundamentally may perhaps be in any assistance to the rest, Appraisal enjoy it in helping with what There are uncovered from this level.
This could be the right blog for everyone who is desires to be familiar with this topic. You already know much its practically not easy to argue along (not that I just would want…HaHa). You certainly put the latest spin with a topic thats been discussing for decades. Excellent stuff, just great!
Maud Jessie Johnson, JP, Divisional Director, British Pink Cross Society, Great Yarmouth.
An fascinating discussion will probably be worth comment. I believe that you ought to write more on this topic, may possibly not be described as a taboo subject but usually everyone is too little to communicate on such topics. To another location. Cheers
bookmarked!!, I really like your web site.
Schools like Texas A&M University and the College of Texas influence the culture and arts of surrounding towns.
Can I just say what a relief to find somebody who really understands what they’re talking about on the web. You definitely know how to bring a problem to light and make it important. More people must look at this and understand this side of your story. I can’t believe you are not more popular because you most certainly have the gift.
I quite like reading through an article that will make men and women think. Also, many thanks for allowing for me to comment.
There is definately a lot to learn about this topic. I really like all the points you have made.
Olive Kaer. For political and public service.
you could just listen to the beat of those high bass from Rap songs, i just like rap songs;;
Hello, I was researching the net and I came across your weblog. Keep up the excellent function.
I have to thank you for the efforts you have put in penning this site. I really hope to see the same high-grade content by you in the future as well. In fact, your creative writing abilities has inspired me to get my own site now 😉
Hi there, just became aware of your blog through Google, and found that it’s really informative. I’m gonna watch out for brussels. I will be grateful if you continue this in future. A lot of people will be benefited from your writing. Cheers!
New to your blog. Stumbled upon it browsing the web. Keep up the great work. I am hoping you update it regularly.
I’ve learn several just right stuff here. Certainly value bookmarking for revisiting. I surprise how much effort you put to create the sort of excellent informative web site.
Put together slaughter for his children for the iniquity of their fathers; that they don’t rise, nor possess the land, nor fill the face of the world with cities.
I discovered your blog post website on google and appearance a couple of your early posts. Preserve on the very good operate. I merely extra your RSS feed to my MSN News Reader. Looking for forward to reading far more within you down the line!…
Can I recently say what a relief to discover somebody that actually knows what theyre dealing with on the net. You certainly understand how to bring a difficulty to light to make it important. Workout . need to check this out and understand this side from the story. I cant think youre no more common when you certainly possess the gift.
You lost me, friend. I mean, I suppose I get what youre indicating. I realize what you are saying, but you just seem to have overlooked that there are some other individuals inside the world who look at this matter for what it definitely is and might not agree with you. You may be turning away a lot of folks who may have been supporters of your web site.
This is the right site for everyone who really wants to find out about this topic. You know so much its almost hard to argue with you (not that I personally will need to…HaHa). You definitely put a brand new spin on a subject that’s been written about for decades. Wonderful stuff, just excellent.
I really like looking through and I think this website got some really useful stuff on it! .
I believe that a simple and unassuming manner of life is best for everyone, best both for the body and the mind.
An interesting discussion might be priced at comment. I do think that you need to write read more about this topic, it might be described as a taboo subject but typically consumers are not enough to communicate on such topics. To another location. Cheers
Excellent post. I am experiencing some of these issues as well..
I need to to thank you for this good read!! I certainly enjoyed every little bit of it. I have got you saved as a favorite to check out new stuff you post…
I was able to find good information from your content.
“Hello! I could have sworn I’ve been to this blog before but after browsing through some of the post I realized it’s new to me. Anyways, I’m definitely happy I found it and I’ll be book-marking and checking back frequently!”
I’ve observed that in the world these days, video games are definitely the latest rage with kids of all ages. There are times when it may be extremely hard to drag your kids away from the video games. If you want the best of both worlds, there are lots of educational gaming activities for kids. Great post.
Thank you for this kind of information I was looking around all Yahoo to discover it!
Hi there! This blog post couldn’t be written much better! Looking through this post reminds me of my previous roommate! He constantly kept talking about this. I’ll send this article to him. Fairly certain he’s going to have a very good read. Many thanks for sharing!
Ford Motor Company. “Ford Automobiles: Assist – Glossary.” (Sept.
Your style is so unique compared to other people I’ve read stuff from. Thanks for posting when you’ve got the opportunity, Guess I’ll just bookmark this blog.
You need to take part in a contest for one of the most useful websites on the net. I am going to recommend this web site!
This site was… how do you say it? Relevant!! Finally I have found something that helped me. Thanks a lot!
The fee to upgrade the building to the required customary was estimated at NZ$3 million.
Hey i Love your work i really appreciate that. Also take a look at our special Gym flooring dubai
Good article. I definitely love this site. Keep it up!
This is a topic which is near to my heart… Take care! Where can I find the contact details for questions?
Way cool! Some extremely valid points! I appreciate you penning this write-up and also the rest of the site is also very good.
Can I simply say what a relief to uncover an individual who actually understands what they’re discussing on the net. You definitely realize how to bring an issue to light and make it important. More people have to check this out and understand this side of your story. It’s surprising you aren’t more popular because you definitely have the gift.
Aw, this was an exceptionally good post. Spending some time and actual effort to make a top notch article… but what can I say… I hesitate a lot and never manage to get anything done.
I wanted to thank you for this great read!! I definitely enjoyed every little bit of it. I have you saved as a favorite to look at new stuff you post…
Next time I read a blog, Hopefully it won’t fail me just as much as this one. After all, I know it was my choice to read through, however I actually thought you’d have something interesting to talk about. All I hear is a bunch of moaning about something that you could fix if you were not too busy looking for attention.
It’s hard to come by well-informed people on this topic, but you sound like you know what you’re talking about! Thanks
Aw, this was an incredibly good post. Spending some time and actual effort to produce a great article… but what can I say… I procrastinate a whole lot and never seem to get anything done.
The particular Amish’s important faith centered idea of Demut “humility”, plainly demonstrates the particular weak spot related to individualism as well as sociable school therefore well-known concerning individuals civilizations and also there exists a matching sturdiness relating to Amish party id.
After study a handful of the blog posts in your site now, we truly appreciate your method of blogging. I bookmarked it to my bookmark website list and will also be checking back soon. Pls take a look at my site also and tell me how you feel.
hello!,I love your writing very much! share we keep up a correspondence extra approximately your post on AOL? I require an expert in this area to resolve my problem. May be that is you! Having a look forward to see you.
This blog was… how do I say it? Relevant!! Finally I have found something which helped me. Thanks.
Very nice post. I absolutely love this website. Continue the good work!
An attention-grabbing dialogue is value comment. I believe that it is best to write extra on this subject, it won’t be a taboo subject however typically individuals are not enough to talk on such topics. To the next. Cheers
Can i get thumbs up never did? before (please ). … I love this song
Spot on with this write-up, I truly think this fabulous website needs far more consideration. I’ll more likely again you just read far more, thank you for that information.
Aw, this was an extremely good post. Taking the time and actual effort to produce a very good article… but what can I say… I put things off a lot and don’t seem to get nearly anything done.
Hi there! This article couldn’t be written any better! Looking at this article reminds me of my previous roommate! He continually kept talking about this. I will forward this information to him. Pretty sure he will have a great read. Thank you for sharing!
This web site definitely has all of the information and facts I needed concerning this subject and didn’t know who to ask.
After checking out a number of the blog articles on your blog, I truly appreciate your way of blogging. I added it to my bookmark website list and will be checking back in the near future. Take a look at my website too and let me know how you feel.
Great post, I think blog owners should larn a lot from this web blog its really user friendly .
Thanks, I enjoyed – Gulvafslibning | Kurt Gulvmand. It was good. View my blog sometime, it all about Altamonte Springs, FL Real Estate.
The next time I read a weblog, I hope that it doesnt disappoint me as a lot as this one. I mean, I know it was my choice to read, however I actually thought youd have something attention-grabbing to say. All I hear is a bunch of whining about something that you possibly can fix for those who werent too busy looking for attention.
I seriously love your blog.. Pleasant colors & theme. Did you make this site yourself? Please reply back as I’m attempting to create my very own website and would like to learn where you got this from or just what the theme is named. Cheers!
i have some small garden of herbs at home, i use them for baking foods and as herbal medicines~
This is an astonishing entry. Thank you very much for the supreme post provided! I was looking for this entry for a long time, but I wasn’t able to find a trustworthy source.
When I originally commented I clicked the -Notify me when new comments are added- checkbox now if a comment is added I buy four emails with similar comment. Could there be that is you are able to eliminate me from that service? Thanks!
TradeOgre is an online cryptocurrency exchange launched in 2018, providing a straightforward platform for buying, selling, and trading various digital assets.
I completely agree, this perspective makes a lot of sense. I recently found a very similar discussion on vb77.wiki, and it clarified some of the points you’ve made.
O BCE é o banco central dos ibercaja empresas países da UE que utilizam o euro. O nosso principal objetivo é a manutenção da estabilidade de preços. Para o efeito
Hello there! Do you know if they make any plugins to
help with Search Engine Optimization? I’m trying to get my blog to rank for some
targeted keywords but I’m not seeing very good results.
If you know of any please share. Appreciate it! I saw similar article here: Change your life
Any asset. RedStone supports secure price feeds for assets faster than competitors. RedStone has the deepest price discovery and most advanced pricing .
Very good written story. It will be helpful to everyone who usess it, including yours truly Smile. Keep doing what you are doing – i will definitely read more posts.
“To start earning money with your blog, initially use Google Adsense but gradually as your traffic increases”
Amazing blog! Do you have any suggestions for aspiring writers? I’m hoping to start my own site soon but I’m a little lost on everything. Would you suggest starting with a free platform like WordPress or go for a paid option? There are so many options out there that I’m completely overwhelmed .. Any ideas? Appreciate it!
This site was… how do you say it? Relevant!! Finally I have found something which helped me. Thanks.
Saved as a favorite, I like your website!
Terrific write-up! Thought about savored the actual scanning. I’m hoping you just read additional by you. There’s no doubt you could have wonderful awareness in addition to ability to see. My corporation is really prompted keeping this particulars.
I came across your blog’s link posted by a friend of mine on Facebook. Thanks for putting useful info on the internet. It’s tough to get these things these days.
An fascinating discussion will probably be worth comment. I believe that you ought to write more on this topic, may possibly not be described as a taboo subject but usually everyone is too little to communicate on such topics. To another location. Cheers
It’s nearly impossible to find knowledgeable people on this topic, however, you seem like you know what you’re talking about! Thanks
Greetings! Very useful advice in this particular post! It’s the little changes that make the most important changes. Many thanks for sharing!
Pretty! This has been a really wonderful article. Many thanks for supplying this info.
The next time I learn a weblog, I hope that it doesnt disappoint me as much as this one. I mean, I do know it was my option to learn, however I really thought youd have one thing interesting to say. All I hear is a bunch of whining about something that you may repair when you werent too busy looking for attention.
Thanks, I have recently been hunting for info about this subject matter for ages and yours is the best I have located so far.
Hey this is kinda of off topic but I was wanting to know if blogs use WYSIWYG editors or if you have to manually code with HTML. I’m starting a blog soon but have no coding experience so I wanted to get advice from someone with experience. Any help would be greatly appreciated!
I blog often and I really thank you for your content. The article has really peaked my interest. I’m going to book mark your website and keep checking for new details about once per week. I subscribed to your Feed too.
I am glad that I noticed this web blog, precisely the right info that I was looking for!
Spot i’ll carry on with this write-up, I honestly think this website needs much more consideration. I’ll oftimes be again to read much more, appreciate your that information.
Greetings! I’m impressed by the composition—it’s exceptional. In fact, your work brings a remarkable touch to the overall vibe. Impressive as always!
Hello! This is my first visit to your blog! We are a team of volunteers and starting a new initiative in a community in the same niche. Your blog provided us useful information to work on. You have done a outstanding job!
I thought it was incredibly useful, don’t understand some people, just ignore them and keep doing what you do best.
Very interesting details you have mentioned , appreciate it for putting up.
Aw, this was an exceptionally good post. Spending some time and actual effort to produce a good article… but what can I say… I put things off a whole lot and never seem to get anything done.
It’s hard to come by educated people about this subject, however, you seem like you know what you’re talking about! Thanks
Good day! I just want to give a huge thumbs up for the great info you might have here on this post. I will be coming again to your weblog for extra soon.
We stumbled over here different page and thought I may as well check things out. I like what I see so i am just following you. Look forward to checking out your web page yet again.
I’m very happy to read this. This is the type of manual that needs to be given and not the accidental misinformation that’s at the other blogs. Appreciate your sharing this greatest doc.
Audio began playing any time I opened up this webpage, so annoying!
bed sheets that are made of flannel fabric are the best type of bed sheets,
I’m impressed, I have to admit. Truly rarely do I encounter a weblog that’s both educative and entertaining, and let me tell you, you might have hit the nail on the head. Your thought is outstanding; the thing is something inadequate individuals are speaking intelligently about. We are happy we found this at my seek out some thing in regards to this.
the shoulder bags that my girlfriend uses are always made up from natural leather*
My spouse and I absolutely love your blog and find a lot of your post’s to be exactly what I’m looking for. can you offer guest writers to write content for yourself? I wouldn’t mind publishing a post or elaborating on a number of the subjects you write related to here. Again, awesome weblog!
Some things in here I have not thought about before. Thanks for making such a cool post which is really very well written will be referring a lot of friends about this. Keep bogging.
I seriously love your website.. Pleasant colors & theme. Did you create this web site yourself? Please reply back as I’m looking to create my very own blog and would love to know where you got this from or exactly what the theme is named. Many thanks.
Way cool! Some very valid points! I appreciate you penning this article and the rest of the website is also really good.
I really love your website.. Pleasant colors & theme. Did you develop this web site yourself? Please reply back as I’m trying to create my very own site and want to find out where you got this from or just what the theme is called. Appreciate it!
I’m really inspired together with your writing abilities and also with the structure on your weblog.
Is this a paid theme or did you customize it your self?
Either way stay up the excellent high quality writing, it is rare to see a great blog like this one
these days. Madgicx!
O BPI é o banco central dos países da PT que utilizam o euro. O nosso principal objetivo é a manutenção da estabilidade de preços. Para o efeito
bpi net empresas
I’m impressed, I have to admit. Seldom do I come across a blog that’s equally educative and amusing, and without a doubt, you’ve hit the nail on the head. The problem is an issue that too few people are speaking intelligently about. I am very happy that I came across this in my search for something relating to this.
Right here is the right site for everyone who hopes to find out about this topic. You realize so much its almost hard to argue with you (not that I actually will need to…HaHa). You definitely put a fresh spin on a topic that has been discussed for years. Great stuff, just excellent.
Ha ha… I was just surfing around and took a glance at these remarks. I can’t believe there’s still this much interest. Thanks for writing about this.
Bizarre this publish is totaly unrelated to what I was searching google for, but it was indexed at the first page. I guess your doing something right if Google likes you enough to position you at the first page of a non comparable search.
This article proof that there are writers who really care about the quality of content they share. Thank you for being this kind of writer.
There’s certainly a lot to learn about this topic. I love all the points you’ve made.
Saved as a favorite, I like your site!
Pretty! This was a really wonderful post. Thanks for providing these details.
You seem to be very professional in the way you write,
Judging by the way you write, you seem like a professional writer…’;~
Can I just say what a aid to find somebody who truly knows what theyre speaking about on the internet. You positively know the right way to bring an issue to light and make it important. More people have to read this and understand this facet of the story. I cant believe youre not more standard because you undoubtedly have the gift.
Great post! We are linking to this particularly great article on our website. Keep up the good writing.
Everything is very open with a really clear description of the issues. It was truly informative. Your website is very useful. Thank you for sharing!
of course above ground pools are easier to maintain and to clean*
Have you already setup a fan page on Facebook ?~’-”;
Almost everyone has missed this key idea. these writing are supporting me in discovering some required pieces of information. I hope for an additional post around these topics soon!
glad to be one of the visitors on this amazing internet site : D.
Im no pro, but I suppose you just crafted a very good point point. You obviously know what youre talking about, and I can truly get behind that. Thanks for staying so upfront and so straightforward.
Hi there everyone, basically showing up to point out that the article is quite interesting, whilst there happen to be some fairly odd feedback.
I could not refrain from commenting. Exceptionally well written!
Everything is very open with a very clear explanation of the challenges. It was truly informative. Your website is very useful. Thank you for sharing!
Everything is very open with a really clear description of the issues. It was really informative. Your website is very helpful. Thank you for sharing!
Greetings, I think your site could be having browser compatibility issues. Whenever I look at your web site in Safari, it looks fine however, when opening in IE, it has some overlapping issues. I merely wanted to provide you with a quick heads up! Aside from that, fantastic website!
I love it whenever people get together and share opinions. Great blog, continue the good work!
Excellent blog you have here.. It’s hard to find quality writing like yours nowadays. I honestly appreciate individuals like you! Take care!!
I found your blog web site on google and verify just a few of your early posts. Continue to maintain up the superb operate. I just further up your RSS feed to my MSN Information Reader. In search of ahead to studying more from you later on!? I am often to running a blog and i actually appreciate your content. The article has actually peaks my interest. I’m going to bookmark your website and keep checking for brand spanking new information.
I believe this really takes me back, such as your blog design too. Is it DPW? ok, good job!
An impressive share, I simply with all this onto a colleague who was simply performing a small analysis on this. And then he the truth is bought me breakfast because I ran across it for him.. smile. So allow me to reword that: Thnx for that treat! But yeah Thnkx for spending plenty of time to discuss this, I believe strongly about it and enjoy reading much more about this topic. If possible, as you grow expertise, would you mind updating your website with an increase of details? It is extremely ideal for me. Huge thumb up in this writing!
Hal Needham was also concerned in setting several land pace information and helped develop the Budweiser Rocket that broke many data.
Hi there! I could have sworn I’ve visited this web site before but after going through some of the posts I realized it’s new to me. Anyhow, I’m certainly delighted I stumbled upon it and I’ll be bookmarking it and checking back frequently!
On 8 March, Saudi Arabia unexpectedly announced that it could improve manufacturing of crude oil and promote it at a low cost (of $6-eight a barrel) to customers in Asia, the US, and Europe, following the breakdown of negotiations as Russia resisted calls to chop production.
You need to take part in a contest for one of the greatest blogs on the net. I most certainly will highly recommend this site!
It is best to inform the DWP for those who start or go away a job – find out more about adjustments you need to report back to the DWP.
However just as you are about to pat your self on the back, something horrible happens: You journey over a crack within the sidewalk, and the large, antique mirror you’re carrying slips from your grasp.
An interesting discussion is worth comment. There’s no doubt that that you need to publish more on this topic, it might not be a taboo subject but typically folks don’t talk about such topics. To the next! Best wishes!
There a few intriguing points with time in this post but I don’t know if all of them center to heart. There exists some validity but I will take hold opinion until I take a look at it further. Excellent write-up , thanks and that we want a lot more! Added onto FeedBurner likewise
What are you indicating, man? I understand everyones got their own thoughts and opinions, but really? Listen, your website is neat. I like the effort you put into it, particularly with the vids and the pics. But, come on. Theres gotta be a better way to say this, a way that doesnt make it seem like everybody here is stupid!
I’m typically to blogging and i actually respect your content. The article has really peaks my interest. I am going to bookmark your site and maintain checking for brand spanking new information.
I totally agree, I’ve seen a very similar discussion on https://yo88game.net/ that really helped me see things from a different point of view. It’s definitely worth exploring.
Contact Erotic Sensual Bodyrub Erotic Massage In Boston 오피커뮤니티
I completely agree with you. There’s a post on hitclub that dives into this issue in great detail, and it offers a lot of useful information to support your view.
I completely agree with this viewpoint, it’s very well thought out. I recently read an article that explores similar ideas on https://bossfun.zone, and I think it adds more depth to the discussion.
Youngsters’s Hospital Colorado has denounced Dr.
An outstanding share! I’ve just forwarded this onto a friend who had been doing a little homework on this. And he in fact bought me dinner because I discovered it for him… lol. So allow me to reword this…. Thanks for the meal!! But yeah, thanx for spending some time to discuss this issue here on your internet site.
Buy and sell Bitcoin, Ethereum, tangem wallet and other cryptocurrencies Peer-to-Peer on NoOnes. Secure, fast, and user-friendly transactions on a trusted platform.
Excellent article. I’m experiencing some of these issues as well..
Stanley John Raymond Dodd.
O BPI é o banco central dos países da PT que utilizam o euro. O nosso principal objetivo é a manutenção da estabilidade de preços. Para o efeito
bpi net empresas
Howdy! Digging the vibe—it’s fabulous. In fact, the details brings a fabulous touch to the overall vibe. Great effort!
I am lucky that I observed this site , precisely the right info that I was searching for! .
I have been examinating away some of your tales and it’s fairly very good things. I will surely bookmark your blog.
This is very interesting, You’re a very skilled blogger. I have joined your feed and look forward to seeking more of your fantastic post. Also, I have shared your website in my social networks!
Having read this I thought it was very enlightening. I appreciate you finding the time and energy to put this content together. I once again find myself spending a lot of time both reading and leaving comments. But so what, it was still worth it!
After clicking the “Examine Vehicles” hyperlink on the home page, users can choose up to 4 totally different vehicles for comparison.
When I originally left a comment I appear to have clicked the -Notify me when new comments are added- checkbox and now each time a comment is added I recieve 4 emails with the same comment. Is there a way you are able to remove me from that service? Thanks.
Thanks so much for another post. I be able to get that kind of information information. friend, and exactly.
An impressive share! I’ve just forwarded this onto a colleague who had been conducting a little research on this. And he in fact ordered me breakfast because I discovered it for him… lol. So allow me to reword this…. Thanks for the meal!! But yeah, thanks for spending time to talk about this issue here on your blog.
hey you should get social media plugins for your posts. I was looking for the ‘like’ button but couldn’t find it.
I quite like reading through a post that can make men and women think. Also, thank you for permitting me to comment.
O BPI é o banco central dos países da PT que utilizam o euro. O nosso principal objetivo é a manutenção da estabilidade de preços. Para o efeito
bpi net empresas
I couldn’t refrain from commenting. Perfectly written!
Very good information. Lucky me I recently found your website by accident (stumbleupon). I have saved as a favorite for later!
Can I simply say what a comfort to uncover someone who really knows what they’re discussing on the web. You definitely understand how to bring a problem to light and make it important. More and more people have to look at this and understand this side of your story. I can’t believe you are not more popular since you definitely possess the gift.
Each flight squadron has its personal particular person ready room, and it is not uncommon for the squadron’s “Maintenance Management” workplace to be situated subsequent to or near the prepared room.
I absolutely love your blog and find most of your post’s to be exactly I’m looking for. can you offer guest writers to write content for you personally? I wouldn’t mind composing a post or elaborating on many of the subjects you write about here. Again, awesome weblog!
I know high quality work when I see it. Your content is of high quality and it’s apparent you hold yourself to a higher standard than most. Keep writing like this and I’ll be back.
Whereas assisted dwelling environments typically have restricted health care options, most are able to make sure that residents are taking the appropriate meds on schedule.
According to the usual, basic waste bins have a red lid, recycling bins have a yellow lid, green waste bins have a lime green lid, and all these bins have a dark inexperienced or black body.
Aw, this was an extremely good post. Finding the time and actual effort to produce a superb article… but what can I say… I procrastinate a whole lot and never manage to get nearly anything done.
Greetings! Very helpful advice in this particular post! It is the little changes that will make the biggest changes. Thanks a lot for sharing!
Pretty! This has been an incredibly wonderful post. Thanks for supplying this info.
I really love your blog.. Great colors & theme. Did you build this web site yourself? Please reply back as I’m hoping to create my own blog and want to know where you got this from or just what the theme is called. Kudos.
That is a great tip especially to those fresh to the blogosphere. Simple but very accurate information… Appreciate your sharing this one. A must read article!
Hi, I do think this is a great web site. I stumbledupon it 😉 I am going to revisit once again since I book marked it. Money and freedom is the best way to change, may you be rich and continue to guide other people.
I and also my friends were actually viewing the excellent secrets and techniques on your web blog and so before long I got a terrible feeling I had not expressed respect to the blog owner for those tips. Most of the people happened to be as a consequence thrilled to study all of them and have in effect in truth been taking pleasure in these things. Thanks for genuinely really helpful and also for having such useful subject matter millions of individuals are really wanting to discover. My honest apologies for not expressing appreciation to sooner.
Greetings! Very useful advice within this article! It’s the little changes that will make the largest changes. Many thanks for sharing!
I love it when folks come together and share opinions. Great site, stick with it.
May I just say what a comfort to uncover somebody that really knows what they are discussing over the internet. You certainly understand how to bring a problem to light and make it important. More people must read this and understand this side of your story. I can’t believe you are not more popular because you surely have the gift.
These tags are manufactured to be disposable, together with the disposable shopper goods on which they are positioned.
Can I just say what a relief to discover an individual who actually knows what they’re discussing on the internet. You definitely realize how to bring an issue to light and make it important. More and more people ought to look at this and understand this side of the story. I was surprised that you aren’t more popular because you most certainly have the gift.
Being connected to the sign of Pisces, the fertile water sign where Venus exalts, Turquoise gives an limitless ebb and move of creative intuition that will get deeper like the ocean as one dives into it.
Very good post! We are linking to this great post on our site. Keep up the great writing.
I blog often and I genuinely appreciate your information. The article has really peaked my interest. I’m going to bookmark your site and keep checking for new information about once per week. I opted in for your Feed as well.
I’m extremely inspired with your writing abilities as neatly as with the structure on your blog.
Is this a paid theme or did you customize it yourself? Anyway
keep up the nice high quality writing, it is uncommon to look a great blog like
this one today. Instagram Auto follow!
You should take part in a contest for one of the best websites online. I most certainly will highly recommend this website!
This is such a solid point! I’ve seen similar ideas discussed on https://hdbet.deal, and they align perfectly with what you’re saying here. It’s great to see others agree.
Can I simply just say what a relief to find a person that truly knows what they’re talking about over the internet. You actually realize how to bring an issue to light and make it important. A lot more people really need to check this out and understand this side of your story. I was surprised you aren’t more popular given that you certainly have the gift.
Greetings! Very useful advice within this post! It is the little changes that make the most important changes. Thanks for sharing!
Just wanna input on few general things, The website design is perfect, the articles is very great : D.
An intriguing discussion is definitely worth comment. There’s no doubt that that you should publish more on this topic, it might not be a taboo subject but usually folks don’t talk about these topics. To the next! All the best.
Your style is very unique compared to other folks I have read stuff from. I appreciate you for posting when you’ve got the opportunity, Guess I’ll just bookmark this page.
I needed to thank you for this wonderful read!! I absolutely loved every little bit of it. I have you bookmarked to look at new stuff you post…
Having read this I thought it was very informative. I appreciate you spending some time and energy to put this content together. I once again find myself spending a significant amount of time both reading and leaving comments. But so what, it was still worthwhile!
I was examining some of your content on this website and I believe this web site is real informative! Keep posting.
I quite like reading through an article that can make people think. Also, thanks for allowing me to comment.
I completely agree with your view. I’ve come across several discussions on V8club that share a similar perspective and offer some interesting analysis on the topic.
Excellent web site you have here.. It’s hard to find high quality writing like yours nowadays. I seriously appreciate individuals like you! Take care!!
Everything is very open with a precise clarification of the issues. It was definitely informative. Your site is very useful. Thank you for sharing!
You got a very fantastic website, Glad I discovered it through yahoo.
Good job!
On July 3, Lebanon County turned the ultimate county to enter the inexperienced part.
This site really has all the information I wanted concerning this subject and didn’t know who to ask.
Ideally, builders figure out the options prospects will need before the customers notice they want them.
An impressive share! I have just forwarded this onto a friend who had been doing a little homework on this. And he actually ordered me lunch because I found it for him… lol. So let me reword this…. Thank YOU for the meal!! But yeah, thanks for spending some time to talk about this matter here on your website.
I’ll be back for more.
This excellent website really has all the information I wanted concerning this subject and didn’t know who to ask.
Such a good read!
If only a small piece is lacking, you may be able to fill in the outlet with veneer edging tape, offered at many home centers and lumberyards.
Everything is very open with a very clear description of the challenges. It was really informative. Your site is extremely helpful. Thank you for sharing.
It is important to remember that healthy debates and constructive feedback can contribute to personal growth and development.
Although little industry is located in the city proper, Lahore serves as a distribution center for the heavily industrialized surrounding area.
You are so awesome! I don’t suppose I’ve truly read a single thing like that before. So good to find another person with original thoughts on this issue. Seriously.. thank you for starting this up. This web site is something that’s needed on the internet, someone with a bit of originality.
Aw, this was an incredibly good post. Taking the time and actual effort to make a top notch article… but what can I say… I procrastinate a whole lot and never manage to get nearly anything done.
I’m in full agreement here. I recently read a similar post on https://ho88.news/, and I think it provides even more context to back up your argument.
Spot on with this write-up, I really believe this site needs a lot more attention. I’ll probably be returning to read through more, thanks for the advice!
Easy to digest.
Pretty! This was a really wonderful post. Thanks for providing these details.
Great article. I am experiencing some of these issues as well..
This is super neat.
wedding venue beside the beach is i think the best and looks very romantic’
I was able to find good advice from your blog articles.
This clarified everything.
I think you’re right on the mark here. I came across a similar post on Tin88, and it added some great insights that complement your point.
Aw, this was an extremely nice post. Finding the time and actual effort to generate a superb article… but what can I say… I hesitate a lot and never manage to get nearly anything done.
Lankier men with longer limbs relative to their torso lift less weight than stockier men. Lank and stocky man have the same distance lever between tendon and joint where your muscle s force generates your torque, but lankier men have a longer limb where the external weight s force is generating its
i use google when i want to do some spanish translation, it is good for general spanish translation,,
dry cleaners come in handy specially if you need your precious clothes to get cleaned very fast,
Enjoyed examining this, very good stuff, thankyou .
LMFAO is a good band, i like those hilarious MTV they make on youtube.
That one HOT chick that gives you the time day…:)|Kwanboi_Z|
Way cool! Some extremely valid points! I appreciate you penning this article and the rest of the website is also very good.
I was just looking for this information for some time. After six hours of continuous Googleing, finally I got it in your website. I wonder what’s the lack of Google strategy that do not rank this type of informative sites in top of the list. Generally the top sites are full of garbage.
great issues altogether, you simply gained a new reader. What could you recommend about your post that you made some days in the past? Any positive?
I think other site proprietors should take this site as an model, very clean and magnificent user genial style and design, let alone the content. You’re an expert in this topic!
Having read this I believed it was extremely enlightening. I appreciate you spending some time and effort to put this short article together. I once again find myself personally spending a significant amount of time both reading and leaving comments. But so what, it was still worth it.
Excellent article. I absolutely appreciate this site. Thanks!
This is a topic that is close to my heart… Cheers! Exactly where can I find the contact details for questions?
This is the perfect blog for anybody who would like to find out about this topic. You know so much its almost tough to argue with you (not that I actually would want to…HaHa). You certainly put a new spin on a topic that has been written about for many years. Excellent stuff, just great.
Keep up the great piece of work, I read few content on this website and I think that your blog is real interesting and contains lots of wonderful info.
Wow! what an idea ! What a concept ! Lovely . Incredible.
enoyed the read, well i didnt cause i didnt agree but well explained.
This page really has all the information and facts I wanted concerning this subject and didn’t know who to ask.
This blog was… how do you say it? Relevant!! Finally I’ve found something that helped me. Many thanks!
It’s hard to come by knowledgeable people for this subject, but you sound like you know what you’re talking about! Thanks
You need to take part in a contest for one of the most useful websites online. I am going to highly recommend this site!
The next time I read a blog, Hopefully it does not fail me just as much as this one. After all, I know it was my choice to read through, however I really thought you would probably have something interesting to say. All I hear is a bunch of crying about something you could fix if you weren’t too busy looking for attention.
An interesting discussion is definitely worth comment. I do believe that you should write more about this issue, it might not be a taboo matter but typically people do not speak about such subjects. To the next! Kind regards!
Your style is very unique in comparison to other people I’ve read stuff from. Thank you for posting when you’ve got the opportunity, Guess I will just bookmark this site.
Oh my goodness! Incredible article dude! Thank you so much, However I am experiencing problems with your RSS. I don’t understand why I am unable to join it. Is there anybody getting the same RSS problems? Anybody who knows the answer will you kindly respond? Thanx.
I really like it when folks get together and share views. Great blog, stick with it!
May I just say what a comfort to discover someone that genuinely understands what they’re talking about over the internet. You certainly know how to bring a problem to light and make it important. A lot more people ought to look at this and understand this side of your story. It’s surprising you’re not more popular since you most certainly have the gift.
Aw, this was an incredibly nice post. Finding the time and actual effort to generate a top notch article… but what can I say… I procrastinate a whole lot and never manage to get nearly anything done.
You’re so awesome! I don’t think I’ve truly read anything like this before. So wonderful to find somebody with some original thoughts on this subject. Seriously.. thank you for starting this up. This web site is one thing that’s needed on the internet, someone with some originality.
I needed to thank you for this very good read!! I certainly enjoyed every little bit of it. I have got you book marked to look at new stuff you post…
Aw, this was a really good post. Spending some time and actual effort to create a really good article… but what can I say… I put things off a whole lot and don’t seem to get nearly anything done.
Good site you have got here.. It’s difficult to find quality writing like yours these days. I honestly appreciate people like you! Take care!!
Excellent post. I’m going through some of these issues as well..
I enjoy looking through an article that can make people think. Also, thanks for allowing me to comment.
Your style is so unique compared to other folks I have read stuff from. Many thanks for posting when you have the opportunity, Guess I’ll just bookmark this page.
After looking at a few of the blog posts on your web page, I truly like your technique of blogging. I saved it to my bookmark webpage list and will be checking back soon. Take a look at my web site too and let me know your opinion.
Hi, I do think this is a great website. I stumbledupon it 😉 I will revisit yet again since i have book marked it. Money and freedom is the greatest way to change, may you be rich and continue to help other people.
Way cool! Some very valid points! I appreciate you writing this write-up plus the rest of the website is also really good.
I must thank you for the efforts you’ve put in penning this site. I’m hoping to view the same high-grade blog posts by you in the future as well. In truth, your creative writing abilities has motivated me to get my very own blog now 😉
Very good article. I’m dealing with a few of these issues as well..
Right here is the right web site for anybody who hopes to understand this topic. You understand so much its almost hard to argue with you (not that I actually will need to…HaHa). You certainly put a fresh spin on a subject which has been written about for decades. Great stuff, just wonderful.
I’m amazed, I have to admit. Rarely do I come across a blog that’s both educative and entertaining, and let me tell you, you’ve hit the nail on the head. The problem is something which too few men and women are speaking intelligently about. I’m very happy I stumbled across this in my hunt for something regarding this.
When I originally commented I seem to have clicked the -Notify me when new comments are added- checkbox and now whenever a comment is added I recieve four emails with the exact same comment. Perhaps there is an easy method you are able to remove me from that service? Kudos.
You’ve hit the nail on the head! I recently read an article on One88 that addressed this exact issue, and it really helped me gain a broader perspective on the matter.
Oh my goodness! Amazing article dude! Thank you, However I am experiencing difficulties with your RSS. I don’t understand why I cannot subscribe to it. Is there anybody else getting similar RSS issues? Anyone that knows the answer will you kindly respond? Thanx.
Can I just say what a relief to uncover a person that truly knows what they’re talking about online. You certainly understand how to bring a problem to light and make it important. A lot more people have to check this out and understand this side of your story. I was surprised that you are not more popular since you definitely have the gift.
Great blog you have here.. It’s hard to find high-quality writing like yours these days. I honestly appreciate people like you! Take care!!
You ought to take part in a contest for one of the highest quality sites on the web. I will highly recommend this web site!
I seriously love your site.. Very nice colors & theme. Did you build this amazing site yourself? Please reply back as I’m hoping to create my own website and want to know where you got this from or exactly what the theme is called. Many thanks.
There is definately a great deal to learn about this issue. I love all the points you’ve made.
https://www.cornbreadhemp.com/products/full-spectrum-cbd-gummies have joking helped me superintend everyday stress without making me note in sight of it. I pop unified in the evening after feat, and within 30 minutes, I’m scheme more relaxed. It’s like a minuscule nutty reset. They hint like conventional sweetmeats but come with all the calming benefits of CBD. I was a morsel unsure at opening, but once in a while I keep a quarrel in my kitchenette at all times. If you’re dealing with desire, importance, or valid necessity to unwind, these are a gross lifesaver. Just square foolproof you’re getting them from a trusted identify!
An outstanding share! I’ve just forwarded this onto a co-worker who has been conducting a little research on this. And he in fact ordered me dinner simply because I discovered it for him… lol. So allow me to reword this…. Thanks for the meal!! But yeah, thanks for spending some time to discuss this topic here on your site.
Hi, There’s no doubt that your site could be having browser compatibility problems. Whenever I look at your blog in Safari, it looks fine however, when opening in Internet Explorer, it’s got some overlapping issues. I merely wanted to provide you with a quick heads up! Other than that, great site.
I fully agree with this. There’s a similar post on https://fabet8.top/ that explores this topic, and it provides further insights that align with your argument.
After exploring a handful of the blog articles on your web page, I seriously appreciate your way of blogging. I saved it to my bookmark site list and will be checking back in the near future. Please check out my web site as well and tell me your opinion.
Hi there! This article couldn’t be written much better! Going through this article reminds me of my previous roommate! He continually kept talking about this. I’ll forward this article to him. Fairly certain he’ll have a very good read. I appreciate you for sharing!
Your point is very valid, and it mirrors what I read on https://five88com.biz/. They also explain this issue with a lot of context and insight.
I really love your blog.. Great colors & theme. Did you create this site yourself? Please reply back as I’m attempting to create my very own blog and would like to find out where you got this from or exactly what the theme is called. Many thanks!
Greetings! Very helpful advice within this post! It’s the little changes that will make the most important changes. Thanks for sharing!
I blog frequently and I seriously thank you for your information. This great article has really peaked my interest. I’m going to bookmark your website and keep checking for new information about once per week. I subscribed to your Feed as well.
I’m amazed, I have to admit. Seldom do I come across a blog that’s both educative and engaging, and without a doubt, you’ve hit the nail on the head. The problem is something not enough folks are speaking intelligently about. I’m very happy I came across this during my search for something concerning this.
You need to be a part of a contest for one of the finest blogs online. I most certainly will recommend this site!
I could not refrain from commenting. Perfectly written!
Greetings! Enthused by this piece—it’s great. In fact, this idea brings a exceptional touch to the overall vibe. Looking forward to more!
An impressive share! I’ve just forwarded this onto a friend who was doing a little homework on this. And he in fact bought me dinner due to the fact that I discovered it for him… lol. So allow me to reword this…. Thank YOU for the meal!! But yeah, thanks for spending time to discuss this matter here on your web page.
I absolutely love your website.. Very nice colors & theme. Did you build this website yourself? Please reply back as I’m planning to create my own site and want to learn where you got this from or just what the theme is called. Many thanks!
I blog quite often and I really appreciate your information. The article has truly peaked my interest. I’m going to bookmark your website and keep checking for new details about once a week. I opted in for your Feed too.
I couldn’t agree more with your point. I read a similar analysis on https://tai789club.buzz/ that really helped me understand the nuances of this issue.
https://www.cornbreadhemp.com/products/blood-orange-thc-gummies-10mg oblige scout’s honour helped me run unexciting stress without making me sensation escape of it. I drop in unified in the evening after detail, and within 30 minutes, I’m scheme more relaxed. It’s like a dwarf nutty reset. They taste like regular bon-bons but aggregate b regain with all the calming benefits of CBD. I was a bit unsure at basic, but in these times I keep a jerk in my cookhouse at all times. If you’re dealing with angst, worry, or valid need to unwind, these are a full lifesaver. Condign generate firm you’re getting them from a trusted sort!
I’m really impressed along with your writing talents as well as with the layout for your
blog. Is that this a paid theme or did you modify it yourself?
Anyway keep up the nice high quality writing, it’s uncommon to peer a
nice weblog like this one nowadays. LinkedIN Scraping!
Greetings! Very helpful advice in this particular article! It is the little changes that will make the most significant changes. Thanks a lot for sharing!
Next time I read a blog, Hopefully it doesn’t disappoint me just as much as this one. I mean, Yes, it was my choice to read through, however I truly thought you would probably have something helpful to say. All I hear is a bunch of moaning about something that you could possibly fix if you weren’t too busy looking for attention.
This excellent website really has all of the information I wanted about this subject and didn’t know who to ask.
Great post! It’s always interesting to explore new trends in various industries. By the way, I run a site about online lotteries. If you’re interested in playing, be sure to check out https://apartmentsapart.com/ for exciting lottery opportunities.
You are so awesome! I do not believe I have read through a single thing like this before. So great to discover another person with a few unique thoughts on this subject matter. Seriously.. many thanks for starting this up. This site is one thing that is required on the internet, someone with a little originality.
An interesting discussion is definitely worth comment. I do believe that you need to write more on this subject, it may not be a taboo matter but typically people do not discuss these issues. To the next! Kind regards.
Excellent post. I certainly love this site. Thanks!
Saved as a favorite, I really like your web site!
After I originally left a comment I appear to have clicked the -Notify me when new comments are added- checkbox and from now on whenever a comment is added I receive four emails with the exact same comment. There has to be a means you can remove me from that service? Appreciate it.
Great site you have got here.. It’s difficult to find high quality writing like yours nowadays. I honestly appreciate people like you! Take care!!
Hello! I just wish to give you a big thumbs up for the excellent information you have got here on this post. I will be coming back to your website for more soon.
This website really has all of the info I needed about this subject and didn’t know who to ask.
This is the right webpage for everyone who wishes to understand this topic. You understand a whole lot its almost hard to argue with you (not that I really will need to…HaHa). You definitely put a fresh spin on a topic which has been written about for years. Great stuff, just excellent.
Wonderful article! We will be linking to this great content on our site. Keep up the good writing.
Thanks for your post. I like your work you can also check mine anchor text
You’re so cool! I don’t think I have read through something like that before. So great to discover someone with some unique thoughts on this subject matter. Really.. thank you for starting this up. This web site is something that is required on the internet, someone with some originality.
You made some good points there. I checked on the net to find out more about the issue and found most people will go along with your views on this site.
I used to be able to find good info from your blog posts.
Excellent article! We are linking to this particularly great post on our site. Keep up the great writing.
After I initially commented I appear to have clicked on the -Notify me when new comments are added- checkbox and now every time a comment is added I recieve 4 emails with the same comment. Is there an easy method you are able to remove me from that service? Thank you.
I’m excited to discover this great site. I need to to thank you for your time due to this wonderful read!! I definitely really liked every little bit of it and i also have you saved as a favorite to see new things on your web site.
I’m impressed, I have to admit. Seldom do I encounter a blog that’s both educative and amusing, and let me tell you, you have hit the nail on the head. The problem is something that not enough people are speaking intelligently about. Now i’m very happy that I came across this in my search for something regarding this.
Good post. I learn something new and challenging on websites I stumbleupon everyday. It will always be interesting to read content from other writers and use something from their web sites.
I blog quite often and I seriously appreciate your information. This great article has truly peaked my interest. I am going to bookmark your blog and keep checking for new details about once per week. I subscribed to your RSS feed as well.
Good write-up. I definitely love this site. Continue the good work!
I blog frequently and I seriously appreciate your information. The article has really peaked my interest. I’m going to take a note of your website and keep checking for new information about once per week. I opted in for your Feed as well.
I was very happy to uncover this site. I want to to thank you for your time just for this fantastic read!! I definitely appreciated every bit of it and i also have you book-marked to check out new stuff on your site.
I could not resist commenting. Perfectly written.
I agree fully with your comment. There’s a detailed article on https://xibett.com/ that covers the same ground, and it provides additional context that supports your argument.
Your style is very unique compared to other people I’ve read stuff from. Thank you for posting when you’ve got the opportunity, Guess I’ll just bookmark this page.
I love it when individuals get together and share opinions. Great site, stick with it.
The next time I read a blog, I hope that it doesn’t fail me just as much as this particular one. After all, I know it was my choice to read through, but I really thought you would probably have something useful to talk about. All I hear is a bunch of moaning about something that you could possibly fix if you were not too busy seeking attention.
I completely agree with this perspective. There’s an in-depth post on Leo88 that elaborates on the same topic, offering useful points to support your view.
Excellent article! We will be linking to this particularly great post on our site. Keep up the great writing.
I wanted to thank you for this fantastic read!! I definitely loved every bit of it. I have got you saved as a favorite to look at new things you post…
I’m in full agreement with this. I came across a similar discussion on https://zowin1.vip/, and it gave me a clearer understanding of the topic you’re discussing here.
Very good article. I definitely love this website. Keep writing!
Your style is unique in comparison to other folks I’ve read stuff from. I appreciate you for posting when you’ve got the opportunity, Guess I will just book mark this blog.
It’s difficult to find experienced people about this topic, but you seem like you know what you’re talking about! Thanks
An outstanding share! I’ve just forwarded this onto a friend who was conducting a little homework on this. And he actually bought me lunch because I stumbled upon it for him… lol. So let me reword this…. Thanks for the meal!! But yeah, thanks for spending time to talk about this subject here on your blog.
When I originally commented I seem to have clicked on the -Notify me when new comments are added- checkbox and from now on each time a comment is added I receive 4 emails with the same comment. Perhaps there is a way you can remove me from that service? Many thanks.
Hi there! This article could not be written much better! Looking through this article reminds me of my previous roommate! He continually kept talking about this. I most certainly will forward this article to him. Pretty sure he’ll have a good read. Thank you for sharing!
Absolutely, I agree completely. I recently read a post on wi88 that explores this topic in depth, and I think it adds a lot of value to the conversation.
I’m not sure exactly how I found this blog because I had been researching information on Real Estate in Winter Park, FL, but anyway, I have thoroughly enjoyed reading it, keep it up!
An outstanding share! I’ve just forwarded this onto a co-worker who had been conducting a little research on this. And he in fact ordered me breakfast simply because I found it for him… lol. So let me reword this…. Thanks for the meal!! But yeah, thanx for spending time to discuss this matter here on your site.
You made some good points there. I checked on the web to learn more about the issue and found most individuals will go along with your views on this web site.
This blog was… how do you say it? Relevant!! Finally I have found something that helped me. Cheers!
Hello, I think your website could be having web browser compatibility issues. When I take a look at your web site in Safari, it looks fine however, if opening in IE, it’s got some overlapping issues. I simply wanted to give you a quick heads up! Apart from that, wonderful site.
Right here is the perfect webpage for anyone who wants to find out about this topic. You understand so much its almost tough to argue with you (not that I personally will need to…HaHa). You definitely put a new spin on a subject that’s been discussed for decades. Wonderful stuff, just great.
I couldn’t agree more with your point. I read a similar analysis on http://taisunwin.deals/ that really helped me understand the nuances of this issue.
I wanted to thank you for this very good read!! I certainly enjoyed every little bit of it. I have got you bookmarked to check out new things you post…
Hello everyone!
I came across a 110 useful website that I think you should check out.
This platform is packed with a lot of useful information that you might find valuable.
It has everything you could possibly need, so be sure to give it a visit!
https://theboringmagazine.com/a-successful-casino-player-the-psychology-of-a-winner/
Hello !!
I came across a 110 very cool page that I think you should explore.
This resource is packed with a lot of useful information that you might find interesting.
It has everything you could possibly need, so be sure to give it a visit!
https://www.filter.hu/cikkek/3167/a-legujabb-kutyuk-amik-szetcsapjak-a-mindennapokat
There is certainly a great deal to know about this topic. I like all of the points you’ve made.
https://deepbluedirectory.com/Business/Investing/Recreation/Arts/Dance/
This is gold
Excellent post! We will be linking to this particularly great content on our website. Keep up the great writing.
You’re so awesome! I don’t suppose I’ve truly read a single thing like this before. So great to find another person with some original thoughts on this issue. Seriously.. many thanks for starting this up. This web site is one thing that is required on the internet, someone with some originality.
Pretty! This was an extremely wonderful article. Thanks for supplying this info.
https://highdabookmarking.xyz/page/business-services/ezoutdoor-premier-adventure-gear-for-dubai-s-desert-and-mountain-explorers
This is a topic that is near to my heart… Take care! Exactly where are your contact details though?
This is gold
Everyone loves it when folks come together and share views. Great blog, keep it up.
能ある鷹は爪を隠す
The next time I read a blog, Hopefully it does not disappoint me just as much as this one. After all, Yes, it was my choice to read through, nonetheless I actually believed you would have something interesting to say. All I hear is a bunch of whining about something you can fix if you were not too busy seeking attention.
In diesem Artikel stellen wir eine Auswahl von TikTok Downloader
ohne Wasserzeichen vor, die das Herunterladen in klarer und unmarkierter Form ermöglichen.
I wanted to thank you for this very good read!! I certainly enjoyed every bit of it. I have you saved as a favorite to check out new stuff you post…
Greetings! Very useful advice within this post! It is the little changes which will make the greatest changes. Thanks for sharing!
I must thank you for the efforts you’ve put in writing this blog. I’m hoping to see the same high-grade content from you in the future as well. In fact, your creative writing abilities has encouraged me to get my very own site now 😉
Good info. Lucky me I found your website by chance (stumbleupon). I have book marked it for later.
Greetings! Very helpful advice within this post! It’s the little changes that make the biggest changes. Thanks for sharing!
Everything is very open with a clear explanation of the challenges. It was truly informative. Your site is very helpful. Many thanks for sharing!
Very good article. I definitely appreciate this site. Stick with it!
I’m amazed, I must say. Seldom do I encounter a blog that’s equally educative and entertaining, and without a doubt, you have hit the nail on the head. The issue is something too few people are speaking intelligently about. I’m very happy I came across this in my search for something relating to this.
Having read this I believed it was really informative. I appreciate you taking the time and energy to put this short article together. I once again find myself spending way too much time both reading and commenting. But so what, it was still worth it.
After checking out a number of the articles on your web page, I seriously appreciate your way of writing a blog. I book-marked it to my bookmark website list and will be checking back soon. Please visit my website too and let me know what you think.
Excellent article. I absolutely appreciate this website. Keep writing!
Spot on with this write-up, I absolutely feel this site needs a lot more attention. I’ll probably be back again to read through more, thanks for the advice!
Valuable info. Lucky me I found your web site by chance, and I’m shocked why this accident didn’t happened earlier! I bookmarked it.
Hello! I simply wish to offer you a big thumbs up for your excellent information you have got right here on this post. I will be coming back to your blog for more soon.
Thanks for your submission. Another factor is that just being a photographer requires not only issues in capturing award-winning photographs but in addition hardships in getting the best photographic camera suited to your needs and most especially challenges in maintaining the standard of your camera. This is very correct and obvious for those photography lovers that are into capturing the particular nature’s eye-catching scenes : the mountains, the particular forests, the particular wild or maybe the seas. Going to these daring places undoubtedly requires a photographic camera that can surpass the wild’s nasty areas.
I started entrancing https://www.cornbreadhemp.com/products/blood-orange-thc-gummies-10mg a not many months ago and forthrightly, they’ve made a huge difference. I in the main take everyone after dinner to boost me wheezles peripheral exhausted and doze better. They bite countless —like present bon-bons — and don’t remain me feeling numbed the next day. It’s honest a worthwhile, age vibe that helps take the uptight off after a stressful day. Wasn’t established they’d charge at earliest, but at the moment I’m all in. Totally vouch for if you have need of something typical to ease you rest without any weird side effects.
You need to take part in a contest for one of the highest quality blogs on the net. I’m going to highly recommend this site!
I need to to thank you for this great read!! I certainly loved every little bit of it. I have got you bookmarked to look at new things you post…
Excellent post. I am facing many of these issues as well..
A motivating discussion is definitely worth comment. I do think that you need to publish more on this topic, it might not be a taboo subject but generally folks don’t talk about such subjects. To the next! Kind regards!
Spot on with this write-up, I actually think this site needs much more attention. I’ll probably be returning to see more, thanks for the information.
At pre-eminent, I was skeptical give https://joyorganics.com/products/organic-cbd-gummies , but in the present circumstances I guard them in my nightstand. They’ve be proper part of my evening hackneyed—single gummy, a cup of tea, and I’m tolerable to go. I don’t fondle strident or freakish, nothing but serene and genial to nonsense down. The flavor’s in actuality in actuality well-behaved too, which surprised me. No peculiar aftertaste like some others I’ve tried. If your leader runs a mile a pint-sized at cimmerian dark or you’re upstanding vexing to relax after work, these are undoubtedly advantage checking out.
That is a good tip particularly to those new to the blogosphere. Short but very accurate information… Appreciate your sharing this one. A must read article!
Pretty! This has been an incredibly wonderful post. Many thanks for supplying this info.
You’re so interesting! I do not believe I have read a single thing like this before. So nice to discover somebody with unique thoughts on this subject. Really.. thanks for starting this up. This website is one thing that is required on the internet, someone with some originality.
This website was… how do you say it? Relevant!! Finally I have found something which helped me. Thank you!
Great blog you’ve got here.. It’s difficult to find quality writing like yours nowadays. I truly appreciate individuals like you! Take care!!
I started taking CBD gummies a handful months ago and morally, they’ve made a immense difference. I almost always liberate one after dinner to mitigate me deject out and doze better. They style renowned —like solid confectionery — and don’t leave me identification weak the next day. It’s honest a nice, sweet vibe that helps receive the margin dotty after a stressful day. Wasn’t inescapable they’d charge at earliest, but at the moment I’m all in. Wholly interesting if you need something typical to take you slacken up on without any grotesque side effects.
It’s difficult to find knowledgeable people for this subject, however, you sound like you know what you’re talking about! Thanks
Nice post. I learn something totally new and challenging on blogs I stumbleupon on a daily basis. It will always be interesting to read through content from other writers and practice something from other websites.
Nice post. I find out something much harder on distinct blogs everyday. It will always be stimulating to learn content using their company writers and practice a specific thing there. I’d choose to apply certain with the content on my own weblog regardless of whether you don’t mind. Natually I’ll supply you with a link on the internet weblog. Appreciate your sharing.
Spot on with this write-up, I really believe that this amazing site needs a lot more attention. I’ll probably be returning to read more, thanks for the advice!
Everyone loves it when folks get together and share views. Great site, continue the good work.
Bahis Siteleri 2025 listesiyle, 250 güvenilir bahis sitesinden deneme bonusu kazanın ve hemen kazanmaya başlayın
I completely agree with your thoughts on this, and I’ve encountered similar opinions on https://vk88s.net/. It’s great to see others exploring this topic with such depth.
This is a topic that is close to my heart… Thank you! Where are your contact details though?
This is a fantastic point! It’s something I’ve also read about on gen88, where they delve into similar ideas in great detail. I think it’s an important topic to explore.
Aw, this was an exceptionally nice post. Taking a few minutes and actual effort to make a top notch article… but what can I say… I put things off a whole lot and never manage to get nearly anything done.
I completely agree with your view. I’ve come across several discussions on 8live that share a similar perspective and offer some interesting analysis on the topic.
I was very happy to discover this site. I need to to thank you for ones time just for this wonderful read!! I definitely really liked every little bit of it and i also have you saved as a favorite to see new information on your website.
I was able to find good information from your blog articles.
Good post. I learn something totally new and challenging on websites I stumbleupon everyday. It will always be helpful to read content from other authors and practice a little something from their web sites.
You’ve made some decent points there. I looked on the internet for additional information about the issue and found most individuals will go along with your views on this website.
May I just say what a comfort to discover someone that actually understands what they’re discussing over the internet. You actually know how to bring an issue to light and make it important. More and more people have to look at this and understand this side of the story. I was surprised that you are not more popular because you certainly have the gift.
An impressive share! I have just forwarded this onto a colleague who has been doing a little research on this. And he in fact bought me lunch simply because I found it for him… lol. So let me reword this…. Thanks for the meal!! But yeah, thanx for spending time to talk about this subject here on your internet site.
I completely agree with your perspective here. I came across a very similar viewpoint on https://1gom2.com/, which provided additional context to deepen my understanding of the issue.
Very good info. Lucky me I ran across your blog by chance (stumbleupon). I have saved as a favorite for later!
I like reading through a post that will make people think. Also, many thanks for allowing me to comment.
Good blog you have got here.. It’s hard to find high quality writing like yours nowadays. I honestly appreciate people like you! Take care!!
Greetings! Very helpful advice within this article! It is the little changes that will make the largest changes. Thanks a lot for sharing!
I fully support this viewpoint, and I think it’s a perspective worth considering. I read a similar article on mayclub, and it reinforced my belief in this idea.
This is a great point! I remember reading an article on https://dafabet.us.com/ that touched on this exact issue, and it provided some really insightful information that supports your argument.
You ought to take part in a contest for one of the most useful blogs on the net. I’m going to recommend this website!
Your style is unique in comparison to other folks I have read stuff from. Many thanks for posting when you’ve got the opportunity, Guess I will just bookmark this site.
Hi there, I think your site may be having internet browser compatibility issues. Whenever I look at your blog in Safari, it looks fine however when opening in Internet Explorer, it’s got some overlapping issues. I just wanted to give you a quick heads up! Other than that, great blog!
Greetings! Very helpful advice in this particular article! It’s the little changes that make the greatest changes. Thanks for sharing!
An intriguing discussion is definitely worth comment. I think that you should write more about this topic, it might not be a taboo matter but generally people do not talk about such topics. To the next! Many thanks!
Your argument really resonates with me, and it’s one that I recently came across in a post on https://goal123b.us.com/. The insights shared there helped solidify my understanding of this topic.
This is a topic that’s close to my heart… Take care! Exactly where are your contact details though?
ibercaja empresas
Ibercaja ofrece financiación, planes de pensiones, ayudas y servicios para empresas de todos los tamaños y sectores. Descubre cómo
Ibercaja Empresas te acompaña en
bpi net empresas
Conheça a oferta BPI à medida das suas necessidades, quer seja PME, agricultor,
empreendedor ou exportador.
When I initially left a comment I seem to have clicked the -Notify me when new comments are added- checkbox and from now on whenever a comment is added I receive 4 emails with the exact same comment. Perhaps there is a means you can remove me from that service? Appreciate it.
Having read this I thought it was rather informative. I appreciate you taking the time and energy to put this short article together. I once again find myself personally spending a lot of time both reading and posting comments. But so what, it was still worthwhile!
Deneme Bonusu Veren Siteler – 2025 En İyiler
This is a great point! I saw something very similar in an article on Nhà cái soc88, and it made me reflect on the issue in a new way.
I fully agree with this. I recently read a post on Soc99 that explored the same issue, and the perspectives shared there were really eye-opening.
hello admin good job admin bla bla.. d3n3m3 b0n0s0 v4r4n s1t3l3r
ibercaja empresas
Ibercaja ofrece financiación, planes de pensiones, ayudas y servicios para empresas de todos los tamaños y sectores. Descubre cómo
Ibercaja Empresas te acompaña en tu proyecto empresarial
dut bon vor sort dutulca boneci vortin sortlir
Annual tune‑ups are available; we flush, reseal corners and adjust hangers so your system keeps working even after the roughest winter freeze–thaw cycles. Tacoma’s notoriously unpredictable rain makes high-capacity seamless gutters an absolute must for any homeowner who wants long‑term protection and peace of mind. Every installation comes with stainless steel micro‑mesh guards that laugh at fir needles, keeping maintenance low even during those blustery November storms.
I think you’ve made a solid argument, and it’s something I’ve also read about on https://tic88s.com/. They offer a comprehensive analysis of this subject too.
ibercaja empresas
Ibercaja ofrece financiación, planes de pensiones, ayudas y servicios para empresas de todos los tamaños y sectores. Descubre cómo
Ibercaja Empresas te acompaña en tu proyecto empresarial
Deneme Bonusu Veren Siteler 2025 – Güvenilir Bahis Siteleri
You are so interesting! I don’t think I’ve read through something like that before. So great to find somebody with unique thoughts on this topic. Seriously.. many thanks for starting this up. This website is one thing that is required on the internet, someone with some originality.
Absolutely agree with you! I’ve also seen similar points discussed on https://sin88n.pro, and it’s clear that the topic is receiving increasing attention and thoughtful analysis.
I really like it when individuals get together and share views. Great blog, keep it up.
Everything is very open with a really clear description of the issues. It was really informative. Your website is extremely helpful. Many thanks for sharing!
This blog was… how do you say it? Relevant!! Finally I’ve found something that helped me. Many thanks!
You have made some decent points there. I looked on the net to learn more about the issue and found most individuals will go along with your views on this website.
I would like to thank you for the efforts you have put in writing this website. I really hope to check out the same high-grade blog posts by you in the future as well. In fact, your creative writing abilities has inspired me to get my own website now 😉
Hello, I do think your website might be having internet browser compatibility issues. When I take a look at your web site in Safari, it looks fine however, if opening in I.E., it’s got some overlapping issues. I simply wanted to give you a quick heads up! Apart from that, great website.
I completely agree with this argument. I’ve also encountered similar viewpoints on hdbet, and the perspectives shared there are extremely valuable.
Pretty! This was a really wonderful post. Thanks for supplying this information.
Spot on with this write-up, I seriously feel this site needs much more attention. I’ll probably be returning to see more, thanks for the info.
This excellent website certainly has all the info I needed concerning this subject and didn’t know who to ask.
Deneme Bonusu kullanıcılarına ilk kayıtları veya ilk bahisleri için ekstra bir ödül sunarak denemelerini teşvik eder.
I blog frequently and I really thank you for your information. This article has truly peaked my interest. I am going to bookmark your website and keep checking for new information about once per week. I subscribed to your RSS feed as well.
Phần mềm này không hề tích hợp bất kì quảng cáo nào khi sử dụng.
Good post! We will be linking to this great content on our site. Keep up the great writing.
An intriguing discussion is definitely worth comment. There’s no doubt that that you ought to write more on this subject matter, it may not be a taboo subject but usually folks don’t talk about these topics. To the next! All the best!
Türkiye’de en çok deneme bonusu veren siteler aşağıdaki gibi sıralanmıştır seni öldüreceğiz mehdi sana başka uyarı yok adam ol
You are so interesting! I don’t believe I’ve read anything like this before. So nice to discover another person with unique thoughts on this subject. Really.. thanks for starting this up. This site is one thing that’s needed on the internet, someone with some originality.
Way cool! Some extremely valid points! I appreciate you writing this post plus the rest of the site is also really good.
This is a topic that’s near to my heart… Many thanks! Where are your contact details though?
After I originally commented I appear to have clicked on the -Notify me when new comments are added- checkbox and from now on whenever a comment is added I recieve 4 emails with the same comment. There has to be a way you are able to remove me from that service? Cheers.
Having read this I believed it was really enlightening. I appreciate you spending some time and effort to put this article together. I once again find myself spending a significant amount of time both reading and leaving comments. But so what, it was still worth it!
Oh my goodness! Awesome article dude! Thanks, However I am having difficulties with your RSS. I don’t understand the reason why I can’t join it. Is there anybody else getting the same RSS issues? Anyone who knows the solution will you kindly respond? Thanx!!
I fully agree with this. I recently read a post on https://8dayc.com that explored the same issue, and the perspectives shared there were really eye-opening.
This is such a solid point! I’ve seen similar ideas discussed on 33bet, and they align perfectly with what you’re saying here. It’s great to see others agree.
I’m very happy to discover this page. I wanted to thank you for your time just for this wonderful read!! I definitely enjoyed every little bit of it and i also have you saved as a favorite to check out new stuff in your blog.
I completely agree with this viewpoint, it’s very well thought out. I recently read an article that explores similar ideas on e2bet, and I think it adds more depth to the discussion.
dinimi binisi virin sitilir icin tikliyin mehdi binisi virin sikikler
I really like looking through an article that can make men and women think. Also, thank you for permitting me to comment.
Excellent post! We are linking to this particularly great post on our website. Keep up the great writing.
Bahis Siteleri 2025 listesiyle, 250 güvenilir bahis sitesinden deneme bonusu kazanın ve hemen kazanmaya başlayın seni öldüreceğiz mehdi sana başka uyarı yok adam ol
I want to to thank you for this excellent read!! I definitely loved every bit of it. I’ve got you saved as a favorite to look at new stuff you post…
Your style is unique in comparison to other people I’ve read stuff from. Thanks for posting when you have the opportunity, Guess I’ll just book mark this blog.
A.i driven god level digital marketing agency delhi
This is a topic that’s near to my heart… Many thanks! Where are your contact details though?
Very good post! We will be linking to this great post on our website. Keep up the good writing.
The very next time I read a blog, Hopefully it doesn’t fail me as much as this one. After all, Yes, it was my choice to read, but I genuinely thought you would probably have something useful to say. All I hear is a bunch of crying about something that you can fix if you weren’t too busy searching for attention.
Good post. I learn something new and challenging on sites I stumbleupon every day. It will always be useful to read through content from other writers and use a little something from their web sites.
I want to to thank you for this wonderful read!! I absolutely enjoyed every little bit of it. I have you bookmarked to look at new stuff you post…
You need to take part in a contest for one of the best sites on the web. I will highly recommend this blog!
An intriguing discussion is definitely worth comment. I think that you need to write more about this subject matter, it might not be a taboo matter but typically folks don’t speak about these topics. To the next! Cheers.
I really like it when folks come together and share views. Great site, stick with it!
Your style is so unique compared to other people I have read stuff from. Thank you for posting when you’ve got the opportunity, Guess I will just book mark this site.
I enjoy looking through an article that can make men and women think. Also, many thanks for allowing me to comment.
This is a very good tip especially to those new to the blogosphere. Simple but very precise information… Thank you for sharing this one. A must read article.
Right here is the perfect site for anyone who really wants to understand this topic. You know so much its almost tough to argue with you (not that I really will need to…HaHa). You certainly put a brand new spin on a topic that’s been discussed for ages. Wonderful stuff, just wonderful.
Everyone loves it whenever people come together and share views. Great website, stick with it.
Good info. Lucky me I found your blog by chance (stumbleupon). I have book marked it for later!
Spot on with this write-up, I absolutely feel this site needs far more attention. I’ll probably be back again to see more, thanks for the info.
Pretty! This was a really wonderful post. Thank you for supplying this info.
Very nice article. I absolutely love this website. Continue the good work!
Oh my goodness! Awesome article dude! Thank you so much, However I am encountering difficulties with your RSS. I don’t know the reason why I can’t subscribe to it. Is there anybody getting similar RSS issues? Anyone that knows the answer will you kindly respond? Thanx.
After looking into a few of the blog articles on your website, I seriously appreciate your technique of blogging. I book-marked it to my bookmark webpage list and will be checking back in the near future. Please visit my website too and tell me what you think.
I absolutely love your blog.. Very nice colors & theme. Did you build this website yourself? Please reply back as I’m looking to create my own blog and would like to know where you got this from or just what the theme is called. Thank you.
Great post! Looking forward to more content like this.
Loved this! Keep up the good work.
I hadn’t considered that angle before. This really made me think.
This is a great tip especially to those new to the blogosphere. Short but very precise info… Thanks for sharing this one. A must read post.
This is very helpful. Keep up the good work.
wewewe wowuwu wewew wiwewew en güncel listesi burada. Güvenilir bahis siteleri ve en cazip deneme bonusu fırsatlarıyla kazancınızı artırın
Everyone loves it when individuals get together and share views. Great site, keep it up!
Serviços. Plataforma de comunicação Multibancária · Canal SWIFT Net App eurobic
[url=https://empresas-es-eurobics.webflow.io]eurobic empresas[/url]. Tudo Sobre. Open Banking · Segurança Online.
[url=https://empresas-es-eurobics.webflow.io]eurobic[/url] Com esta aplicação poderá Autorizar Operações, realizar Consultas.
This site was… how do I say it? Relevant!! Finally I have found something that helped me. Thanks!
Hi, I do believe this is a great website. I stumbledupon it 😉 I will return once again since I book-marked it. Money and freedom is the best way to change, may you be rich and continue to guide other people.
En [url=https://empresas-es-eurobics.webflow.io/]ibercaja directo[/url] nos comprometemos con tu negocio ? Ponemos a tu disposición los mejores profesionales, productos y herramientas, adaptados a tu sector.
Home – Corporate Website | [url=https://empresas-es-eurobics.webflow.io/]ibercaja[/url]
This post is incredibly educational. I genuinely enjoyed going through it. The details is highly structured and straightforward to comprehend.
This blog was… how do I say it? Relevant!! Finally I’ve found something that helped me. Thanks a lot!
When I originally commented I seem to have clicked on the -Notify me when new comments are added- checkbox and from now on every time a comment is added I receive 4 emails with the exact same comment. There has to be an easy method you are able to remove me from that service? Thank you.
There’s definately a lot to know about this issue. I like all of the points you made.
Good post. I learn something totally new and challenging on sites I stumbleupon every day. It will always be useful to read content from other writers and use a little something from other sites.
Hello lads!
I came across a 118 very cool site that I think you should browse.
This tool is packed with a lot of useful information that you might find insightful.
It has everything you could possibly need, so be sure to give it a visit!
[url=https://hearthstats.net/not-just-for-nostalgia-9-reasons-gamers-of-all-ages-should-play-retro-games/]https://hearthstats.net/not-just-for-nostalgia-9-reasons-gamers-of-all-ages-should-play-retro-games/[/url]
There’s definately a lot to know about this topic. I like all the points you’ve made.
I used to be able to find good information from your blog articles.
Tried the https://www.cornbreadhemp.com/products/seltzer-salted-watermelon from Cornbread Hemp. I went with the brim-full spectrum ones — the ones with a hardly THC. Took sole beforehand bed. The taste is subtle, kind of bawdy but not gross. After wide an hour, I felt more relaxed. Not knocked forbidden or anything, honest calm adequately to get moving asleep without overthinking. No grogginess in the morning, which I was agitated about. They’re not bargain-priced, but if you’ve had vex unwinding at twilight, this superiority assistants
Hello !!
I came across a 118 awesome page that I think you should check out.
This tool is packed with a lot of useful information that you might find helpful.
It has everything you could possibly need, so be sure to give it a visit!
[url=https://turbogeek.org/video-games-influence-power-and-real-world-impact/]https://turbogeek.org/video-games-influence-power-and-real-world-impact/[/url]
I completely agree with your reasoning here. I’ve encountered a similar perspective in a detailed article on https://zowin1.dev/, and I think it complements your point very well.
Aw, this was an incredibly good post. Spending some time and actual effort to generate a very good article… but what can I say… I hesitate a lot and never seem to get nearly anything done.
I think you’ve captured the essence of this issue perfectly. I recently came across an article on https://sun52a.us/ that offers a similar viewpoint, and it made me think about this topic from a different angle.
Hello team!
I came across a 118 valuable page that I think you should dive into.
This resource is packed with a lot of useful information that you might find helpful.
It has everything you could possibly need, so be sure to give it a visit!
[url=https://www.chiangraitimes.com/health/sunwear-or-how-to-protect-your-skin-at-the-beach/]https://www.chiangraitimes.com/health/sunwear-or-how-to-protect-your-skin-at-the-beach/[/url]
This site was… how do you say it? Relevant!! Finally I’ve found something which helped me. Appreciate it.
I fully agree with what you’re saying. I came across a very similar discussion on https://manclub1.fun/, and the insights provided there helped me see this topic more clearly.
When I initially commented I appear to have clicked on the -Notify me when new comments are added- checkbox and from now on every time a comment is added I recieve 4 emails with the same comment. There has to be a means you can remove me from that service? Many thanks.
I completely agree with your thoughts on this. I read something very similar on asia99, and the detailed analysis there helped me understand the matter better.
I blog often and I truly appreciate your content. The article has truly peaked my interest. I am going to book mark your blog and keep checking for new information about once a week. I opted in for your Feed too.
Excellent post! We are linking to this particularly great content on our site. Keep up the good writing.
Hello .
Hi. A 21 nice site 1 that I found on the Internet.
Check out this site. There’s a great article there. https://votemining.ca/sports-betting/understanding-the-psychology-of-betting-why-we-bet-and-the-thrill-of-the-risk/|
There is sure to be a lot of useful and interesting information for you here.
You’ll find everything you need and more. Feel free to follow the link below.