
Today, we take a detour from our systematic commentary to provide insight into the mechanisms at play in determining the severity of Quantitative Tightening (QT). We have always stressed that liquidity, i.e., a measure of the amount of financial dry-powder available to fund and finance economic activity, is a critical driver of both the economy and financial markets. The most systemically important liquidity creator is the US Sovereign, i.e., the Federal Reserve and Treasury. The tone set by the US Sovereign typically sets the tone for financing conditions and thereby has significant economic and market impacts.
Beginning in 2020, the Fed and Treasury embarked on one of the most extensive liquidity creation programs, in the form of Quantitative Easing and Fiscal Transfer Payments, by the Fed and Treasury, respectively. This massive liquidity injection led to one of the fastest ever economic rebounds, coupled with the frothiest equity markets in decades. These dynamics have also created a demand impulse, aggravating supply shortages and has resulted in a historical inflation acceleration. Government policy tends to move countercyclically, and true to form, the US Sovereign is now withdrawing liquidity from the economy.
Particularly, the Federal Reserve has already raised interest rates twice this year, and in June, they shall embark on the journey to reduce the size of their balance sheet, i.e., QT. The Federal Reserve’s balance sheet is of critical importance because it is a source of liquidity to the financial sector. The netting out of balance sheet factors determines the degree of reserve balances. While reserve balances are not an impetus for financial institutions to lend/transact, they are vital for financial stability and liquidity conditions. QT period tends to have a volatility-generating effect, with average returns on equities and other “risk-on” assets reduced. We show a rough assessment of this below:
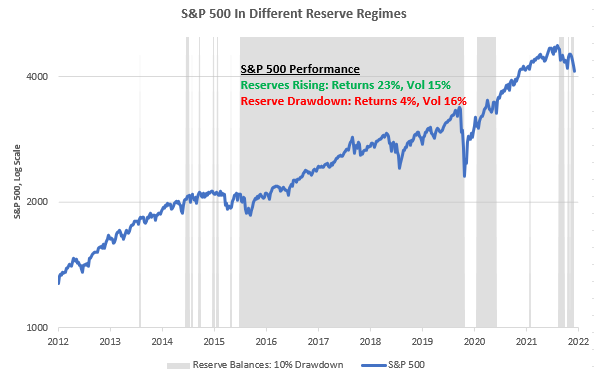
As we can see above, periods of Reserve Drawdown tend to provide lower returns for incremental volatility relative to periods of rising reserves. In truth, however, this isn’t an informative trading strategy (we have a host of tools to that end) but serves to establish context. Periods of tightening liquidity create more difficult markets to maneuver through; therefore, it makes sense to pencil in the degree of tightening we will likely witness. Through our lenses, there are three major levers at play that will determine the ferocity of liquidity tightening:
-
The Fed’s pace of run-off/outright sales. The Fed can choose to begin outright sales of MBS securities, thereby matching the $95 billion cap for QT, or they can come in below the existing cap.
-
The Treasury’s issuance & cash management. The Treasury has chosen to reduce issuance significantly, thereby further limiting liquidity growth. Further, the Treasury estimates that it will end Q3 with a cash balance of $650 billion, which remains elevated relative to history. If the Treasury continues on this path, i.e. maintaining and lower issuance and higher cash balances, there will be more reserve drain.
-
Money Market Funds opportunity set. Money Market Funds (MMFs) are a liquidity source that could ameliorate the impacts of QT significantly. However, MMFs remain constrained by the existing opportunity set. Therefore, even if MMFs wanted to leave the Feds Reverse Repo Facility, they likely wouldn’t have many places to go without significant Treasury issuance.
Let’s take a look at these individually.
The Fed
As outlined previously, the Fed is going to begin QT in June. Per Fed communications, most of its balance sheet reduction will come from the run-off of Treasuries maturing over the QT period. This policy means that maturing securities would be “extinguished.” This process differs from the outright sale of securities, wherein the Fed would sell these securities to the market, i.e., the market would have to take on this supply. However, the Fed has indicated that it would be open to selling MBS securities when QT is “well underway.” This openness is due to the lack of MBS maturing over the QT horizon of the next 12 months.
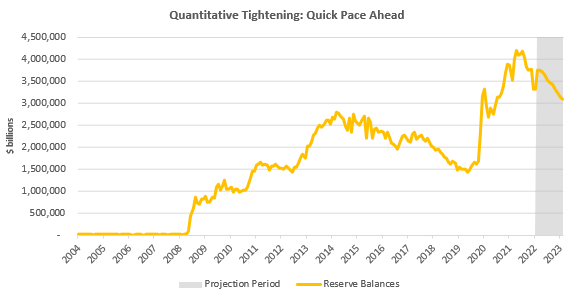
To start the QT process, the Fed has outlined its “caps” to reduce Treasuries and MBS. These caps are the maximum pace at which the Fed will let these assets shrink on its balance sheet, and currently, the Fed has caps of $30 billion/month of Treasuries and $17.5 billion/month in MBS. If this goes smoothly, they will increase the pace to $60 billion/month of Treasuries and $35 billion/month in MBS. Using these guidelines, we can estimate the future total factors supplying reserves to the financial sector, i.e., project the Fed’s balance sheet:
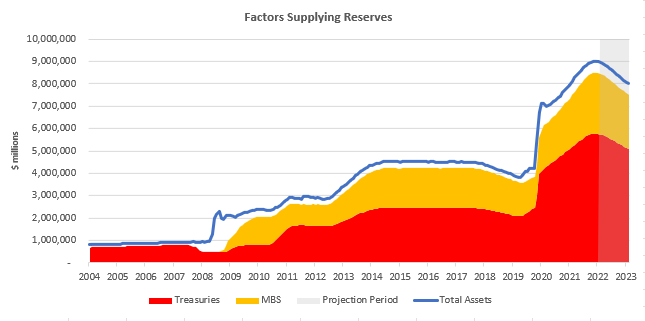
However, the Fed estimates that MBS securities will not meet the existing caps. This is because the run-down of MBS securities will not come from maturities but from pre-payment of MBS. With interest rates rising, we think it unlikely that mortgage prepayment is likely to increase significantly. Therefore, we think that the conversation about outright sales of MBS could be sooner than most market participants expect. If we use a conservative estimate of approximately $20 billion/month in MBS pre-payment (consistent with current MBS reinvestment), the Fed will need to begin selling in September. The first-order consequence of this would be further pressure on mortgage rates. The second-order impact would be a further tightening of liquidity conditions. The question is whether future economic conditions will allow such tightening; we’d wager that decelerating macro conditions don’t favor this outcome. Time will tell.
The Treasury
While Treasury securities are assets to the financial economy, Treasury cash is a drain on the financial sector. The Treasury creates liquidity for the financial system by creating and backstopping government securities. Conversely, the Treasury repurposes private sector finances through debt financing and spending. Traditionally, the Treasury impacts Reserve Balances through changes in its cash balances *TGA) held with the Fed. Increases in Treasury cash decrease the reserves available to the private sector (even though this cash is usually just repurposed and re-injected). Using the Treasury’s own estimates, we can estimate TGA balances in September. We then assume reversion to 2018-2019 mean cash levels by 2023. We can show the drain the Treasury will have on Reserves below. Additionally, we also model for currency in circulation (using seasonality), which is another drain on reserves.
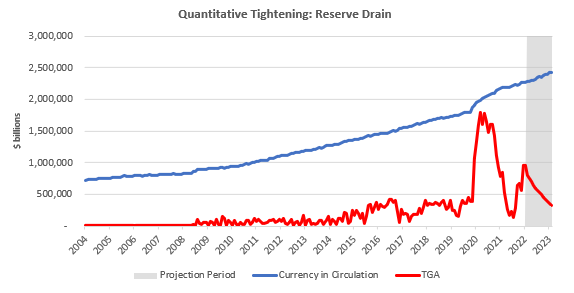
As we can see above, the combined trajectory of these variables will decreasingly drain reserves, thereby easing some of the impacts of QT.
Additionally, the Treasury now has a less traditional mechanism through which it can blunt the impact of QT. When the Treasury issues securities (bills in particular), it creates a pristine asset second only to Reserves in the financial sector. Putting this in context, the Treasury can offset the impact of QT via Treasury Bill issuance. This is particularly important today, as a large and growing subset of cash pools need access to liquidity, i.e., Money Market Funds (MMFs), which brings us to our next section.
Money Market Funds
Currently, there are vast pools of cash looking for safe assets, i.e., MMFs searching for Treasury bills and other short-term securities. However, there has been a shortage of Treasury bill supply relative to existing cash balances that need a home. In response to this problem, the Fed set up is Reverse Rep Facility (RRP), which provides a home for the MMFs. RRP uptake is a drain on reserves, as RRP is performed using the Fed’s assets, i.e., Treasuries. This need for safe assets creates a dynamic where liquidity is essentially “locked” at the Fed. To estimate the impact of continued RRP uptake by MMFs, we look at the Treasuries guidance on future issuance. While there are idiosyncratic factors, we think the growth of MMFs is limited by the growth of the Treasury market, given that 89% of MMFs are invested in government securities. Further, assuming a sustained shortage in bill supply, we hold constant the share of MMFs allocated to RRP at 37%. These estimates aren’t meant to be highly precise but are intended to provide us with a rough sense of the existing pressures on the ecosystem. We show these our estimates below:
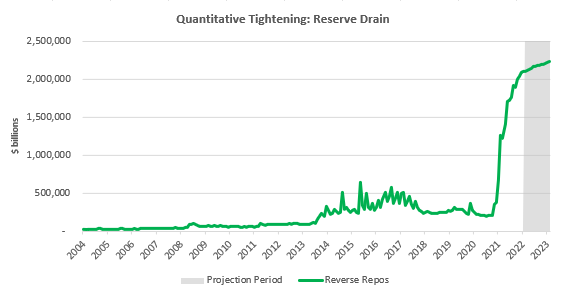
Our estimates show RRP uptake remains at high levels, as we can see above. However, this remains the most volatile input to estimate. Therefore, any drawdowns in RRP will be QT ameliorating. We can monitor these dynamics carefully using weekly data from the Fed.
Conclusions: Reserves Balances Declines
Putting all of the previous estimates together, we show our projections for Reserve Balances below. Our calculations show there may be a brief period of stabilization in the near term as Treasury cash is drawdown, followed by a resumption of the downtrend.
To bring this full circle, these estimates put us in an environment of higher volatility. We show the S&P 500 versus our projected Reserve Balance drawdown below:
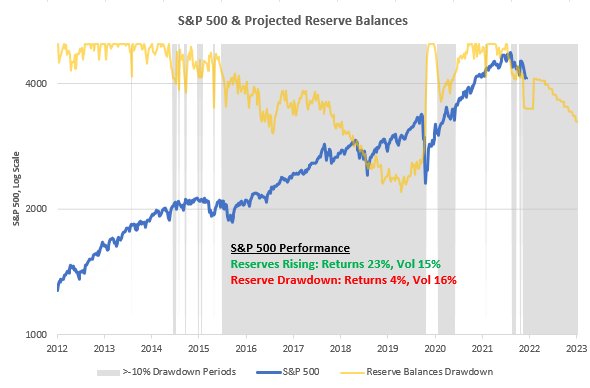
We ask ourselves whether the self-reinforcing dynamics of policy tightening will allow us to get to this point. With growth slowing, inflation resiliently high, policy rates tightening, and tighter liquidity conditions, we find it hard to think we will be able to complete this. We wait and watch.
extreme steroid use
Sermorelin and Ipamorelin are two synthetic peptides that stimulate the release of growth hormone,
but they differ in structure, potency, side-effect profile, and clinical applications.
Understanding these differences is essential for
choosing the right agent for specific therapeutic goals such as anti-aging therapy, muscle building, or
recovery from injury.
Which Peptide is Better Sermorelin or Ipamorelin?
The choice depends on the desired balance between efficacy, safety, and cost.
Ipamorelin generally produces a stronger and more prolonged growth hormone surge with minimal impact on prolactin and cortisol levels.
This makes it preferable for patients who need maximal
anabolic stimulation without endocrine disruption, such as athletes or individuals recovering from surgery.
Sermorelin, on the other hand, mimics natural growth-hormone releasing hormone
(GHRH) more closely, producing a physiological pattern of release that tends to
be gentler and may reduce the risk of hypoglycemia or water retention.
For patients with sensitivity to hormonal fluctuations—elderly individuals or those with
endocrine disorders—Sermorelin can offer a safer profile.
Which Peptide is Better Sermorelin or Ipamorelin?
In terms of cost-effectiveness and availability, Sermorelin is often less expensive per dose because it has been on the market longer and is produced in larger volumes.
Its dosing schedule typically requires daily injections at night to align with natural
circadian rhythms of growth hormone secretion. Ipamorelin, while more
potent, usually costs more but may require fewer injections due to its longer half-life.
When budget constraints are significant, Sermorelin can be a practical choice without compromising overall therapeutic goals.
What is Sermorelin?
Sermorelin is a synthetic peptide composed of nine amino acids that acts as
an analog of growth-hormone releasing hormone. It binds to the GHRH receptor in the pituitary gland,
triggering the release of endogenous growth hormone and
subsequently increasing insulin-like growth factor-1 (IGF-1) levels.
Sermorelin is commonly used in clinical settings for diagnosing growth hormone deficiency and as a part
of hormone replacement therapy. Its mechanism preserves the natural pulsatile secretion pattern of growth hormone, which can be advantageous
for long-term endocrine health. Because it stimulates only
the body’s own growth hormone production, side effects are typically milder compared to
direct growth hormone injections.
In summary, Ipamorelin offers higher potency and a more favorable hormonal side-effect profile for aggressive anabolic needs,
while Sermorelin provides a physiologic stimulus
that is safer for patients with endocrine sensitivities and often comes at a lower cost.
The best choice depends on individual therapeutic goals, tolerance
to hormone changes, and financial considerations.