Over this week, we will migrate all our publishing to our new website. Please make sure to subscribe below here if you haven’t already, as we will be transferring all our mailing lists to the new website. You can check it out here.
Welcome to The Observatory. The Observatory is how we at Prometheus monitor the evolution of the economy and financial markets in real time. The insights provided here are slivers of our research process that are integrated algorithmically into our systems to create rules-based portfolios. We also just released our latest Month In Macro note, which over 45 pages, explains our current assessment of economic and market conditions. You can read it here:
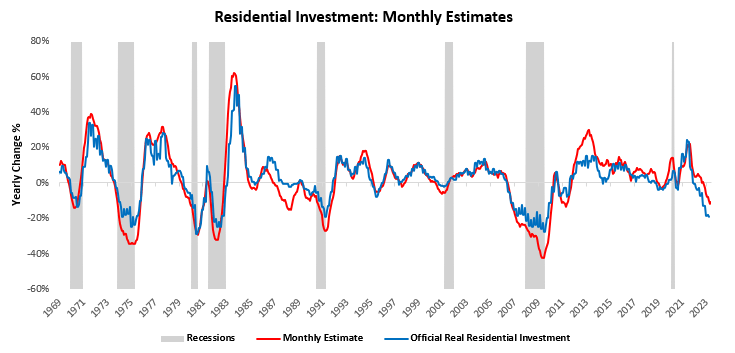
Today, we assess the latest information coming from the residential real estate sector. The latest information has shown a marginal improvement in our tracking of real residential investment within a broader contraction. At best, we currently estimate that real residential investment has increased by approximately 0.8% over the last quarter. Overall, the data show sequential improvement within cyclical weakness. Let’s dive in.
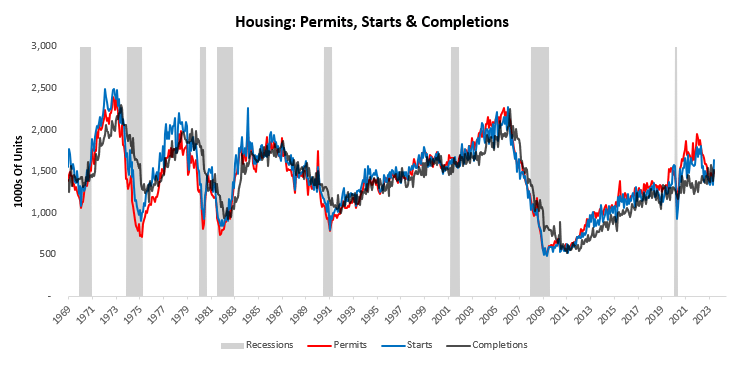
The latest data for May showed housing permits increased by 5.22%, housing starts increased by 21.72%, and housing completions increased by 9.52%. Below, we show the current levels for the same:
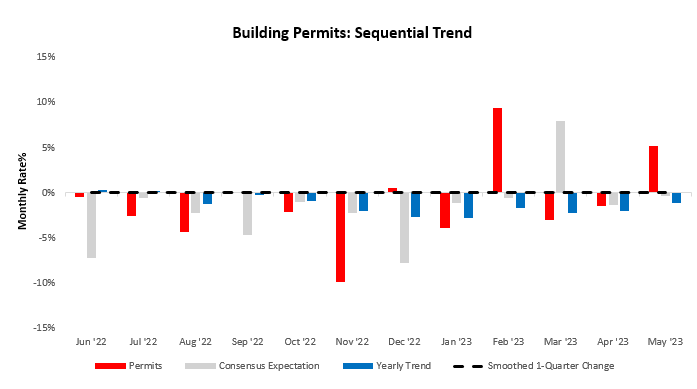
Zooming into the data, housing permits increased by 5.22%, surprising consensus expectations of -0.35%. Below, we show the sequential evolution of the data, along with the smoothed one-quarter change in the most recent data. We provide the smoothed version as monthly housing data contain significant noise.
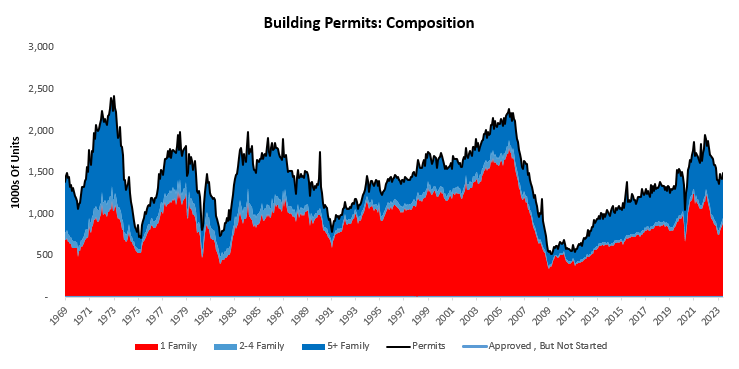
For further context, we zoom out to show the contributions from single-family homes (-136), two-family homes (-8), and multi-family homes (-73) to the fall (-217) in total permits over the last year:
Consistent with the permits data, housing starts data showed starts increased by 21.72%, surprising consensus expectations of 0%. Below, we show the sequential evolution of the data, along with the smoothed one-quarter change in the most recent data. We provide the smoothed version as monthly housing data contain significant noise.
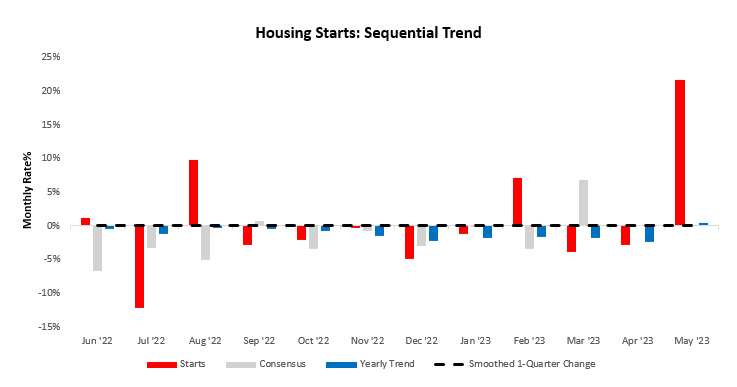
To illustrate the bigger picture, we show the contributions from single-family homes (156), two-family homes (-19), and multi-family homes (177) to the rise (88) in total starts over the last year:

Last, in our sequential analysis, we turn to housing completions data, which showed completions increase by 9.52%. Below, we show the sequential evolution of the data, along with the smoothed one-quarter change in the most recent data. We provide the smoothed version as monthly housing data contain significant noise.
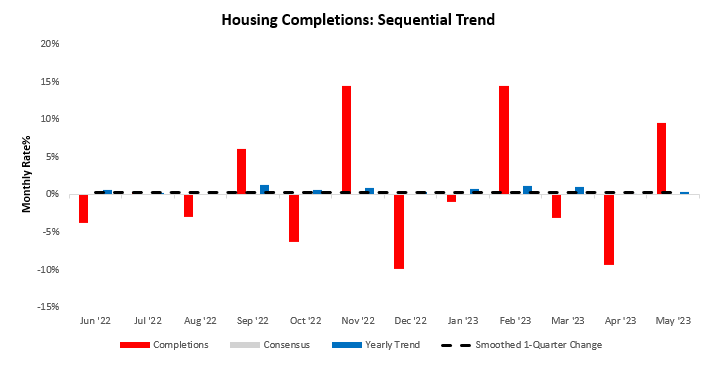
We show the contributions from single-family homes (38), two-family homes (11), and multi-family homes (95) to the rise (72) in total completions over the last year:
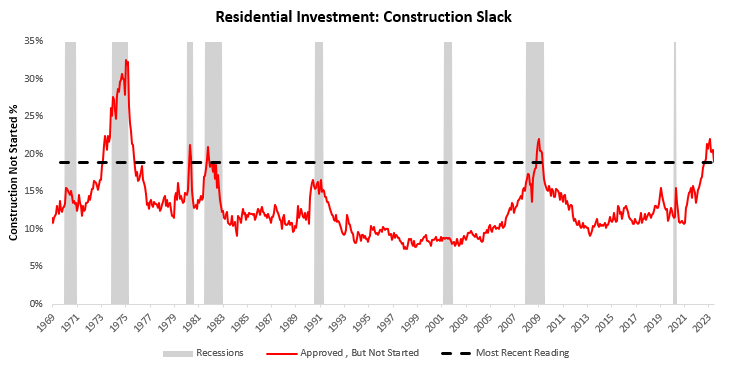
To get a better sense of where we are in the housing cycle, we examine how many construction projects have been approved but not yet started. According to the latest data, 19% of projects are yet to begin construction. Looking through history, housing-led recessions usually begin when this measure of construction slack is around 15% suggesting that we are within the ballpark of a recession.
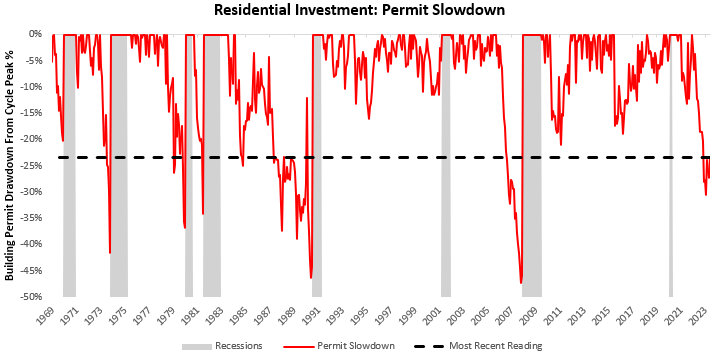
We conclude our sequential analysis by examining another measure of housing weakness, i.e., permit slowdowns- which measures how much building permits have fallen from their cycle highs. Large drops in permits bode ill for the broader residential investment complex & GDP. The latest data shows that building permits are off their cycle highs by -35%. Typically, housing-led recessions usually begin when this measure of cyclical weakness is around -35% suggesting that we are within the ballpark of a recession.
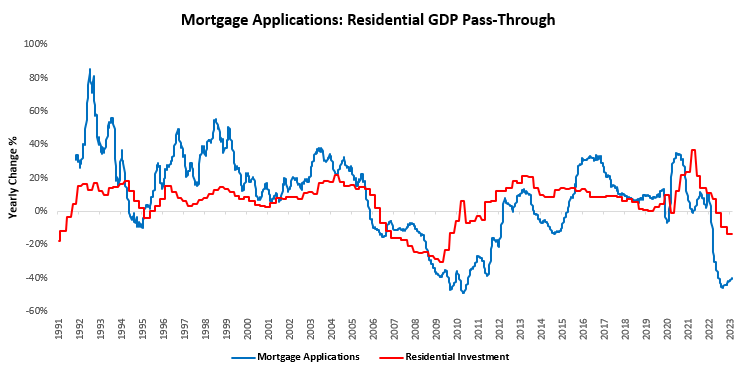
Next, we turn to the most recent data coming from mortgage applications. The latest data shows a sequential improvement in our weekly tracking of mortgage applications. Our latest estimate suggests downward pressure on mortgage borrowing and residential investment. Our latest estimates show mortgage applications down by -40.03% compared to one year prior. We present this information below:
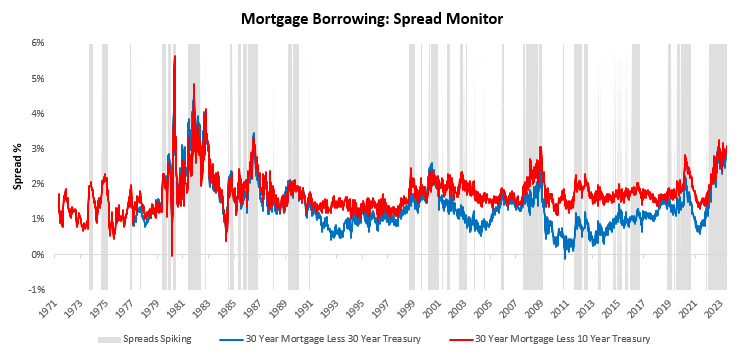
To assess the borrowing conditions driving these changes in mortgage applications, we turn to mortgage spreads. According to our measures, mortgage spreads are rising. Spreads have begun to rise since February 2022. Since then, the 30-year mortgage yield relative to 10-year Treasury yields has increased by 1.29%. Below, we present the 30-Year Mortgages relative to 10 & 30-Year Treasuries:
The combination of these various factors leads to a picture where our estimates of residential investment have sequentially improved, with the potential for a very modest one-quarter expansionary reading. While we are seeing this sequential improvement, our estimates remain depressed versus one year prior, i.e., residential investment remains weak:

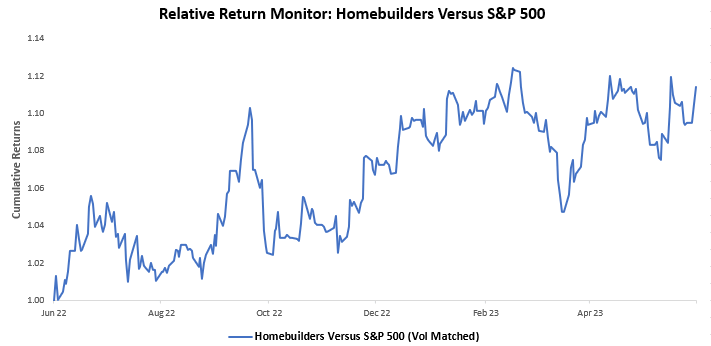
We see some of these marginal improvements priced into homebuilder stocks, which are most exposed to these improvements:
And much more modestly in MBS relative to Treasuries:
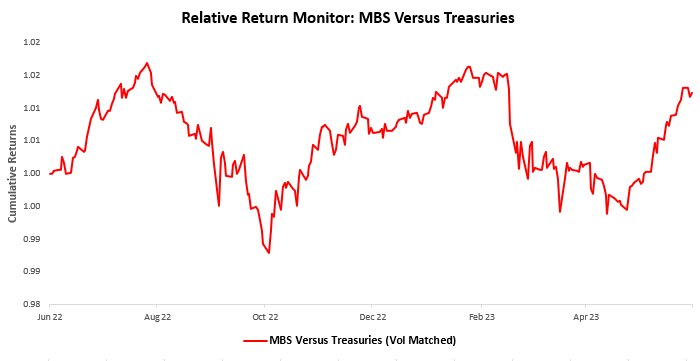
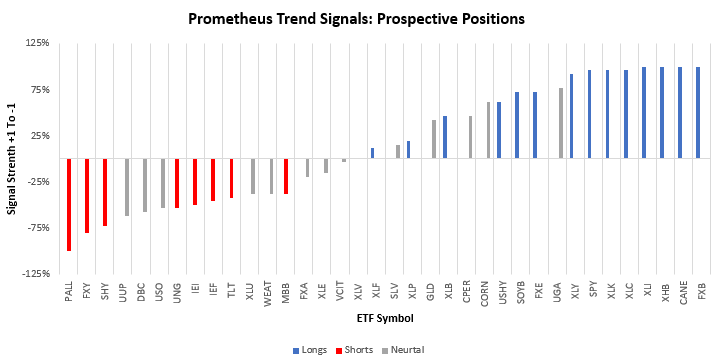
Whether this outperformance can continue largely depends on the ability of the consumer to continue to leverage current income growth into rising mortgage rates. At the same time, there remains room for residential construction to improve as some degree of building slack slows. Overall, our expectation is that the pass-through of higher rates will prevail over the course of the cycle. In the meantime, our trend signals continue to flag XHB as a potential long position and MBB as a potential short:
Until next time.
Hi there! Do you know if they make any plugins to help with SEO?
I’m trying to get my blog to rank for some targeted
keywords but I’m not seeing very good results. If you know of any please share.
Kudos! You can read similar art here: Bij nl
Good day! Do you know if they make any plugins to help with SEO?
I’m trying to get my website to rank for some targeted keywords but I’m not seeing
very good success. If you know of any please share.
Many thanks! I saw similar text here: Code of destiny
I’m extremely impressed with your writing skills as well
as with the layout for your blog. Is that this a paid subject matter or did you customize it your self?
Anyway keep up the nice high quality writing, it’s
rare to peer a great blog like this one these days. TikTok ManyChat!
Hello there, I discovered your site by the use of Google while looking for a related topic, your
website got here up, it appears good. I have bookmarked it in my google bookmarks.
Hi there, simply become alert to your weblog via Google,
and located that it is really informative. I’m going to be
careful for brussels. I will appreciate when you continue
this in future. A lot of other people will likely be benefited out of your writing.
Cheers!
Добро пожаловать в Jetton Casino – место, где каждый спин может принести крупный выигрыш.
В нашем казино представлены только
лучшие игровые автоматы,
покер, рулетка и многое другое.
Присоединяйтесь прямо сейчас,
чтобы испытать удачу и воспользоваться выгодными бонусами.
Мы предлагаем не только высококлассные игры
в Джеттон бонус на депозит, но и прозрачные условия,
быструю обработку платежей и премиальный сервис.
Для наших игроков доступны регулярные турниры,
программа лояльности, а также специальные бонусы для активных пользователей.
Гарантируем безопасные транзакции, а
также удобные способы пополнения счета и вывода выигрышей.
Огромный ассортимент развлечений для всех
любителей азартных игр.
Ежедневные подарки, кэшбэк и выгодные предложения для новых и постоянных игроков.
Быстрое пополнение счета и мгновенные выплаты
без скрытых комиссий.
Соревнования для любителей больших ставок и незабываемых эмоций.
Jetton Casino – это надежное и современное казино для тех, кто
хочет испытать настоящий азарт. https://constructive-m.ru/
Excellent consultation with clear communication.
can i get generic lisinopril without prescription
Their international insights have benefited me greatly.
The team embodies patience and expertise.
order cytotec without prescription
A model pharmacy in terms of service and care.
Мечтаете о огромных выплатах? Тогда вам в Эльдорадо Казино!
Eldorado casino регистрация Здесь вас ждут лучшие слоты, эксклюзивные предложения и быстрый кэш-аут!
Чем привлекает Eldorado Casino?
Огромная библиотека слотов от
лицензионных брендов.
Приветственный бонус на старте игры.
Регулярные турниры на постоянной основе.
Оперативный вывод средств без
ожиданий.
Адаптация под мобильные устройства для комфортной игры.
Помощь 24/7 решает любой вопрос.
Присоединяйтесь к Eldorado Casino и начинайте выигрывать уже сегодня! https://eldorado-jokecascade.website/
Hey there, I think your website might be having browser compatibility
issues. When I look at your blog site in Chrome,
it looks fine but when opening in Internet Explorer, it has some overlapping.
I just wanted to give you a quick heads up! Other then that, very good blog!
We are glad to welcome you to Unlim Casino, the world of
gambling and generous winnings come together in the perfect combination. Here, players can choose
from a huge variety of games, including gaming machines, card games, as well as
participate in promotions and win big bonuses. No matter your level of experience,
we offer everything you need for a great game.
Unlim Casino offers high-quality services and numerous ways to win. Join players who are already winning, and
get a chance at big money. You will find bonuses and unique offers to increase your chances of success.
What makes us special?
Instant registration — start playing in just a few clicks.
Exciting bonuses for newcomers — giving you a better chance to start strong.
Regular tournaments and promotions — for those who want to boost
their chances of winning and get additional prizes.
Round-the-clock support — always ready to assist with any questions.
Mobile version — play your favorite games anytime,
anywhere.
It’s time to win! Join Unlim Casino and start winning right now. https://unlim-casinoodyssey.icu/
Clubnika Casino is the place where every player can find something special for themselves.
At Clubnika Casino, you’ll find a variety of
entertainment: slots, roulette, poker, and unique live dealer games.
Every game at our casino is a chance for success, and our commitment to
security ensures you a comfortable and safe gaming experience.
Why is Clubnika no deposit bonus the best choice?
We offer generous bonuses for new players, free spins, and
regular promotions to help you increase your chances of winning.
At Clubnika Casino, you can always count on quick payouts and quality support at any time of day or night.
When is the best time to start playing at Clubnika Casino?
You can start playing right now and immediately get bonuses and free spins.
Here’s what awaits you at Clubnika Casino:
Don’t miss the opportunity to get generous bonuses and free spins to help you start your
game with an advantage.
Be at the center of the action by participating in tournaments and promotions with huge cash prizes and winnings.
New games and updates every month.
Join Clubnika Casino, enjoy the games, and win big prizes!. https://clubnika-elitecasino.website/
An unmatched titan in the world of international pharmacies.
gabapentin considerations
Their commitment to global patient welfare is commendable.
Discover Unlim Casino – a place where thrills and
winnings combine with convenience. Here, players can delight in a
wide variety of games, including slot machines, roulette, as well as participate in tournaments and win generous bonuses.
There’s something for everyone, we offer everything for the best gaming experience.
Our casino provides not only high-quality service but also many ways to win.
Join the many satisfied players who delighting in our games and tournaments.
You’ll be able to win big money thanks to generous bonuses and ongoing tournaments.
What sets us apart from other casinos?
Quick registration — just a few steps and you’re ready to play.
Generous bonuses for new players — start with a big chance of success.
Regular tournaments and promotions — for those who want to boost their chances of winning
and get extra prizes.
24/7 support — always ready to help with any questions.
Mobile version — play your favorite games anytime, anywhere.
Don’t miss out Join Unlim Casino and start enjoying lots of fun and profits right now. https://unlim-casinodynasty.lol/
Сияющий порядок и уют в Вашем
Доме: Экспертные Услуги Клининговой
Компании в Санкт-Петербурге СПб
Сражены от постоянных забот по уборке?
Позвольте нам позаботиться о чистоте вашего дома или офиса!
Наша клининговая компания в Санкт-Петербурге предлагает
широкий спектр услуги, которые
придутся по вкусу самые высокие требования к качеству и сервису.
Доступные цены и прозрачные условия;
Высокое качество обслуживания и педантичное деталям;
Персональный подход к каждому клиенту;
Точное соблюдение сроки выполнения работ.
Не ждите, пока грязь и беспорядок станут катастрофой.
Подарите нам шанс вернуть вашему
пространству чистоту и порядок!
Узнайте больше о наших услугах и оставьте заявку на сайте : клининг после ремонта
Безупречная чистота и комфорт в Вашем Доме: Первоклассные Услуги Клининговой Компании в Санкт-Петербурге городе на Неве
Сражены от нескончаемых забот по уборке? Дайте возможность нам попечься о чистоте вашего родного очага или офиса! Наша клининговая компания в Санкт-Петербурге предлагает комплексные услуги, которые придутся по вкусу самые взыскательные требования к качеству и сервису.
Доступные цены и прозрачные условия;
Высокое качество обслуживания и педантичное деталям;
Индивидуальный подход к каждому клиенту;
Точное соблюдение сроки выполнения работ.
Не ждите, пока грязь и хаос станут катастрофой. Дайте нам шанс вернуть вашему пространству чистоту и порядок! Узнайте больше о наших услугах и оставьте заявку на сайте : https://49.50.172.162/bbs/board.php?bo_table=free&wr_id=18912
Aurora Casino is your perfect choice for exciting and profitable games.
Here you’ll find the most popular games, including slots, table games, and live casino with real dealers.
Participating in promotions and bonuses increases
your chances of winning and adds fun to your
gaming experience.
What makes casino security features stand out from other
casinos? We offer high-quality games, secure payment systems, and guarantee fast payouts.
With us, you get a fair game and full transparency in all processes.
When is the best time to start at Aurora Casino? Register today to gain access to all the opportunities and bonuses.
Here’s what awaits you:
You’ll receive big bonuses as soon as you register.
Daily promotions and tournaments.
A wide selection of slots and table games.
At Aurora Casino, your dreams of big wins become reality. https://aurora-diamondcasino.skin/
Hey There. I discovered your weblog the use of msn. That is a very well written article.
I’ll be sure to bookmark it and come back to read extra of your helpful info.
Thank you for the post. I’ll certainly return.
Great post but I was wondering if you could write a litte more on this topic?
I’d be very grateful if you could elaborate a little bit further.
Thank you!
What’s up colleagues, pleasant paragraph and fastidious urging commented at this place, I am truly enjoying by these.
Welcome to Vodka Casino — a place where fun meets generous bonuses and winning opportunities.
At our casino, every player will find their favorite
games, whether you’re a beginner or an experienced player.
Here, you’ll not only find satisfaction but also plenty of great offers.
Games at Vodka Casino feature high return to
player rates, increasing your chances of a successful game.
We’ve prepared unique slot machines and classic table games that make your experience more exciting and rewarding.
Why wait in line? Vodka Casino offers players instant registration and multiple options for depositing and withdrawing funds,
so you can focus on what matters most — winning!
We always have great offers to help you start playing with extra capital.
Join Vodka Casino to enjoy gambling with the best chances of winning!
Sign up in just a few seconds.
Attractive bonuses for newcomers.
Regular tournaments and promotions for those who want to boost their chances of winning.
Round-the-clock support to resolve any issues.
Play your favorite games anytime, anywhere.
Start winning right now and test your luck! https://vodka-777-spinwin.boats/
I like the valuable information you provide in your articles.
I will bookmark your weblog and check again here
regularly. I am quite certain I will learn a lot of new stuff
right here! Good luck for the next!
magnificent points altogether, you simply received a new reader.
What may you recommend in regards to your publish that you made some days
ago? Any sure?
I think what you said was actually very reasonable. But, think
about this, what if you composed a catchier title?
I am not suggesting your content is not solid., however suppose you added something
that makes people desire more? I mean Housing: Sequentially
Stronger + Trading Signals – Prometheus Research is kinda boring.
You might peek at Yahoo’s home page and note how they create post headlines to get people to click.
You might try adding a video or a picture or two to get
readers interested about what you’ve written. Just my opinion,
it might bring your blog a little livelier.
Hi there! This is kind of off topic but I need some advice from
an established blog. Is it very hard to set up your own blog?
I’m not very techincal but I can figure things out pretty fast.
I’m thinking about creating my own but I’m not sure where to begin. Do
you have any tips or suggestions? Many thanks
Hi, I desire to subscribe for this weblog to take hottest updates,
thus where can i do it please help out.
I delight in, lead to I discovered exactly what I
was looking for. You’ve ended my 4 day lengthy hunt!
God Bless you man. Have a great day. Bye
Hi to every one, the contents existing at this web
site are in fact amazing for people experience, well, keep up the
good work fellows.
I don’t even know the way I ended up right here, but I believed this post used to
be great. I do not recognize who you might be however definitely you are going
to a famous blogger if you are not already. Cheers!
For latest information you have to go to see web and on world-wide-web I
found this web page as a finest site for hottest updates.
Безупречный клининг в Санкт-Петербурге: Ваш надежный партнер по уборке!
Наша компания более 10 лет предоставляет услуги клининга в Санкт-Петербурге и зарекомендовала себя как надежный партнер. Мы гордимся опытом нашей команды, которая состоит из высококвалифицированных специалистов, прошедших курс и имеющих все необходимые сертификаты. Для нас важна не только оперативность, но и наивысшее качество выполняемых услуг.
Не ждите, пока грязь и беспорядок станут проблемой. Подарите нам шанс возродить вашему пространству чистоту и порядок! Узнайте больше о наших услугах и отправьте заявку на сайте : https://uberu21.ru/
I am really inspired together with your writing skills and
also with the format for your weblog. Is that this a paid subject matter or did you modify it your self?
Anyway keep up the excellent high quality writing,
it’s uncommon to peer a great blog like this one these days.
Snipfeed!
Great website. A lot of helpful information here. I am sending it to
some buddies ans also sharing in delicious. And of course, thanks in your
sweat!
Unlim Casino provides players the opportunity to dive into
the world of gambling. Here you’ll find a variety of slots,
card games, as well as regularly held promotions, which allows players
to increase their winning potential and brings a lot of
excitement to the process.
Our casino offers not only gambling but also an amazing experience for all users, whether you are playing from a mobile device or a computer.
We guarantee constant updates of the game selection and hosting of exciting tournament events.
What’s the advantage of playing at Unlim Casino?
Simple registration — just a few steps, and you’re
ready to start playing.
Big bonuses for newcomers — we offer bonuses on your first deposit to start with
a bigger chance of winning.
Regular promotions and tournaments — for those
who want to boost their chances of winning and
additional prizes.
Professional support is always ready to help with any questions regarding the gaming
process.
Many games available both on your computer and mobile devices.
Join us today! Exciting emotions and the chance to
win huge prizes await you at Unlim Casino. Ready to win? https://unlim-casinomirage.world/
Кристальная чистота в Санкт-Петербурге: Ваш надежный партнер по уборке!
Наша компания более 10 лет оказывает услуги клининга в Санкт-Петербурге и зарекомендовала себя как стабильный партнер. Мы гордимся опытом нашей команды, состоящей из высококвалифицированных специалистов, прошедших курс и имеющих все необходимые сертификаты. Для нас важна не только скорость работы, но и максимальное качество выполняемых услуг.
Не ждите, пока грязь и беспорядок станут катастрофой. Дайте нам шанс возродить вашему пространству чистоту и порядок! Узнайте больше о наших услугах и оставьте заявку на сайте : https://stayzada.com/bbs/board.php?bo_table=free&wr_id=111656
I know this if off topic but I’m looking into starting my
own blog and was curious what all is needed
to get setup? I’m assuming having a blog like
yours would cost a pretty penny? I’m not very web smart so I’m
not 100% positive. Any recommendations or advice would be greatly appreciated.
Thanks
I couldn’t refrain from commenting. Very well written!
It’s really very difficult in this busy life to listen news on Television,
therefore I simply use the web for that purpose, and take the newest information.
I am extremely inspired along with your writing talents as neatly as with the layout to your weblog. Is this a paid subject matter or did you customize it your self? Either way keep up the excellent quality writing, it’s rare to look a great blog like this one today. I like prometheus-research.com ! It is my: TikTok ManyChat
Hi there, all is going well here and ofcourse every
one is sharing facts, that’s actually good, keep up writing.
I am no longer sure where you are getting your information, however great topic.
I needs to spend some time learning much more or understanding more.
Thanks for fantastic info I used to be looking for this
information for my mission.
Кристальная чистота в Санкт-Петербурге: Ваш неизменный партнер по уборке!
Наша компания более 10 лет предоставляет услуги клининга в Санкт-Петербурге и зарекомендовала себя как стабильный партнер. Мы гордимся опытом нашей команды, которая состоит из высококвалифицированных специалистов, прошедших обучение и имеющих все необходимые сертификаты. Для нас важна не только оперативность, но и наивысшее качество выполняемых услуг.
Не ждите, пока грязь и хаос станут катастрофой. Подарите нам шанс вернуть вашему пространству чистоту и порядок! Узнайте больше о наших услугах и отправьте заявку на сайте : http://www.otyjob.com/bbs/board.php?bo_table=free&wr_id=490544
I am extremely inspired along with your writing skills and also with the layout to your blog.
Is this a paid subject matter or did you customize it your self?
Anyway stay up the nice quality writing, it’s rare
to see a nice weblog like this one these days..
Good article! We will be linking to this great post on our website.
Keep up the great writing.
Greetings! I know this is kinda off topic but I was
wondering if you knew where I could get a captcha plugin for my
comment form? I’m using the same blog platform as yours and
I’m having trouble finding one? Thanks a lot!
Thank you, I have just been looking for info about this subject for ages and yours is the greatest I have
came upon till now. But, what about the conclusion? Are you sure in regards to the source?
Howdy! I know this is kind of off topic but I was wondering which
blog platform are you using for this site? I’m getting tired of WordPress
because I’ve had problems with hackers and I’m looking at alternatives
for another platform. I would be fantastic if you could point me in the direction of a good platform.
Good day! I could have sworn I’ve been to your blog
before but after browsing through many of the posts I realized it’s new to
me. Anyways, I’m certainly pleased I found it and I’ll be bookmarking it
and checking back regularly!
you’re in reality a good webmaster. The site loading velocity is amazing.
It sort of feels that you are doing any distinctive trick.
Also, The contents are masterpiece. you have performed a magnificent task in this matter!
I think that everything said made a ton of sense.
But, what about this? what if you were to write a awesome headline?
I mean, I don’t wish to tell you how to run your
blog, however suppose you added a title to maybe get folk’s attention? I
mean Housing: Sequentially Stronger + Trading Signals – Prometheus
Research is a little boring. You could look at Yahoo’s home page and note how they create post titles to grab viewers to open the links.
You might add a related video or a related picture or
two to grab people excited about what you’ve written. In my opinion,
it would bring your posts a little bit more interesting.
I have been browsing on-line greater than three hours today, yet I by no means found any interesting article like yours.
It is pretty value enough for me. In my opinion, if all webmasters
and bloggers made good content material as you probably
did, the internet shall be a lot more helpful than ever before.
Hello there! I know this is kinda off topic nevertheless I’d figured I’d ask.
Would you be interested in exchanging links or maybe guest authoring a blog article or
vice-versa? My blog covers a lot of the same topics as
yours and I believe we could greatly benefit from each other.
If you are interested feel free to shoot me an email. I look forward to hearing from you!
Fantastic blog by the way!
I enjoy what you guys are usually up too. This sort of clever work and coverage!
Keep up the amazing works guys I’ve incorporated you guys to my blogroll.
Thank you, I’ve just been looking for info about this subject for
a long time and yours is the greatest I’ve found out till
now. But, what concerning the bottom line? Are you certain in regards to the
supply?
Have you ever thought about publishing an e-book or guest authoring on other sites?
I have a blog based on the same ideas you discuss and would really like to
have you share some stories/information. I know my
visitors would value your work. If you’re even remotely interested, feel free to send me an e-mail.
Very descriptive article, I enjoyed that bit.
Will there be a part 2?
I think the admin of this web page is in fact working hard in favor of his web page, for the reason that
here every stuff is quality based data.
Wow! After all I got a webpage from where I be capable of really obtain useful data regarding my study and knowledge.
I have been browsing online more than three hours today, yet I never
found any interesting article like yours. It is pretty
worth enough for me. In my opinion, if all webmasters and bloggers made good content as you
did, the net will be much more useful than ever before.
I really like what you guys are usually up too. Such clever work and reporting!
Keep up the awesome works guys I’ve incorporated you guys to my blogroll.
I’m not sure where you’re getting your info, but
good topic. I needs to spend some time learning more or understanding more.
Thanks for fantastic info I was looking for this info for my
mission.
Lately, the world of online betting has been rapidly
evolving, giving gamblers a wide range of entertainment options.
Modern platforms enable users to fully engage in the adrenaline
rush of gambling remotely. Advancements in technology, enhanced gaming dynamics,
and cross-device accessibility have significantly broadened the possibilities.
The wide range of betting categories accommodates a broad spectrum of interests.
Some players enjoy timeless reel games with stunning animations and exciting promotional features, while others choose raffle-style games and card-based entertainment that involve skill and calculation. The wagering on sporting events and virtual sports scene have also become increasingly
sought after, attracting both seasoned players and beginners.
Reward systems remain a core component of the industry.
Welcome offers http://corklike.com/index.php/magyarorszag-vezet-online-kaszinoja-11/ , complimentary
slot rounds, refund incentives, and VIP rewards incentivize gamblers
to stay engaged. Competition among platforms drives the development of unique promotions
that make gameplay more rewarding.
Advanced digital solutions guarantees ease of use and protection. Fast-loading platforms,
adaptive interfaces, and safe deposit and withdrawal options allow for effortless gameplay.
For a rewarding online gambling journey, it is essential to choose platforms wisely, taking into
account aspects like regulations, promotional conditions, and platform
credibility. A cautious mindset allows for a fun yet safe
experience.
The online gambling industry keeps advancing, offering fresh ways to play.
Progress in gaming software, improved game mechanics,
and modern payment solutions broaden its reach and thrill for gamblers from all corners
of the world.
Thanks for sharing your thoughts on Уход за лицом.
Regards
Thank you, I have recently been looking for info approximately this subject for ages and yours is the best I have discovered so far.
But, what in regards to the bottom line? Are you sure concerning the supply?
I loved as much as you will receive carried out right here.
The sketch is tasteful, your authored material stylish.
nonetheless, you command get got an nervousness over that you wish
be delivering the following. unwell unquestionably come more formerly again as exactly the same nearly a lot often inside case you shield this increase.
Анлим Казино — это уникальная платформа,
которая предлагает превосходные игровые возможности
и потрясающий опыт для всех любителей азартных игр.
Здесь вы найдете широкий выбор игровых автоматов, карточных игр,
а также интереснейшие турниры и акции, которые
могут значительно улучшить ваши шансы на победу.
Мы рады предложить удобным интерфейсом, огромной коллекцией
игровых автоматов и классическими настольными играми.
Азартные игры с щедрыми бонусами и регулярными акциями сделают
ваш игровой опыт еще более захватывающим.
Что вас ждет, если вы присоединитесь к Анлим Казино?
Простая регистрация для начала игры — быстрое создание профиля и вы уже готовы начать.
Великолепные бонусы для новых
игроков — мы дарим вам бонусы при первом пополнении счета,
что дает отличное начало вашему игровому пути.
Регулярные акции и турниры — для всех игроков, которые хотят увеличить свои
шансы на победу и заработать дополнительные призы.
24/7 поддержка, готовая помочь вам с любыми вопросами или проблемами, связанными с игрой.
Разнообразие игр доступны
на любом устройстве, так что вы можете
наслаждаться процессом игры,
будь то на ПК или смартфоне.
Не упустите шанс В Анлим Казино вас ждут невероятные приключения,
которые принесут вам волну эмоций
и шанс выиграть крупные призы.
Готовы ли вы к новым победам? https://unlim-777-casino.icu/
Experience the excitement of online gaming at Betlion Casino,
your premier destination for first-class casino entertainment in Kenya.
Dive into our extensive selection of casino games, featuring a wide array
of popular slot titles with vibrant graphics and lucrative bonus features designed to boost
your chances. Discover our impressive collection of table games, including multiple
variations of blackjack, roulette, and poker, providing endless entertainment for both novice and experienced players alike.
For an real-life casino experience, head over to our live casino section,
where professional and friendly dealers host a variety of
games streamed in real-time, allowing you to communicate with them and other players, bringing the Vegas vibe directly to your screen. Betlion Casino is committed to providing a protected gaming environment, utilizing advanced security measures to ensure
the protection of your personal and financial data, so you can play with assurance.
Take advantage of our generous bonuses and promotions, crafted to enhance your gaming journey,
giving you more opportunities to win. Our dedicated customer support team is always on hand to provide helpful assistance with
any questions or concerns, ensuring a enjoyable gaming experience.
Sign up at Betlion Casino and discover the ultimate online casino experience in Kenya,
where the fun never stops.
Incredible lots of wonderful knowledge!
Live 2 B Healthy
Bloomington, Minneapolis 55402, Unied Ꮪtates
16124200445
Senior wellness andd fitness-focused strategies
Definitely believe that which you said. Your favorite justification appeared to
be on the web the easiest thing to be aware of.
I say to you, I definitely get annoyed while people consider worries that they just don’t know about.
You managed to hit the nail upon the top as well as defined out the
whole thing without having side effect , people could take a signal.
Will likely be back to get more. Thanks
This information is invaluable. How can I find out more?
Купить квартиру в Москве – это
ваш шанс на комфорт и стабильность!
Просторные и светлые квартиры в лучших районах столицы ждут вас.
Отличная инфраструктура, развитый транспорт и близость к культуре делают жизнь здесь уникальной.
Инвестируйте в ваше будущее – выберите квартиру
мечты уже сегодня!
Информация о доме по адресу г. Москва,
ул. Москворечье, Дом 49
Готовы к незабываемым эмоциям? Добро пожаловать в 1GO Casino – лучшее место, где представлены популярные игры от лидеров игровой индустрии. Станьте частью клуба уже сегодня и ловите акции для максимального удовольствия. https://1go-level.buzz/registration_bonus и откройте для себя мир 1GO Casino!
Почему стоит выбрать именно нас?
Коллекция лучших слотов – классические и современные игры от известных разработчиков.
Привлекательные предложения – бонусы на депозит, фриспины доступны новым и постоянным пользователям.
Моментальные транзакции – выплаты без задержек.
Простая навигация – доступность на всех устройствах.
Круглосуточная поддержка – готовность ответить в любое время.
Испытайте азарт по-настоящему и выигрывайте с комфортом!
Ahaa, its good discussion concerning this paragraph here at this blog, I have read all that, so
at this time me also commenting at this place.
Хотите испытать настоящий азарт?
Добро пожаловать в Jetton Casino – современное казино,
где представлен лучший выбор игр.
Джеттон играть онлайн и откройте для себя новый уровень
азарта!
Что делает нас лучшими?
Разнообразие игр – эксклюзивные новинки
казино.
Промо-предложения – регулярные турниры
с крупными призами.
Мгновенные выплаты – поддержка криптовалют и электронных кошельков.
Доступность на всех устройствах – играйте с ПК, смартфона или планшета.
Круглосуточная поддержка –
быстрое решение любых вопросов.
Присоединяйтесь к Jetton Casino
и играйте с комфортом!
Terrific posts, Regards!
Right away I am ready to do my breakfast, once having my breakfast
coming yet again to read more news.
We’re a gaggle of volunteers and opening a brand new scheme in our community.
Your website provided us with useful info to work on. You’ve performed a formidable activity and our whole group will
likely be grateful to you.
Yes! Finally something about esta.
10 Things That Your Family Teach You About Tiktok.Pornstars Tiktok.Pornstars
Thứ hai, ASIA luôn cập nhật và cung cấp những trò chơi mới nhất và hấp dẫn nhất cho người chơi.
At this time it looks like Drupal is the top blogging platform available right now.
(from what I’ve read) Is that what you are using on your blog?
Способ http://ltrim.ru/ довольно много, начиная от бесплатной регистрации в каталогах и заканчивая покупками многих тысяч ссылок на специализированных биржах. Ну а теперь давайте посмотрим все способы в отдельности.
Самое легкое это «регистрация в каталогах«. На сегодняшний день есть большое количество каталогов от 5000 до 15000 тыс.
Howdy, i read your blog occasionally and i own a
similar one and i was just wondering if you get a lot
of spam comments? If so how do you protect against it, any plugin or
anything you can suggest? I get so much lately it’s driving me insane so any help is very much appreciated.
Анлим Казино предлагает всем любителям азартных игр возможность познать истинное удовольствие от азартных игр.
Здесь вы найдете множество слотов,
настольных игр, а также непрерывно проводимые турниры,
что дает шанс игрокам увеличить свои шансы
на выигрыш и добавляет массу удовольствия от процесса.
Анлим Казино – это не просто место для игры, но и удобство для всех пользователей, независимо от того,
играете ли вы с мобильного устройства или
с компьютера. Мы гарантируем ежедневное расширение
ассортимента игр и проведение увлекательных турнирных состязаний.
В чем преимущество игры в Анлим Казино?
Быстрая регистрация — всего пару шагов, и вы
уже готовы начать играть.
Большие бонусы для новичков — мы дарим бонусы на первый депозит для старта с большими шансами на победу.
Ежедневные акции и турниры
— для каждого, кто хочет повысить свои шансы на
победу и дополнительные призы.
Круглосуточная поддержка всегда готова помочь с любыми вопросами о процессе
игры.
Богатый выбор игр доступных как на компьютере, так и на мобильных устройствах.
Присоединяйтесь к нам уже сегодня!
В Анлим Казино вас ждут яркие эмоции и шанс выиграть внушительные
призы. Готовы к победам? https://unlim-casinomirage.yachts/
Converter imagens diretamente no seu dispositivo móvel usando nosso Android Image Converter or
iOS Image Converter.
Hello! In case you’re on the hunt for a fantastic gambling experience, I highly recommend
this incredible online casino!
It offers a huge selection of entertainment options, including video slots, blackjack, and
interactive tables. Even if you’re new to online gaming, there’s a game that
suits your style.
What makes this casino stand out is its fantastic welcome
offers. Get started with a lucrative signup package, and regular users will love cashback rewards.
On top of that, this platform is fully secure, providing hassle-free
withdrawals. Their customer support is top-notch whenever
you need it.
Don’t miss out! Join today and start winning big!
Visit the website and see what’s in store now!
Videos will be downloaded and converted into MP3 or MP4 formats and HD
or even full HD resolution.
KeepVid bao gồm các tài nguyên giáo dục như Lynda,
một số nguồn tin tức như ABC và NBC, và nhiều trang web giải trí
nổi tiếng như Ebaumsworld và Break.
Хотите испытать настоящий азарт? Добро пожаловать в Jetton Casino – премиальное казино, где каждый игрок может найти широкий каталог слотов. https://jetton-arena.top/ и начните выигрывать прямо сейчас!
В чем наши преимущества?
Лучшие игровые автоматы – слоты, рулетка, покер, блэкджек.
Выгодные акции – бонусы на первый депозит, фриспины, кешбэк.
Безопасные транзакции – вывод средств без скрытых комиссий.
Интуитивный интерфейс – адаптивный дизайн без ограничений.
Помощь в любое время – быстрое решение любых вопросов.
Погрузитесь в мир премиального гемблинга и получите максимум удовольствия!
Read this fantastic post on how to play smart
at online casinos! You’ll discover ways to reduce losses while enjoying
your favorite games on casino sites.
Hoping to increase your chances? This resource provides tips to improve your gameplay and boost your winnings.
Improve your casino experience now! Check it out now!
Everything is very open with a really clear description of the issues.
It was really informative. Your site is useful. Many
thanks for sharing!
Приветствуем вас на нашем веб-сайте!
Здесь вы найдёте всё необходимое для успешного управления своими финансами.
Мы предлагаем широкий спектр финансовых продуктов, которые помогут вам достичь ваших целей и обеспечить стабильность в будущем.
В нашем ассортименте представлены различные виды банковских продуктов,
инвестиции, страхование, кредиты и многое другое.
Мы постоянно обновляем нашу
базу данных, чтобы вы всегда были
в курсе последних тенденций и инноваций на финансовом рынке.
Наши специалисты помогут вам выбрать наиболее подходящий продукт, учитывая ваши индивидуальные потребности и предпочтения.
Мы предоставляем консультации и рекомендации,
чтобы вы могли принять обоснованное решение и избежать возможных рисков.
Не упустите возможность воспользоваться нашими услугами и откройте для себя мир
финансовых возможностей! Заходите на наш сайт, ознакомьтесь с каталогом продуктов и начните свой путь к финансовой стабильности
прямо сейчас!
Кредит Европа Банк – Карта
Рассрочки в Саранске
Hey! This post could not be written any better! Reading through this post
reminds me of my old room mate! He always kept talking about this.
I will forward this article to him. Pretty sure he will have a good read.
Thanks for sharing!
It’s an remarkable article in favor of all the web viewers; they will get advantage from
it I am sure.
Unquestionably consider that which you stated. Your favorite justification appeared to be on the internet the simplest factor to
be mindful of. I say to you, I certainly get irked whilst other
folks consider concerns that they just do not realize about.
You controlled to hit the nail upon the top and
defined out the entire thing without having side-effects ,
other folks can take a signal. Will likely be again to get more.
Thanks
Way cool! Some very valid points! I appreciate you penning this write-up plus the rest of the site is also really good.
Why visitors still use to read news papers when in this technological
globe all is existing on web?
You ought to take part in a contest for one of
the highest quality websites on the web. I will recommend this
website!
Pretty component to content. I simply stumbled upon your web site and
in accession capital to say that I get actually enjoyed account your blog posts.
Anyway I’ll be subscribing to your feeds and even I achievement you access consistently fast.
Awesome website you have here but I was wanting to know if you knew of
any discussion boards that cover the same topics talked about
in this article? I’d really like to be a part of group where I can get comments from other experienced individuals that share the same interest.
If you have any suggestions, please let me
know. Thanks!
Another sweltering night here, the kind where the air itself feels like it’s placing bets against you.
I found myself logged into sportsbook again. It’s usually my evening
ritual when the heat finally backs off a little.
Honestly, lately, the wins have been few and far between. My
balance is looking thinner than my patience, and I’m starting to sweat more about
the wife finding out than the actual games. She’s been giving me that look, you know?
My so-called ‘buddy’ – the one who’s always sticking close, practically breathing
down my neck – he’s always on here too. And the infuriating thing?
He’s constantly hitting it big. Slots like slot_game_1 and slot_game_2, even that crazy aviator_game where the plane leaves you empty-handed.
He even brags about his wins on slot_game_3 and slot_game_4.
It’s like this place is playing favorites.
Makes you wonder, doesn’t it? Especially with the way he looks
at my wife when she’s not looking. Makes a man suspicious,
this heat does.
Despite all that, and maybe it’s just stubbornness, I still find myself drawn to favorite_slot_game.
There’s something about those sugary treats that keeps me clicking,
even when the numbers aren’t falling my way.
Maybe tonight will be different. Maybe the luck gods will finally throw me a bone.
Or maybe my wife will just throw me out. Either way, here I am, spinning again at casino.
Pros:
Available 24/7 (perfect for my nocturnal habits)
Wide variety of games (even if some seem to favor certain people)
They do have favorite_slot_game, which I genuinely
enjoy
Cons:
My personal luck here has been incredibly bad
Seeing him win constantly is incredibly frustrating
Starting to seriously impact my household money and relationships
Overall: Torn. It’s a handy option to pass the sweltering nights,
but my recent experiences and observations are making me seriously question if it’s worth
the risk. Especially with everything else going
on.
Another blistering night here, the kind where the air
itself feels like it’s placing bets against you. I found myself
logged into casino again. It’s usually my evening ritual when the heat finally backs
off a little.
Honestly, lately, the wins have been rarer than a cool breeze in the daytime.
My balance is looking precariously small, and I’m starting
to sweat more about the wife finding out than the actual games.
She’s been giving me that look, you know?
My so-called ‘friend” – the one who’s always lurking around, practically breathing down my neck – he’s always
on here too. And the infuriating thing? He’s constantly on a lucky streak.
Slots like slot_game_1 and slot_game_2, even that crazy aviator_game where
the plane flies off with all your hopes. He even brags about his wins on slot_game_3 and slot_game_4.
It’s like this place is has a soft spot for him.
Makes you wonder, doesn’t it? Especially
with the way he looks at my wife when she’s not looking.
Makes a man uneasy, this heat does.
Despite all that, and maybe it’s just stubbornness, I still find myself drawn to favorite_slot_game.
There’s something about those colorful candies that keeps me clicking, even when the numbers aren’t falling my way.
Maybe tonight will be different. Maybe the desert gods will finally throw me a bone.
Or maybe my wife will just throw me out. Either way, here
I am, spinning again at sportsbook.
Pros:
Available 24/7 (perfect for my nocturnal habits)
Wide variety of games (even if some seem to favor certain people)
They do have favorite_slot_game, which I genuinely enjoy
Cons:
My personal luck here has been terrible lately
Seeing him win constantly is incredibly frustrating
Starting to seriously impact my finances at home and relationships
Overall: Divided. It’s a convenient way to pass the hot evenings, but my recent experiences and observations are making me seriously
question if it’s worth the risk. Especially with everything else going on.
Undeniably imagine that which you stated. Your favorite reason seemed to be at the internet the easiest thing
to understand of. I say to you, I definitely get annoyed while people consider concerns that they plainly do not recognize about.
You controlled to hit the nail upon the highest and also
defined out the entire thing with no need side
effect , folks could take a signal. Will probably be again to
get more. Thanks
Thanks for sharing your thoughts about travel. Regards
Champion Slots Казино — это ваш ключ к миру азарта и удачи. У нас представлены любимые игры всех поколений, а также эксклюзивные новинки. Любой посетитель может найти здесь игру по душе и погрузиться в игровой процесс на высшем уровне.
Почему выбирают нас? Мы сочетаем классические игры с новыми технологиями, чтобы ваш игровой опыт был уникальным. К вашим услугам разнообразие игр на любой вкус. А щедрые бонусы и турниры увеличивают ваши шансы на успех, https://championslots-winpulse.autos/.
Как выбрать идеальное время для игры? Не откладывайте! Ваш успех уже ждет вас.
Мы рекомендуем изучить наши условия и требования, чтобы гарантировать себе честную и комфортную игру.
Присоединяйтесь к программе для VIP-игроков, чтобы получить доступ к особым привилегиям и играть на совершенно новом уровне.
Если вы только начинаете или давно не играли, демо-версии игр — это идеальный способ освежить навыки без риска.
Another blistering night here, the kind where
the air itself feels like it’s weighing you down. I found myself logged into casino again. It’s usually my after-dark refuge when the heat
finally backs off a little.
Honestly, lately, the wins have been like finding water in the
desert. My balance is looking precariously small, and I’m
starting to sweat more about the wife finding out than the actual games.
She’s been giving me that look, you know?
My so-called ‘friend” – the one who’s always sticking close, practically breathing down my neck – he’s always on here too.
And the infuriating thing? He’s constantly hitting it
big. Slots like slot_game_1 and slot_game_2, even that crazy aviator_game where the plane
takes your money and runs. He even brags about his wins on slot_game_3 and slot_game_4.
It’s like this place is rigged in his favor. Makes you wonder,
doesn’t it? Especially with the way he looks at my wife when she’s not looking.
Makes a man paranoid, this heat does.
Despite all that, and maybe it’s just addiction, I still find myself drawn to favorite_slot_game.
There’s something about those colorful candies that keeps me clicking, even when the numbers aren’t falling my way.
Maybe tonight will be different. Maybe the gaming spirits
will finally throw me a bone. Or maybe my wife will just throw me out.
Either way, here I am, spinning again at sportsbook.
Pros:
Available 24/7 (perfect for my nocturnal habits)
Wide variety of games (even if some seem to favor certain people)
They do have favorite_slot_game, which I genuinely enjoy
Cons:
My personal luck here has been incredibly bad
Seeing him win constantly is incredibly frustrating
Starting to seriously impact my finances at home and relationships
Overall: Undecided. It’s a handy option to pass the sweltering nights, but my recent
experiences and observations are making me seriously question if it’s worth the risk.
Especially with everything else going on.
Another scorching night here, the kind where the air itself
feels like it’s placing bets against you. I found myself logged into sportsbook
again. It’s usually my nighttime escape when the heat
finally subsides.
Honestly, lately, the wins have been rarer than a cool
breeze in the daytime. My balance is looking thinner than my patience, and I’m starting to sweat more
about the wife finding out than the actual games. She’s been giving me that
look, you know?
My so-called ‘mate’ – the one who’s always lurking around,
practically looking over my shoulder – he’s always
on here too. And the infuriating thing? He’s constantly hitting
it big. Slots like slot_game_1 and slot_game_2,
even that crazy aviator_game where the plane leaves you empty-handed.
He even brags about his wins on slot_game_3 and slot_game_4.
It’s like this place is rigged in his favor.
Makes you wonder, doesn’t it? Especially with the way he looks at my
wife when she’s not looking. Makes a man uneasy,
this heat does.
Despite all that, and maybe it’s just addiction, I
still find myself drawn to favorite_slot_game.
There’s something about those colorful candies that keeps me clicking, even when the numbers aren’t falling my way.
Maybe tonight will be different. Maybe the luck gods will finally throw me a bone.
Or maybe my wife will just throw me out. Either
way, here I am, spinning again at casino.
Pros:
Available 24/7 (perfect for my nocturnal habits)
Wide variety of games (even if some seem to
favor certain people)
They do have favorite_slot_game, which I genuinely enjoy
Cons:
My personal luck here has been awful recently
Seeing him win constantly is maddening
Starting to seriously impact my household money and relationships
Overall: Torn. It’s a handy option to pass
the hot evenings, but my recent experiences and observations are making me
seriously question if it’s worth the risk.
Especially with everything else going on.
Another blistering night here, the kind where the air itself feels like it’s placing bets against you.
I found myself logged into casino again. It’s usually my after-dark refuge
when the heat finally relents.
Honestly, lately, the wins have been few and far between. My balance is looking precariously small, and I’m starting to sweat more about the wife finding out than the
actual games. She’s been giving me that look, you know?
My so-called ‘mate’ – the one who’s always lurking around, practically breathing down my neck
– he’s always on here too. And the infuriating thing?
He’s constantly on a lucky streak. Slots like slot_game_1 and slot_game_2,
even that crazy aviator_game where the plane leaves you empty-handed.
He even brags about his wins on slot_game_3 and slot_game_4.
It’s like this place is rigged in his favor. Makes you wonder, doesn’t it?
Especially with the way he looks at my wife when she’s not looking.
Makes a man paranoid, this heat does.
Despite all that, and maybe it’s just addiction, I still find myself drawn to favorite_slot_game.
There’s something about those sugary treats that keeps me clicking, even when the numbers aren’t falling my way.
Maybe tonight will be different. Maybe the luck gods will finally throw me a bone.
Or maybe my wife will just throw me out. Either way, here
I am, spinning again at casino.
Pros:
Available 24/7 (perfect for my late-night sessions)
Wide variety of games (even if some seem to favor certain people)
They do have favorite_slot_game, which I genuinely enjoy
Cons:
My personal luck here has been awful recently
Seeing him win constantly is maddening
Starting to seriously impact my household money and
relationships
Overall: Torn. It’s a handy option to pass the hot evenings, but my
recent experiences and observations are making me seriously
question if it’s worth the risk. Especially with everything else going on.
Another blistering night here, the kind where the air itself feels like it’s weighing you down. I found myself logged into sportsbook again. It’s usually my after-dark refuge
when the heat finally backs off a little.
Honestly, lately, the wins have been like finding water
in the desert. My balance is looking thinner than my patience, and I’m starting to sweat more about the wife finding out than the actual games.
She’s been giving me that look, you know?
My so-called ‘buddy’ – the one who’s always hanging about, practically
shadowing me – he’s always on here too. And the infuriating thing?
He’s constantly winning big. Slots like slot_game_1 and slot_game_2, even that crazy aviator_game
where the plane leaves you empty-handed. He even brags about his wins
on slot_game_3 and slot_game_4.
It’s like this place is rigged in his favor. Makes you wonder, doesn’t it?
Especially with the way he looks at my wife when she’s not looking.
Makes a man uneasy, this heat does.
Despite all that, and maybe it’s just foolish hope, I
still find myself drawn to favorite_slot_game. There’s something about those
sweet symbols that keeps me clicking, even when the numbers aren’t falling
my way.
Maybe tonight will be different. Maybe the gaming spirits will finally throw me
a bone. Or maybe my wife will just throw me out.
Either way, here I am, spinning again at sportsbook.
Pros:
Available 24/7 (perfect for my nocturnal habits)
Wide variety of games (even if some seem to favor certain people)
They do have favorite_slot_game, which I
genuinely enjoy
Cons:
My personal luck here has been awful recently
Seeing him win constantly is maddening
Starting to seriously impact my finances at home and relationships
Overall: Divided. It’s a handy option to pass the sweltering nights, but my recent experiences and observations are making me seriously question if it’s worth
the risk. Especially with everything else going on.
Another blistering night here, the kind where the air itself feels like it’s weighing you down. I found myself logged into casino
again. It’s usually my evening ritual when the heat finally relents.
Honestly, lately, the wins have been few and far between.
My balance is looking dangerously low, and I’m starting to sweat more about the wife finding out than the actual games.
She’s been giving me that look, you know?
My so-called ‘friend” – the one who’s always sticking close, practically breathing
down my neck – he’s always on here too. And the infuriating thing?
He’s constantly on a lucky streak. Slots like slot_game_1 and slot_game_2,
even that crazy aviator_game where the plane leaves you
empty-handed. He even brags about his wins on slot_game_3 and slot_game_4.
It’s like this place is has a soft spot for him. Makes you
wonder, doesn’t it? Especially with the way he looks at my wife when she’s not looking.
Makes a man suspicious, this heat does.
Despite all that, and maybe it’s just addiction, I still find myself drawn to favorite_slot_game.
There’s something about those sugary treats
that keeps me clicking, even when the numbers aren’t falling my way.
Maybe tonight will be different. Maybe the gaming spirits will
finally throw me a bone. Or maybe my wife will just throw me out.
Either way, here I am, spinning again at casino.
Pros:
Available 24/7 (perfect for my night owl tendencies)
Wide variety of games (even if some seem to favor certain people)
They do have favorite_slot_game, which I genuinely enjoy
Cons:
My personal luck here has been incredibly bad
Seeing him win constantly is enough to make you quit
Starting to seriously impact my real-life budget and relationships
Overall: Divided. It’s a handy option to pass the sweltering nights, but my
recent experiences and observations are making me seriously question if it’s worth the
risk. Especially with everything else going
on.
Another blistering night here, the kind where the air itself feels like it’s placing bets against you.
I found myself logged into sportsbook again. It’s usually my after-dark refuge when the heat finally backs off a
little.
Honestly, lately, the wins have been rarer than a cool breeze in the daytime.
My balance is looking thinner than my patience, and I’m starting
to sweat more about the wife finding out than the actual games.
She’s been giving me that look, you know?
My so-called ‘buddy’ – the one who’s always hanging about, practically shadowing
me – he’s always on here too. And the infuriating thing?
He’s constantly hitting it big. Slots like slot_game_1 and slot_game_2, even that crazy aviator_game
where the plane flies off with all your hopes. He even brags
about his wins on slot_game_3 and slot_game_4.
It’s like this place is rigged in his favor. Makes you
wonder, doesn’t it? Especially with the way he looks at my wife when she’s
not looking. Makes a man paranoid, this heat does.
Despite all that, and maybe it’s just addiction, I still
find myself drawn to favorite_slot_game. There’s something about those colorful candies
that keeps me clicking, even when the numbers aren’t falling my way.
Maybe tonight will be different. Maybe the desert gods will
finally throw me a bone. Or maybe my wife will just throw
me out. Either way, here I am, spinning again at sportsbook.
Pros:
Available 24/7 (perfect for my night owl tendencies)
Wide variety of games (even if some seem to favor certain people)
They do have favorite_slot_game, which I genuinely enjoy
Cons:
My personal luck here has been terrible lately
Seeing him win constantly is maddening
Starting to seriously impact my household money and
relationships
Overall: Undecided. It’s a convenient way to pass the long,
heated hours, but my recent experiences and observations are making
me seriously question if it’s worth the risk. Especially with everything else going on.
Another blistering night here, the kind where the air itself feels like it’s placing bets against you.
I found myself logged into casino again. It’s usually my after-dark refuge when the
heat finally subsides.
Honestly, lately, the wins have been rarer than a cool breeze in the daytime.
My balance is looking precariously small, and I’m starting to sweat more about the
wife finding out than the actual games. She’s been giving me that look, you
know?
My so-called ‘buddy’ – the one who’s always hanging about, practically shadowing me –
he’s always on here too. And the infuriating thing? He’s constantly hitting it big.
Slots like slot_game_1 and slot_game_2, even that crazy
aviator_game where the plane takes your money and runs.
He even brags about his wins on slot_game_3 and slot_game_4.
It’s like this place is playing favorites. Makes you wonder, doesn’t it?
Especially with the way he looks at my wife when she’s not looking.
Makes a man paranoid, this heat does.
Despite all that, and maybe it’s just stubbornness, I
still find myself drawn to favorite_slot_game.
There’s something about those colorful candies that keeps me clicking, even when the numbers aren’t falling my way.
Maybe tonight will be different. Maybe the luck gods will finally throw me
a bone. Or maybe my wife will just throw me out. Either way,
here I am, spinning again at sportsbook.
Pros:
Available 24/7 (perfect for my night owl tendencies)
Wide variety of games (even if some seem to favor certain people)
They do have favorite_slot_game, which I genuinely enjoy
Cons:
My personal luck here has been incredibly bad
Seeing him win constantly is incredibly frustrating
Starting to seriously impact my household money and relationships
Overall: Torn. It’s a handy option to pass the
long, heated hours, but my recent experiences and observations are
making me seriously question if it’s worth the risk.
Especially with everything else going on.
Another blistering night here, the kind where the air itself feels like
it’s placing bets against you. I found myself logged into sportsbook again. It’s usually my nighttime escape when the heat finally
subsides.
Honestly, lately, the wins have been few and far between. My balance is looking precariously small, and
I’m starting to sweat more about the wife finding out than the actual games.
She’s been giving me that look, you know?
My so-called ‘buddy’ – the one who’s always hanging about, practically breathing down my neck –
he’s always on here too. And the infuriating thing?
He’s constantly hitting it big. Slots like slot_game_1 and slot_game_2, even that crazy aviator_game where the plane flies off with all
your hopes. He even brags about his wins on slot_game_3 and slot_game_4.
It’s like this place is has a soft spot for him. Makes you wonder,
doesn’t it? Especially with the way he looks at my wife when she’s not looking.
Makes a man uneasy, this heat does.
Despite all that, and maybe it’s just stubbornness, I still find myself drawn to favorite_slot_game.
There’s something about those sweet symbols that keeps
me clicking, even when the numbers aren’t falling my way.
Maybe tonight will be different. Maybe the gaming spirits will finally throw me a bone.
Or maybe my wife will just throw me out. Either way, here I am, spinning again at sportsbook.
Pros:
Available 24/7 (perfect for my nocturnal habits)
Wide variety of games (even if some seem to favor certain people)
They do have favorite_slot_game, which I genuinely enjoy
Cons:
My personal luck here has been awful recently
Seeing him win constantly is enough to make you quit
Starting to seriously impact my household money and relationships
Overall: Undecided. It’s a handy option to pass the sweltering nights, but my recent experiences and observations are making
me seriously question if it’s worth the risk.
Especially with everything else going on.
Very nice post.I simply stumbled upon your blog
and wanted to say that I have really enjoyed browsing your blog posts.
In any csse I will be subscribing to your rss feed and I hope you write
again soon!
Another scorching night here, the kind where the
air itself feels like it’s suffocating you. I found myself logged into sportsbook
again. It’s usually my evening ritual when the heat finally subsides.
Honestly, lately, the wins have been few and far between. My balance is
looking thinner than my patience, and I’m starting to sweat
more about the wife finding out than the actual games. She’s been giving me that look, you know?
My so-called ‘friend” – the one who’s always lurking around,
practically shadowing me – he’s always on here too. And the infuriating thing?
He’s constantly winning big. Slots like slot_game_1 and slot_game_2,
even that crazy aviator_game where the plane takes your money and runs.
He even brags about his wins on slot_game_3 and slot_game_4.
It’s like this place is rigged in his favor.
Makes you wonder, doesn’t it? Especially with the way he looks at my wife
when she’s not looking. Makes a man suspicious, this heat does.
Despite all that, and maybe it’s just addiction, I still find myself drawn to favorite_slot_game.
There’s something about those colorful candies that keeps me clicking, even when the numbers aren’t falling
my way.
Maybe tonight will be different. Maybe the gaming spirits will finally throw me a bone.
Or maybe my wife will just throw me out. Either way, here I am, spinning again at casino.
Pros:
Available 24/7 (perfect for my late-night sessions)
Wide variety of games (even if some seem to favor certain people)
They do have favorite_slot_game, which I genuinely enjoy
Cons:
My personal luck here has been awful recently
Seeing him win constantly is incredibly frustrating
Starting to seriously impact my real-life budget and relationships
Overall: Undecided. It’s a convenient way to pass the hot evenings, but my recent experiences and observations
are making me seriously question if it’s worth the risk.
Especially with everything else going on.
Another scorching night here, the kind where the
air itself feels like it’s placing bets against you. I found myself logged into casino again. It’s usually my nighttime escape when the heat finally relents.
Honestly, lately, the wins have been like finding water in the
desert. My balance is looking precariously small, and I’m starting to sweat more about the wife
finding out than the actual games. She’s been giving me that
look, you know?
My so-called ‘mate’ – the one who’s always lurking around, practically
shadowing me – he’s always on here too. And the infuriating thing?
He’s constantly winning big. Slots like slot_game_1
and slot_game_2, even that crazy aviator_game where the plane takes your money and runs.
He even brags about his wins on slot_game_3 and slot_game_4.
It’s like this place is playing favorites.
Makes you wonder, doesn’t it? Especially with the way he looks at my wife when she’s not looking.
Makes a man paranoid, this heat does.
Despite all that, and maybe it’s just addiction, I still find myself drawn to favorite_slot_game.
There’s something about those sweet symbols that keeps me clicking, even when the numbers
aren’t falling my way.
Maybe tonight will be different. Maybe the luck gods will
finally throw me a bone. Or maybe my wife will just
throw me out. Either way, here I am, spinning again at casino.
Pros:
Available 24/7 (perfect for my nocturnal habits)
Wide variety of games (even if some seem to favor certain people)
They do have favorite_slot_game, which I genuinely enjoy
Cons:
My personal luck here has been terrible lately
Seeing him win constantly is incredibly frustrating
Starting to seriously impact my real-life budget and relationships
Overall: Torn. It’s a handy option to pass the sweltering nights, but my recent
experiences and observations are making
me seriously question if it’s worth the risk. Especially with everything else going on.
Тимерхан организация, которая занимается приемом и утилизацией металлических
отходов. Так же вы можете узнать
прием металла в казани цена актуальные цены.
Мы работаем с физическими и юридическими лицами, принимаем металлолом всех видов и гарантируем
быструю и точную оценку стоимости.
При больших объемах металлолома мы вывезем его бесплатно.
Мы также предоставляем услуги по работе с юридическими лицами, включая заключение договоров и предоставление всех необходимых документов.
Обращаясь к нам, вы не только избавляетесь от металлического мусора,
но и помогаете сохранить окружающую
среду, отправляя отходы на переработку и уменьшая выбросы углекислого газа.
Another scorching night here, the kind where the air itself feels like it’s weighing you down. I found myself logged into sportsbook again.
It’s usually my after-dark refuge when the heat finally relents.
Honestly, lately, the wins have been like finding water in the desert.
My balance is looking precariously small, and I’m starting to
sweat more about the wife finding out than the actual
games. She’s been giving me that look, you know?
My so-called ‘friend” – the one who’s always sticking close, practically
looking over my shoulder – he’s always on here too.
And the infuriating thing? He’s constantly on a lucky streak.
Slots like slot_game_1 and slot_game_2, even that crazy aviator_game where the plane leaves you empty-handed.
He even brags about his wins on slot_game_3 and slot_game_4.
It’s like this place is has a soft spot for
him. Makes you wonder, doesn’t it? Especially with the way he looks at my wife when she’s not looking.
Makes a man uneasy, this heat does.
Despite all that, and maybe it’s just foolish hope, I still find myself drawn to favorite_slot_game.
There’s something about those sugary treats that keeps me clicking,
even when the numbers aren’t falling my way.
Maybe tonight will be different. Maybe the desert gods will finally throw me a bone.
Or maybe my wife will just throw me out. Either way,
here I am, spinning again at sportsbook.
Pros:
Available 24/7 (perfect for my nocturnal habits)
Wide variety of games (even if some seem to favor certain people)
They do have favorite_slot_game, which I genuinely enjoy
Cons:
My personal luck here has been awful recently
Seeing him win constantly is maddening
Starting to seriously impact my real-life budget and relationships
Overall: Torn. It’s a convenient way to pass the sweltering nights, but my recent experiences and observations are making me seriously question if
it’s worth the risk. Especially with everything else going on.
Another blistering night here, the kind where the air itself feels like it’s weighing
you down. I found myself logged into sportsbook again. It’s usually my nighttime escape when the heat finally subsides.
Honestly, lately, the wins have been like finding
water in the desert. My balance is looking precariously
small, and I’m starting to sweat more about the wife finding out than the actual games.
She’s been giving me that look, you know?
My so-called ‘friend” – the one who’s always lurking around,
practically shadowing me – he’s always on here too. And the infuriating thing?
He’s constantly winning big. Slots like slot_game_1 and slot_game_2, even that crazy aviator_game where the plane flies off with all
your hopes. He even brags about his wins on slot_game_3 and
slot_game_4.
It’s like this place is has a soft spot for him.
Makes you wonder, doesn’t it? Especially with
the way he looks at my wife when she’s not looking.
Makes a man suspicious, this heat does.
Despite all that, and maybe it’s just stubbornness, I
still find myself drawn to favorite_slot_game. There’s
something about those sugary treats that keeps me clicking,
even when the numbers aren’t falling my way.
Maybe tonight will be different. Maybe the desert gods will finally
throw me a bone. Or maybe my wife will just throw me out.
Either way, here I am, spinning again at casino.
Pros:
Available 24/7 (perfect for my night owl tendencies)
Wide variety of games (even if some seem to favor certain people)
They do have favorite_slot_game, which I genuinely enjoy
Cons:
My personal luck here has been awful recently
Seeing him win constantly is incredibly frustrating
Starting to seriously impact my real-life budget and relationships
Overall: Divided. It’s a handy option to pass the hot evenings,
but my recent experiences and observations are making me seriously question if it’s worth the risk.
Especially with everything else going on.
Another scorching night here, the kind where the air
itself feels like it’s suffocating you.
I found myself logged into casino again. It’s usually my after-dark refuge when the heat finally subsides.
Honestly, lately, the wins have been few and far between. My
balance is looking thinner than my patience, and I’m starting to sweat more about the wife finding out than the actual
games. She’s been giving me that look, you know?
My so-called ‘mate’ – the one who’s always hanging about, practically looking over
my shoulder – he’s always on here too. And the infuriating thing?
He’s constantly hitting it big. Slots like slot_game_1 and slot_game_2, even that crazy aviator_game where the plane takes your money and runs.
He even brags about his wins on slot_game_3 and
slot_game_4.
It’s like this place is playing favorites.
Makes you wonder, doesn’t it? Especially with the way he looks at
my wife when she’s not looking. Makes a man uneasy, this heat does.
Despite all that, and maybe it’s just addiction, I still find myself drawn to favorite_slot_game.
There’s something about those sweet symbols that keeps me clicking, even when the numbers aren’t falling my way.
Maybe tonight will be different. Maybe the desert gods will finally throw me a bone.
Or maybe my wife will just throw me out. Either way,
here I am, spinning again at sportsbook.
Pros:
Available 24/7 (perfect for my nocturnal habits)
Wide variety of games (even if some seem to favor certain people)
They do have favorite_slot_game, which I genuinely enjoy
Cons:
My personal luck here has been awful recently
Seeing him win constantly is incredibly frustrating
Starting to seriously impact my household money and relationships
Overall: Divided. It’s a handy option to pass the long,
heated hours, but my recent experiences and observations are making me seriously question if
it’s worth the risk. Especially with everything else going on.
Greetings! Very helpful advice within this post!
It is the little changes that produce the biggest changes.
Thanks for sharing!
Hi there, just became alert to your blog through Google, and found that it’s really informative.
I’m gonna watch out for brussels. I will be grateful if you continue this in future.
A lot of people will be benefited from your writing.
Cheers!
Another blistering night here, the kind where the air itself feels like it’s
placing bets against you. I found myself logged into casino again.
It’s usually my nighttime escape when the heat finally
relents.
Honestly, lately, the wins have been rarer than a cool breeze
in the daytime. My balance is looking dangerously low, and I’m starting to
sweat more about the wife finding out than the actual games.
She’s been giving me that look, you know?
My so-called ‘mate’ – the one who’s always sticking close,
practically looking over my shoulder – he’s always on here too.
And the infuriating thing? He’s constantly hitting it big.
Slots like slot_game_1 and slot_game_2, even that crazy aviator_game where the plane takes
your money and runs. He even brags about his
wins on slot_game_3 and slot_game_4.
It’s like this place is has a soft spot for him.
Makes you wonder, doesn’t it? Especially with the way he
looks at my wife when she’s not looking. Makes a man suspicious, this heat does.
Despite all that, and maybe it’s just addiction, I still find myself drawn to favorite_slot_game.
There’s something about those sweet symbols that keeps me
clicking, even when the numbers aren’t falling my way.
Maybe tonight will be different. Maybe the luck gods will finally throw me
a bone. Or maybe my wife will just throw me out. Either way, here I
am, spinning again at casino.
Pros:
Available 24/7 (perfect for my nocturnal habits)
Wide variety of games (even if some seem to favor certain people)
They do have favorite_slot_game, which I genuinely enjoy
Cons:
My personal luck here has been awful recently
Seeing him win constantly is incredibly frustrating
Starting to seriously impact my real-life budget and relationships
Overall: Torn. It’s a simple method to pass the sweltering nights,
but my recent experiences and observations are making me seriously
question if it’s worth the risk. Especially with everything else going on.
This blog was… how do I say it? Relevant!! Finally I have found something which helped me.
Cheers!
Another sweltering night here, the kind where the air itself feels like it’s weighing you down.
I found myself logged into sportsbook again. It’s usually my nighttime escape when the heat finally relents.
Honestly, lately, the wins have been few and far between. My balance is looking precariously small,
and I’m starting to sweat more about the wife finding out than the actual games.
She’s been giving me that look, you know?
My so-called ‘friend” – the one who’s always hanging about, practically
looking over my shoulder – he’s always on here too.
And the infuriating thing? He’s constantly winning big.
Slots like slot_game_1 and slot_game_2, even that crazy aviator_game where the plane
flies off with all your hopes. He even brags about his wins on slot_game_3 and slot_game_4.
It’s like this place is playing favorites. Makes you wonder,
doesn’t it? Especially with the way he looks at my wife when she’s not looking.
Makes a man uneasy, this heat does.
Despite all that, and maybe it’s just addiction, I
still find myself drawn to favorite_slot_game. There’s something
about those sweet symbols that keeps me clicking, even when the numbers
aren’t falling my way.
Maybe tonight will be different. Maybe the gaming spirits will finally throw me a bone.
Or maybe my wife will just throw me out. Either way, here I am, spinning again at sportsbook.
Pros:
Available 24/7 (perfect for my nocturnal habits)
Wide variety of games (even if some seem to favor
certain people)
They do have favorite_slot_game, which I genuinely enjoy
Cons:
My personal luck here has been awful recently
Seeing him win constantly is maddening
Starting to seriously impact my household money and relationships
Overall: Torn. It’s a handy option to pass the long, heated hours, but my recent experiences and observations are making
me seriously question if it’s worth the risk. Especially with everything else going on.
Pretty great post. I simply stumbled upon your blog and wanted to say that I’ve really enjoyed surfing around your weblog posts.
After all I’ll be subscribing for your feed and I’m hoping you
write again very soon!
Another scorching night here, the kind where the air itself feels like it’s suffocating you.
I found myself logged into sportsbook again. It’s usually my after-dark refuge when the heat finally backs off a little.
Honestly, lately, the wins have been few and far
between. My balance is looking thinner than my patience, and
I’m starting to sweat more about the wife finding
out than the actual games. She’s been giving me that look, you know?
My so-called ‘friend” – the one who’s always sticking close,
practically looking over my shoulder – he’s always on here too.
And the infuriating thing? He’s constantly hitting it big.
Slots like slot_game_1 and slot_game_2, even that crazy aviator_game where the plane flies off with all your hopes.
He even brags about his wins on slot_game_3 and
slot_game_4.
It’s like this place is has a soft spot for him.
Makes you wonder, doesn’t it? Especially with the way he looks
at my wife when she’s not looking. Makes a man uneasy, this heat does.
Despite all that, and maybe it’s just foolish hope, I still find myself drawn to favorite_slot_game.
There’s something about those colorful candies that keeps me clicking, even when the numbers aren’t falling my way.
Maybe tonight will be different. Maybe the desert gods will finally throw me a bone.
Or maybe my wife will just throw me out. Either way, here I am, spinning again at
sportsbook.
Pros:
Available 24/7 (perfect for my night owl tendencies)
Wide variety of games (even if some seem to favor certain people)
They do have favorite_slot_game, which I genuinely enjoy
Cons:
My personal luck here has been incredibly bad
Seeing him win constantly is maddening
Starting to seriously impact my household money and relationships
Overall: Torn. It’s a simple method to pass the
long, heated hours, but my recent experiences and observations are making me seriously question if it’s worth the risk.
Especially with everything else going on.
Another blistering night here, the kind where the air itself feels like it’s suffocating you.
I found myself logged into sportsbook again. It’s usually my
after-dark refuge when the heat finally relents.
Honestly, lately, the wins have been like finding water in the desert.
My balance is looking thinner than my patience, and I’m starting to sweat more about the wife
finding out than the actual games. She’s been giving me
that look, you know?
My so-called ‘mate’ – the one who’s always sticking close, practically shadowing me – he’s always
on here too. And the infuriating thing? He’s constantly hitting it big.
Slots like slot_game_1 and slot_game_2, even that
crazy aviator_game where the plane takes your money and runs.
He even brags about his wins on slot_game_3 and slot_game_4.
It’s like this place is has a soft spot for him.
Makes you wonder, doesn’t it? Especially with the way he looks at
my wife when she’s not looking. Makes a man paranoid,
this heat does.
Despite all that, and maybe it’s just addiction, I still find myself drawn to favorite_slot_game.
There’s something about those colorful candies that keeps me clicking,
even when the numbers aren’t falling my way.
Maybe tonight will be different. Maybe the luck gods will finally throw me a bone.
Or maybe my wife will just throw me out. Either way, here I am, spinning again at casino.
Pros:
Available 24/7 (perfect for my nocturnal habits)
Wide variety of games (even if some seem to favor certain people)
They do have favorite_slot_game, which I genuinely enjoy
Cons:
My personal luck here has been incredibly bad
Seeing him win constantly is maddening
Starting to seriously impact my household money and relationships
Overall: Undecided. It’s a simple method to pass the sweltering
nights, but my recent experiences and observations are making me seriously question if it’s worth the risk.
Especially with everything else going on.
Another scorching night here, the kind where the air itself feels like it’s suffocating you.
I found myself logged into casino again. It’s usually my after-dark refuge
when the heat finally relents.
Honestly, lately, the wins have been few and far between. My balance is looking dangerously low, and I’m starting
to sweat more about the wife finding out than the actual
games. She’s been giving me that look, you know?
My so-called ‘buddy’ – the one who’s always hanging about,
practically looking over my shoulder – he’s always on here too.
And the infuriating thing? He’s constantly winning big. Slots like slot_game_1 and slot_game_2,
even that crazy aviator_game where the plane leaves you empty-handed.
He even brags about his wins on slot_game_3 and slot_game_4.
It’s like this place is playing favorites. Makes you wonder, doesn’t it?
Especially with the way he looks at my wife when she’s not looking.
Makes a man paranoid, this heat does.
Despite all that, and maybe it’s just addiction, I still find myself drawn to favorite_slot_game.
There’s something about those sugary treats that keeps me clicking, even when the numbers aren’t falling my way.
Maybe tonight will be different. Maybe the gaming spirits will
finally throw me a bone. Or maybe my wife will just
throw me out. Either way, here I am, spinning again at casino.
Pros:
Available 24/7 (perfect for my nocturnal habits)
Wide variety of games (even if some seem to favor certain people)
They do have favorite_slot_game, which I genuinely enjoy
Cons:
My personal luck here has been terrible lately
Seeing him win constantly is enough to make you quit
Starting to seriously impact my household money and relationships
Overall: Divided. It’s a convenient way to pass the hot evenings, but my recent experiences and observations are making me seriously question if it’s worth the risk.
Especially with everything else going on.
Another blistering night here, the kind where the air itself feels like it’s weighing you down. I
found myself logged into casino again. It’s usually my nighttime escape when the heat finally subsides.
Honestly, lately, the wins have been like finding water
in the desert. My balance is looking dangerously low, and I’m starting to sweat more about the wife
finding out than the actual games. She’s been giving me
that look, you know?
My so-called ‘buddy’ – the one who’s always lurking around, practically shadowing me – he’s always on here too.
And the infuriating thing? He’s constantly on a lucky streak.
Slots like slot_game_1 and slot_game_2, even that crazy aviator_game where the plane leaves you empty-handed.
He even brags about his wins on slot_game_3 and slot_game_4.
It’s like this place is has a soft spot for him.
Makes you wonder, doesn’t it? Especially with the way he
looks at my wife when she’s not looking. Makes a man paranoid, this heat does.
Despite all that, and maybe it’s just stubbornness, I still find myself drawn to favorite_slot_game.
There’s something about those colorful candies
that keeps me clicking, even when the numbers aren’t falling my way.
Maybe tonight will be different. Maybe the luck gods will finally throw me a bone.
Or maybe my wife will just throw me out. Either way, here I am, spinning again at casino.
Pros:
Available 24/7 (perfect for my nocturnal habits)
Wide variety of games (even if some seem to favor certain people)
They do have favorite_slot_game, which I genuinely enjoy
Cons:
My personal luck here has been incredibly bad
Seeing him win constantly is maddening
Starting to seriously impact my real-life budget and relationships
Overall: Undecided. It’s a simple method to pass the hot evenings, but
my recent experiences and observations are making me seriously question if it’s worth the risk.
Especially with everything else going on.
Another blistering night here, the kind where the air
itself feels like it’s placing bets against you. I found myself logged into sportsbook again. It’s usually my evening ritual when the heat
finally backs off a little.
Honestly, lately, the wins have been few and far between. My balance is looking thinner than my patience, and I’m starting to sweat
more about the wife finding out than the actual games.
She’s been giving me that look, you know?
My so-called ‘friend” – the one who’s always lurking around,
practically looking over my shoulder – he’s always on here too.
And the infuriating thing? He’s constantly winning big.
Slots like slot_game_1 and slot_game_2, even that
crazy aviator_game where the plane flies off with all your hopes.
He even brags about his wins on slot_game_3 and slot_game_4.
It’s like this place is playing favorites. Makes you wonder, doesn’t it?
Especially with the way he looks at my wife when she’s not looking.
Makes a man paranoid, this heat does.
Despite all that, and maybe it’s just stubbornness, I still find
myself drawn to favorite_slot_game. There’s something about those sweet symbols that keeps me clicking, even when the numbers
aren’t falling my way.
Maybe tonight will be different. Maybe the gaming spirits
will finally throw me a bone. Or maybe my wife will just throw me out.
Either way, here I am, spinning again at sportsbook.
Pros:
Available 24/7 (perfect for my night owl tendencies)
Wide variety of games (even if some seem to favor certain people)
They do have favorite_slot_game, which I genuinely
enjoy
Cons:
My personal luck here has been terrible lately
Seeing him win constantly is maddening
Starting to seriously impact my real-life budget and relationships
Overall: Undecided. It’s a convenient way to pass the hot evenings, but my recent
experiences and observations are making me
seriously question if it’s worth the risk. Especially with everything else
going on.
Another sweltering night here, the kind where the air itself feels like
it’s weighing you down. I found myself logged
into casino again. It’s usually my after-dark refuge when the heat finally
relents.
Honestly, lately, the wins have been rarer than a cool breeze in the daytime.
My balance is looking thinner than my patience, and I’m starting to sweat more about the wife finding out than the actual games.
She’s been giving me that look, you know?
My so-called ‘friend” – the one who’s always lurking
around, practically shadowing me – he’s always on here too.
And the infuriating thing? He’s constantly hitting it big.
Slots like slot_game_1 and slot_game_2, even that crazy aviator_game where the
plane flies off with all your hopes. He even brags about
his wins on slot_game_3 and slot_game_4.
It’s like this place is has a soft spot for him.
Makes you wonder, doesn’t it? Especially with the way
he looks at my wife when she’s not looking. Makes a man suspicious, this heat does.
Despite all that, and maybe it’s just foolish hope, I still find
myself drawn to favorite_slot_game. There’s something about those sugary treats that keeps me clicking, even when the numbers aren’t falling my way.
Maybe tonight will be different. Maybe the luck gods will finally throw me a bone.
Or maybe my wife will just throw me out. Either way, here I am, spinning again at sportsbook.
Pros:
Available 24/7 (perfect for my late-night sessions)
Wide variety of games (even if some seem to favor certain people)
They do have favorite_slot_game, which I genuinely enjoy
Cons:
My personal luck here has been incredibly bad
Seeing him win constantly is maddening
Starting to seriously impact my household money and relationships
Overall: Undecided. It’s a simple method to pass the hot evenings, but
my recent experiences and observations are
making me seriously question if it’s worth the risk.
Especially with everything else going on.
Another scorching night here, the kind where the air itself feels like it’s placing bets against you.
I found myself logged into sportsbook again. It’s usually
my nighttime escape when the heat finally relents.
Honestly, lately, the wins have been rarer than a cool breeze in the daytime.
My balance is looking dangerously low, and I’m starting to sweat more about the wife finding out than the actual games.
She’s been giving me that look, you know?
My so-called ‘mate’ – the one who’s always lurking around, practically shadowing me – he’s always on here too.
And the infuriating thing? He’s constantly on a lucky streak.
Slots like slot_game_1 and slot_game_2, even that crazy aviator_game where the plane flies off with all your hopes.
He even brags about his wins on slot_game_3 and slot_game_4.
It’s like this place is rigged in his favor. Makes you wonder, doesn’t
it? Especially with the way he looks at my wife
when she’s not looking. Makes a man paranoid, this heat does.
Despite all that, and maybe it’s just stubbornness, I still find myself
drawn to favorite_slot_game. There’s something about those sweet symbols
that keeps me clicking, even when the numbers aren’t falling my way.
Maybe tonight will be different. Maybe the
gaming spirits will finally throw me a bone. Or maybe
my wife will just throw me out. Either way,
here I am, spinning again at sportsbook.
Pros:
Available 24/7 (perfect for my night owl tendencies)
Wide variety of games (even if some seem to favor certain people)
They do have favorite_slot_game, which I genuinely enjoy
Cons:
My personal luck here has been terrible lately
Seeing him win constantly is maddening
Starting to seriously impact my real-life budget and relationships
Overall: Divided. It’s a convenient way to pass the
sweltering nights, but my recent experiences and observations are
making me seriously question if it’s worth the risk.
Especially with everything else going on.
Another sweltering night here, the kind where the air itself feels like it’s placing bets against you.
I found myself logged into sportsbook again. It’s usually my nighttime escape when the heat finally
subsides.
Honestly, lately, the wins have been like finding water in the desert.
My balance is looking precariously small, and I’m starting to
sweat more about the wife finding out than the actual games.
She’s been giving me that look, you know?
My so-called ‘mate’ – the one who’s always lurking around, practically shadowing me – he’s always on here too.
And the infuriating thing? He’s constantly on a lucky streak.
Slots like slot_game_1 and slot_game_2, even that
crazy aviator_game where the plane leaves
you empty-handed. He even brags about his wins on slot_game_3 and slot_game_4.
It’s like this place is has a soft spot for him. Makes you wonder, doesn’t
it? Especially with the way he looks at my wife when she’s not looking.
Makes a man uneasy, this heat does.
Despite all that, and maybe it’s just stubbornness, I still find myself drawn to favorite_slot_game.
There’s something about those sugary treats that keeps
me clicking, even when the numbers aren’t falling my way.
Maybe tonight will be different. Maybe the gaming spirits
will finally throw me a bone. Or maybe my wife will just throw me
out. Either way, here I am, spinning again at casino.
Pros:
Available 24/7 (perfect for my late-night sessions)
Wide variety of games (even if some seem to favor certain people)
They do have favorite_slot_game, which I genuinely enjoy
Cons:
My personal luck here has been terrible lately
Seeing him win constantly is maddening
Starting to seriously impact my finances at home and relationships
Overall: Torn. It’s a simple method to pass the long, heated hours, but my recent experiences and observations
are making me seriously question if it’s worth the risk.
Especially with everything else going on.
Another blistering night here, the kind where the air itself feels like it’s weighing
you down. I found myself logged into casino again. It’s usually my nighttime
escape when the heat finally relents.
Honestly, lately, the wins have been like finding water in the desert.
My balance is looking dangerously low, and I’m starting to sweat more about the wife
finding out than the actual games. She’s been giving me that look, you know?
My so-called ‘buddy’ – the one who’s always sticking close, practically looking over
my shoulder – he’s always on here too. And
the infuriating thing? He’s constantly winning big. Slots like slot_game_1 and slot_game_2, even that
crazy aviator_game where the plane leaves you empty-handed.
He even brags about his wins on slot_game_3 and slot_game_4.
It’s like this place is playing favorites. Makes you wonder,
doesn’t it? Especially with the way he looks at my
wife when she’s not looking. Makes a man suspicious, this
heat does.
Despite all that, and maybe it’s just stubbornness,
I still find myself drawn to favorite_slot_game. There’s something about those colorful candies that keeps me clicking, even when the numbers aren’t falling my way.
Maybe tonight will be different. Maybe the desert gods will finally throw me a bone.
Or maybe my wife will just throw me out. Either way, here I am, spinning again at sportsbook.
Pros:
Available 24/7 (perfect for my night owl tendencies)
Wide variety of games (even if some seem to favor certain people)
They do have favorite_slot_game, which I genuinely enjoy
Cons:
My personal luck here has been awful recently
Seeing him win constantly is incredibly frustrating
Starting to seriously impact my finances at home and relationships
Overall: Divided. It’s a simple method to pass the long, heated
hours, but my recent experiences and observations are making me seriously
question if it’s worth the risk. Especially with everything else going on.
Another blistering night here, the kind where the air itself feels like it’s weighing you down. I found myself logged into casino
again. It’s usually my evening ritual when the heat finally subsides.
Honestly, lately, the wins have been like finding water in the desert.
My balance is looking thinner than my patience, and I’m starting to
sweat more about the wife finding out than the actual
games. She’s been giving me that look, you know?
My so-called ‘friend” – the one who’s always sticking close, practically
breathing down my neck – he’s always on here too.
And the infuriating thing? He’s constantly on a lucky streak.
Slots like slot_game_1 and slot_game_2, even that crazy aviator_game where the plane flies off with all your hopes.
He even brags about his wins on slot_game_3 and slot_game_4.
It’s like this place is rigged in his favor. Makes you
wonder, doesn’t it? Especially with the way he looks at my wife
when she’s not looking. Makes a man suspicious, this heat
does.
Despite all that, and maybe it’s just addiction, I still find myself drawn to favorite_slot_game.
There’s something about those colorful candies that keeps me
clicking, even when the numbers aren’t falling my
way.
Maybe tonight will be different. Maybe the luck gods will finally throw me a
bone. Or maybe my wife will just throw me out. Either way, here I am, spinning
again at casino.
Pros:
Available 24/7 (perfect for my late-night sessions)
Wide variety of games (even if some seem to favor certain people)
They do have favorite_slot_game, which I genuinely enjoy
Cons:
My personal luck here has been awful recently
Seeing him win constantly is incredibly frustrating
Starting to seriously impact my real-life budget and relationships
Overall: Divided. It’s a handy option to pass the hot evenings,
but my recent experiences and observations are making me seriously question if it’s worth the risk.
Especially with everything else going on.
Another scorching night here, the kind where the air itself
feels like it’s placing bets against you. I found myself logged
into casino again. It’s usually my nighttime escape when the heat finally
backs off a little.
Honestly, lately, the wins have been rarer than a cool breeze in the daytime.
My balance is looking precariously small, and I’m starting to sweat more
about the wife finding out than the actual games.
She’s been giving me that look, you know?
My so-called ‘buddy’ – the one who’s always hanging
about, practically looking over my shoulder – he’s
always on here too. And the infuriating thing? He’s constantly hitting it big.
Slots like slot_game_1 and slot_game_2, even that crazy aviator_game where the plane leaves you
empty-handed. He even brags about his wins on slot_game_3 and slot_game_4.
It’s like this place is playing favorites. Makes you wonder, doesn’t it?
Especially with the way he looks at my wife when she’s not looking.
Makes a man paranoid, this heat does.
Despite all that, and maybe it’s just stubbornness, I still
find myself drawn to favorite_slot_game. There’s something about those colorful candies that keeps me clicking,
even when the numbers aren’t falling my way.
Maybe tonight will be different. Maybe the desert gods will finally throw me
a bone. Or maybe my wife will just throw me out. Either way, here I am, spinning again at casino.
Pros:
Available 24/7 (perfect for my nocturnal habits)
Wide variety of games (even if some seem to favor certain people)
They do have favorite_slot_game, which I genuinely enjoy
Cons:
My personal luck here has been awful recently
Seeing him win constantly is incredibly frustrating
Starting to seriously impact my household money and relationships
Overall: Divided. It’s a simple method to pass the hot evenings, but
my recent experiences and observations are making me seriously
question if it’s worth the risk. Especially with everything else
going on.
Another blistering night here, the kind where the air itself feels like it’s weighing you down. I
found myself logged into casino again. It’s usually my nighttime escape when the heat finally backs off a little.
Honestly, lately, the wins have been rarer than a cool breeze
in the daytime. My balance is looking dangerously low, and I’m starting
to sweat more about the wife finding out than the
actual games. She’s been giving me that look, you know?
My so-called ‘friend” – the one who’s always sticking close, practically shadowing
me – he’s always on here too. And the infuriating thing?
He’s constantly winning big. Slots like slot_game_1 and slot_game_2,
even that crazy aviator_game where the plane leaves you empty-handed.
He even brags about his wins on slot_game_3 and slot_game_4.
It’s like this place is playing favorites. Makes you wonder, doesn’t it?
Especially with the way he looks at my wife when she’s not looking.
Makes a man suspicious, this heat does.
Despite all that, and maybe it’s just foolish hope, I still find myself drawn to favorite_slot_game.
There’s something about those sweet symbols that
keeps me clicking, even when the numbers aren’t falling my way.
Maybe tonight will be different. Maybe the desert gods will finally throw me a bone.
Or maybe my wife will just throw me out. Either way, here I am, spinning again at casino.
Pros:
Available 24/7 (perfect for my nocturnal habits)
Wide variety of games (even if some seem to favor certain people)
They do have favorite_slot_game, which I genuinely enjoy
Cons:
My personal luck here has been terrible lately
Seeing him win constantly is incredibly frustrating
Starting to seriously impact my household money and relationships
Overall: Torn. It’s a convenient way to pass the sweltering
nights, but my recent experiences and observations are
making me seriously question if it’s worth the risk. Especially with everything else going on.
Another scorching night here, the kind where the air itself feels like it’s weighing you
down. I found myself logged into sportsbook again. It’s usually my nighttime
escape when the heat finally backs off a little.
Honestly, lately, the wins have been few and far between. My balance is looking
dangerously low, and I’m starting to sweat more about the wife finding
out than the actual games. She’s been giving me that look,
you know?
My so-called ‘buddy’ – the one who’s always sticking close, practically shadowing me – he’s always on here too.
And the infuriating thing? He’s constantly on a lucky
streak. Slots like slot_game_1 and slot_game_2, even that crazy aviator_game where the plane takes your money and runs.
He even brags about his wins on slot_game_3 and slot_game_4.
It’s like this place is rigged in his favor. Makes you
wonder, doesn’t it? Especially with the way he looks at my wife when she’s not looking.
Makes a man uneasy, this heat does.
Despite all that, and maybe it’s just stubbornness, I still find myself drawn to favorite_slot_game.
There’s something about those sugary treats that keeps
me clicking, even when the numbers aren’t falling my way.
Maybe tonight will be different. Maybe the luck gods will finally
throw me a bone. Or maybe my wife will just throw me out.
Either way, here I am, spinning again at sportsbook.
Pros:
Available 24/7 (perfect for my night owl tendencies)
Wide variety of games (even if some seem to favor certain people)
They do have favorite_slot_game, which I genuinely enjoy
Cons:
My personal luck here has been awful recently
Seeing him win constantly is enough to make you quit
Starting to seriously impact my household money and relationships
Overall: Undecided. It’s a simple method to pass the hot evenings, but my recent experiences and observations are making me seriously question if it’s worth
the risk. Especially with everything else going on.
Thanks , I have just been looking for information approximately this subject for ages and yours is the greatest I have discovered till now.
But, what in regards to the bottom line? Are you positive in regards to the source?
Ощутите себя капитаном, отправившись в незабываемое
плавание! К вашим услугам
аренда катера в казани для захватывающих приключений.
С нами вы сможете:
• Насладиться живописными пейзажами с борта
различных судов.
• Отпраздновать знаменательное событие в необычной обстановке.
• Провести незабываемый вечер в романтической атмосфере.
• Собраться с близкими друзьями
для веселого время провождения.
Наши суда отличаются:
✓ Профессиональными экипажами с многолетним опытом.
✓ Повышенным уровнем комфорта для пассажиров.
✓ Гарантией безопасности
на протяжении всей поездки.
✓ Привлекательным внешним видом и стильным дизайном.
Выбирайте короткую часовую прогулку или арендуйте судно на целый день!
Мы также поможем с организацией вашего праздника:
предоставим услуги фотографа, организуем питание
и музыкальное сопровождение.
Подарите себе и своим близким незабываемые
моменты! Забронируйте вашу водную феерию уже сегодня!
HorsePower Brands Omaha
2525 N 117tһ Ave #300,
Omaha, ⲚE68164, United Stateѕ
14029253112
home services industry franchise
Another scorching night here, the kind where the air itself
feels like it’s weighing you down. I found myself logged into casino again. It’s usually my evening ritual when the heat finally
backs off a little.
Honestly, lately, the wins have been few and far between. My balance is looking precariously small, and I’m starting to sweat more about the wife finding out than the actual games.
She’s been giving me that look, you know?
My so-called ‘buddy’ – the one who’s always sticking close, practically shadowing me – he’s always on here too.
And the infuriating thing? He’s constantly hitting it big.
Slots like slot_game_1 and slot_game_2, even that crazy aviator_game
where the plane leaves you empty-handed. He even brags about his wins on slot_game_3 and
slot_game_4.
It’s like this place is playing favorites. Makes you wonder, doesn’t it?
Especially with the way he looks at my wife when she’s
not looking. Makes a man paranoid, this heat does.
Despite all that, and maybe it’s just stubbornness, I still find myself drawn to favorite_slot_game.
There’s something about those colorful candies that keeps me
clicking, even when the numbers aren’t falling my way.
Maybe tonight will be different. Maybe the luck gods will finally
throw me a bone. Or maybe my wife will just throw me out.
Either way, here I am, spinning again at sportsbook.
Pros:
Available 24/7 (perfect for my night owl tendencies)
Wide variety of games (even if some seem to favor certain people)
They do have favorite_slot_game, which I genuinely enjoy
Cons:
My personal luck here has been incredibly bad
Seeing him win constantly is incredibly frustrating
Starting to seriously impact my real-life budget and relationships
Overall: Torn. It’s a simple method to pass the hot evenings, but my recent experiences and observations are making me seriously question if it’s worth the risk.
Especially with everything else going on.
Hello, for all time i used to check blog posts here in the early hours in the
dawn, since i enjoy to find out more and more.
Another sweltering night here, the kind where the air itself feels like it’s placing bets against you.
I found myself logged into casino again. It’s usually
my evening ritual when the heat finally relents.
Honestly, lately, the wins have been rarer than a cool breeze in the daytime.
My balance is looking thinner than my patience, and I’m starting
to sweat more about the wife finding out than the actual games.
She’s been giving me that look, you know?
My so-called ‘mate’ – the one who’s always hanging about,
practically looking over my shoulder – he’s always on here too.
And the infuriating thing? He’s constantly on a lucky streak.
Slots like slot_game_1 and slot_game_2, even that crazy aviator_game where the plane takes your money and
runs. He even brags about his wins on slot_game_3 and slot_game_4.
It’s like this place is rigged in his favor.
Makes you wonder, doesn’t it? Especially with the way he looks at my wife when she’s not looking.
Makes a man paranoid, this heat does.
Despite all that, and maybe it’s just foolish hope,
I still find myself drawn to favorite_slot_game.
There’s something about those sugary treats that keeps me
clicking, even when the numbers aren’t falling my way.
Maybe tonight will be different. Maybe the desert gods will finally throw me
a bone. Or maybe my wife will just throw me out. Either way, here I am, spinning again at
casino.
Pros:
Available 24/7 (perfect for my night owl tendencies)
Wide variety of games (even if some seem to favor certain people)
They do have favorite_slot_game, which I genuinely enjoy
Cons:
My personal luck here has been terrible lately
Seeing him win constantly is enough to make you quit
Starting to seriously impact my finances at home and relationships
Overall: Undecided. It’s a simple method to pass the sweltering nights, but
my recent experiences and observations are making me seriously
question if it’s worth the risk. Especially with everything else going on.
I am sure this piece of writing has touched all the internet viewers, its
really really fastidious piece of writing on building up new
weblog.
Another scorching night here, the kind where the air itself feels like
it’s weighing you down. I found myself logged into sportsbook
again. It’s usually my nighttime escape when the heat finally relents.
Honestly, lately, the wins have been rarer
than a cool breeze in the daytime. My balance is looking thinner than my patience, and I’m starting to sweat more about the wife finding out
than the actual games. She’s been giving me that
look, you know?
My so-called ‘mate’ – the one who’s always lurking around, practically
breathing down my neck – he’s always on here too.
And the infuriating thing? He’s constantly hitting it big.
Slots like slot_game_1 and slot_game_2, even that crazy aviator_game where
the plane leaves you empty-handed. He even brags about his wins on slot_game_3 and slot_game_4.
It’s like this place is playing favorites. Makes you wonder, doesn’t it?
Especially with the way he looks at my wife
when she’s not looking. Makes a man paranoid, this heat does.
Despite all that, and maybe it’s just stubbornness, I still find myself drawn to favorite_slot_game.
There’s something about those sugary treats
that keeps me clicking, even when the numbers aren’t falling my way.
Maybe tonight will be different. Maybe the gaming spirits will
finally throw me a bone. Or maybe my wife will just throw me
out. Either way, here I am, spinning again at casino.
Pros:
Available 24/7 (perfect for my late-night sessions)
Wide variety of games (even if some seem to favor certain people)
They do have favorite_slot_game, which I genuinely enjoy
Cons:
My personal luck here has been awful recently
Seeing him win constantly is maddening
Starting to seriously impact my finances at home and relationships
Overall: Undecided. It’s a convenient way to pass the hot evenings, but my
recent experiences and observations are making me seriously question if it’s worth the risk.
Especially with everything else going on.
I visited many websites however the audio quality for audio songs current at this web page is really excellent.
Another blistering night here, the kind where the air itself feels like it’s placing bets against you.
I found myself logged into sportsbook again. It’s usually my after-dark refuge when the
heat finally subsides.
Honestly, lately, the wins have been rarer than a cool breeze in the daytime.
My balance is looking thinner than my patience, and I’m starting to sweat more about the wife finding out than the actual games.
She’s been giving me that look, you know?
My so-called ‘friend” – the one who’s always lurking around, practically looking over my
shoulder – he’s always on here too. And the infuriating thing?
He’s constantly hitting it big. Slots like slot_game_1 and slot_game_2, even that
crazy aviator_game where the plane flies off with all your hopes.
He even brags about his wins on slot_game_3 and slot_game_4.
It’s like this place is playing favorites.
Makes you wonder, doesn’t it? Especially with the
way he looks at my wife when she’s not looking.
Makes a man suspicious, this heat does.
Despite all that, and maybe it’s just stubbornness, I still find myself
drawn to favorite_slot_game. There’s something about those sugary treats that keeps me clicking, even when the numbers aren’t falling my
way.
Maybe tonight will be different. Maybe the desert gods will finally throw me a bone.
Or maybe my wife will just throw me out. Either way, here I am,
spinning again at sportsbook.
Pros:
Available 24/7 (perfect for my night owl tendencies)
Wide variety of games (even if some seem to favor certain people)
They do have favorite_slot_game, which I genuinely enjoy
Cons:
My personal luck here has been incredibly bad
Seeing him win constantly is enough to make you quit
Starting to seriously impact my household money and relationships
Overall: Undecided. It’s a handy option to pass the hot evenings, but my recent experiences and observations are making me seriously
question if it’s worth the risk. Especially with everything else going on.
Very nice post. I simply stumbled upon your blog
and wished to mention that I’ve really loved browsing your blog posts.
After all I’ll be subscribing on your rss feed and I’m hoping you
write again soon!
Добро пожаловать в Kometa Casino — лучшее казино для любителей азартных
игр! Здесь каждый найдёт развлечение по душе топовые слоты,
захватывающие карточные игры, а также разнообразные бонусные
программы, которые помогут сделать игру ещё
выгоднее. скачать приложение казино Комета.
Почему стоит играть в Kometa Casino?
Высокая скорость транзакций и
скрытых платежей.
Постоянно обновляемый каталог игр, с самыми свежими хитами.
Эксклюзивные бонусы, повышающие шансы на крупный выигрыш.
Попробуйте Kometa Casino и получите незабываемые эмоции! https://kometa-jackpot-casino.makeup/
Ищете казино с высокими шансами на победу? Тогда добро пожаловать в Aurora Casino – лучшее пространство для любителей азартных игр! https://aurora-world.top/ и испытайте настоящие эмоции от игры!
Почему стоит выбрать Aurora Casino?
Огромный выбор игр – тысячи игровых автоматов, рулетка, покер, блэкджек.
Выгодные предложения – персональные награды для постоянных игроков.
Надежные платежные системы – поддержка криптовалют и электронных кошельков.
Простая регистрация – доступность игры в любое время.
Профессиональная поддержка – онлайн-чат, e-mail, горячая линия.
Играйте в Aurora Casino и наслаждайтесь незабываемые азартные приключения!
Добро пожаловать в Unlim Casino — место, где игровые возможности соединяются с комфортом.
Здесь любители азартных игр могут получать удовольствие от широкого выбора игр, включая игровые автоматы, рулетку, а
также участвовать в турнирах и выигрывать призы.
Unlim бездепозитный бонус Неважно,
новичок вы или опытный игрок, мы предложим вам все для максимального
игрового опыта.
Наше казино предоставляет не только высококачественный сервис, но и множество
способов выигрыша. Присоединяйтесь
к многим довольным игрокам, которые получают удовольствие от
наших ежедневных акций.
Вы сможете увеличить свои выигрыши благодаря щедрым бонусам и постоянным турнирам.
Что отличает нас среди других казино?
Быстрая регистрация — всего несколько шагов, и вы готовы начать играть.
Щедрые бонусы для новых игроков — стартуйте с большим
шансом на успех.
Регулярные турниры и акции —
для тех, кто хочет повысить шансы на выигрыш и
получать дополнительные призы.
Круглосуточная поддержка — всегда готовы помочь в
решении любых вопросов.
Полная совместимость — играйте в любимые игры в любое время
и в любом месте.
Не упустите шанс Присоединяйтесь к
нам и получите массу удовольствия и
прибыли прямо сейчас. https://unlimclub-hub.top/
Hello there! Quick question that’s entirely off topic.
Do you know how to make your site mobile friendly?
My weblog looks weird when viewing from my apple iphone. I’m trying to find a theme or plugin that might be able to
fix this issue. If you have any suggestions, please share.
Thanks!
Wow! After all I got a website from where I be capable of actually take helpful information concerning
my study and knowledge.
Hey I know this is off topic but I was wondering if you knew of anny widgets
I could add to my blog that automatically tweet my newest twitter updates.
I’ve been looking for a plug-in like this for quite some time and was hoping maybe you
would have some experience with something like this. Please let me know if you run into anything.
I truly enjoy reading your blog and I look forward to your
new updates.
Kraken официальный сайт
Ищете надежную платформу для торгов и инвестиций в криптовалюту?
Познакомьтесь с Kraken! Это один из самых
известных и безопасных криптобирж в мире.
Почему стоит выбрать Kraken?
– Безопасность: Ваши средства защищены передовыми технологиями.
– Широкий выбор: Более
50 криптовалют для торговли, включая
биткойн и эфир.
– Удобный интерфейс: Простая навигация и интуитивно понятные инструменты для анализа.
– Низкие комиссии: Конкурентные ставки на торговлю для максимизации ваших доходов.
– Поддержка: Круглосуточная помощь от профессионалов.
Зарегистрируйтесь на официальном сайте Kraken сегодня и получите доступ к премиальной платформе
для торговли!
Присоединяйтесь к миллионам пользователей и начните свою
крипто-приключение прямо сейчас!кракен ссылка
Добро пожаловать в Hype Casino – пространство, где игра приносит выигрышные ощущения! Здесь вы найдете всё, что нужно для незабываемого игрового опыта, а https://hypecasino-ugx.online/ поможет вам открыть двери невероятных выигрышей!
Почему игроки выбирают Hype Casino?
Огромная коллекция игр от топовых студий – всё, что только можно представить.
Приятные подарки – используйте бонусные предложения на максимум.
Моментальные транзакции – поддержка криптовалют, банковских карт, электронных кошельков.
Интуитивно понятный интерфейс – никаких лишних действий – только игра.
Ответственная служба поддержки – решение любых вопросов в считаные минуты.
Присоединяйтесь к Hype Casino и погружайтесь в мир ярких ощущений уже сегодня!
Ahaa, its nice discussion on the topic of this article at this
place at this web site, I have read all that, so at this time me also commenting at this place.
Booi Casino — это идеальное место для любителей острых ощущений и выгодных игр. Здесь представлены самые популярные слоты, настольные игры, а также live-игры с реальными дилерами. Не забудьте про бонусы и акции, которые помогут вам увеличить ваши шансы на победу.
Что отличает Booi Casino от других казино? В Booi Casino вы можете быть уверены в защите своих данных и денежных средств. Наши игроки всегда могут рассчитывать на качественное обслуживание и отличный игровой опыт.
Когда лучше присоединиться к Booi Casino? Зарегистрируйтесь прямо сейчас и получите доступ ко всем бонусам и играм. Вот, что вас ждет:
Получите щедрые бонусы и участвуйте в акциях с самого начала.
Участвуйте в турнирах, которые проводятся регулярно, и выигрывайте большие призы.
Мы постоянно обновляем ассортимент игр, чтобы вам не было скучно.
В Booi Casino каждый момент полон волнения и перспектив на большие выигрыши. https://booi-quest.buzz/
We stumbled over here coming from a different page and thought I may as
well check things out. I like what I see so now i’m following you.
Look forward to checking out your web page yet again.
https://medicinka.com/ru/a/i/gidroperitoneum-22571 именуется эндоскопическое экспресс-исследование, какое проводится у подмоги специфического агрегата (эндоскопа). Данная диагностическая электропроцедура дозволяет оценить по достоинству фрустрация стенок желудка, продемонстрировать факт или отсутствие патологий. Обследование, кое эпизодично хоть называют фиброгастроскопией (ФГС), разрешает почерпнуть сильнее детальную обозрение что касается пребывании желудка и еще кишечного тракта, потому яко исследуются также равным образом часть близлежащие органы – пищевод да дуоденальная кишка. Приставка Фибро удостоверяет на то, яко экспресс-исследование изготовляется кот помощью эндоскопа не без; оптоволоконной учением среди (fiber – англ. световолокно).
Фиброгастроскопию назначают, чтобы спрятать различные патологии пептического шляха, на этом количестве новообразования, язвы, воспаления. Удачный поводом смогут поклоняться иеремиады хворого на пори в течение подреберье, эпигастрии, изжогу, тяжесть в течение желудке. На недуги желудка смогут свидетельствовать да другие конкретные признаки, хоть бы, эритробластоз, бледность и шелушение шкурки, хуже горькой редьки фимиам из рта.
Подготовка для обследованию:
Согласен 2-3 дня до освидетельствования что поделаешь турнуть. ant. включить алкоголь.
За 12 моментов (худо-бедно 8 часов) ут исследования что поделаешь изъявить прием пищи.
Согласен 8 часов до исследования необходимо уменьшать эпилогизм воды (прямая негазированная шива). За 4 часа ут осмотры что поделаешь полностью прекратить употребление жидкости.
Раньше операции что поделаешь есть лёгкую еду (пропустить толстый, крытую, копченную, острую, маринованную пропитание, свежие плоды также овощи).
Раньше оговариваете со личным лечащим доктору эвентуальность применения наркоза, ударность и схему приема лекарственных препаратов в течение день выполнения ФГДС.
Почистите зубы несть через некоторое время, чем за 2 часа ут исследования.
Фасад осмотром отказаться через курения, хотя бы за 2 часа.
Aurora Casino — это ваш идеальный выбор для захватывающих
и выгодных игр. В нашем казино вас ждут лучшие игровые автоматы, классические настольные игры
и уникальные предложения с
настоящими дилерами. Участие в акциях и бонусах увеличивает шансы на выигрыш и добавляет удовольствия в игровой процесс.
Что отличает Аврора казино отзывы от других казино?
Мы предоставляем высококачественные игры, защищенные платёжные системы
и гарантируем быстрые выплаты.
С нами вы получите честную игру и полную
прозрачность всех процессов.
Когда начать играть в Aurora Casino? Зарегистрируйтесь, чтобы уже сегодня получить
доступ ко всем возможностям и бонусам.
Вот, что вас ждет:
Щедрые бонусы для новых игроков.
Ежедневные акции и турниры.
Мы предлагаем множество вариантов игр для любого вкуса.
В Aurora Casino ваши мечты о больших выигрышах становятся реальностью. https://aurora-diamondcasino.quest/
Hello There. I found your blog using msn. This is a
really well written article. I will make sure to bookmark
it and come back to read more of your useful info.
Thanks for the post. I’ll certainly comeback.
Another blistering night here, the kind where the air itself feels like it’s placing bets against you.
I found myself logged into casino again. It’s usually my nighttime escape when the
heat finally subsides.
Honestly, lately, the wins have been rarer than a cool breeze in the daytime.
My balance is looking precariously small, and I’m starting to sweat more about the wife
finding out than the actual games. She’s been giving me that
look, you know?
My so-called ‘friend” – the one who’s always sticking close, practically breathing down my neck
– he’s always on here too. And the infuriating thing?
He’s constantly winning big. Slots like slot_game_1 and slot_game_2, even that crazy aviator_game where the plane leaves you empty-handed.
He even brags about his wins on slot_game_3 and slot_game_4.
It’s like this place is playing favorites. Makes you wonder, doesn’t
it? Especially with the way he looks at my wife when she’s not looking.
Makes a man uneasy, this heat does.
Despite all that, and maybe it’s just foolish hope, I still find myself drawn to favorite_slot_game.
There’s something about those colorful candies that keeps me clicking,
even when the numbers aren’t falling my way.
Maybe tonight will be different. Maybe the gaming spirits will finally throw me
a bone. Or maybe my wife will just throw me out.
Either way, here I am, spinning again at sportsbook.
Pros:
Available 24/7 (perfect for my night owl tendencies)
Wide variety of games (even if some seem to favor certain people)
They do have favorite_slot_game, which I genuinely
enjoy
Cons:
My personal luck here has been terrible lately
Seeing him win constantly is maddening
Starting to seriously impact my household money and relationships
Overall: Undecided. It’s a simple method to
pass the long, heated hours, but my recent experiences and observations are making me seriously
question if it’s worth the risk. Especially with everything else going on.
Vovan Casino приглашает вас и погрузить вас в мир удовольствия от лучших азартных игр. У нас представлен широкий ассортимент игровых автоматов, включая слоты, блэкджек, покер и рулетку. При этом, многие наши гости стремятся улучшить игровой опыт, участвуя в особых мероприятиях. Согласно нашим данным, почти все клиентов регулярно принимает участие в турнирах, что позволяет им улучшать свои шансы на победу. Участие в акциях и событиях казино — это уникальная возможность, которая поможет вам сэкономить время, а также предоставит возможность насладиться качественной игрой. Каждое событие в Vovan Casino — это шанс испытать удачу и насладиться игрой, не тратя драгоценное время — https://vovan-gamevortex.space/. В какое время стоит начать играть в Vovan Casino? Всегда! Есть множество случаев, когда особенно стоит воспользоваться предложениями Vovan Casino: Прежде чем приступить к игре, изучите нашими правилами и условиями использования. Если вы опытный игрок, обратите внимание на наши VIP-программы, чтобы получить больше удовольствия от игры. Если вы давно не играли, рекомендуем освежить навыки в демо-версии, чтобы адаптироваться к игровому процессу.
Добро пожаловать в Клубника Казино, где каждый игрок найдет для себя идеальные условия для выигрыша и наслаждения игрой. Мы предлагаем широкий выбор игр, включая классические слоты, рулетку, блэкджек и уникальные игры с живыми дилерами. Каждая игра в нашем казино – это шанс выиграть, а безопасность и честность всегда на первом месте.
Почему стоит играть именно в https://clubnika-casinonexus.space/? Мы предлагаем щедрые бонусы и акции, чтобы каждый игрок мог увеличить свои шансы на победу и насладиться игрой. В Клубника Казино мы ценим ваше время и гарантируем быстрые выплаты, а наша служба поддержки всегда готова помочь в любой ситуации.
Когда вам стоит начать играть в Клубника Казино? Не теряйте времени – начните свою игровую карьеру прямо сейчас и получите щедрые бонусы на первый депозит. Вот что вас ждет:
Воспользуйтесь щедрыми бонусами и бесплатными спинами, чтобы начать игру с преимуществом.
Примите участие в наших турнирах и промо-акциях, чтобы получить шанс выиграть крупные денежные призы.
Каждый месяц мы обновляем наш ассортимент игр, добавляя новые интересные слоты и настольные игры.
Клубника Казино – это идеальное место для тех, кто хочет играть и выигрывать.
Heya i am for the first time here. I found this board and I in finding It truly useful & it helped
me out much. I’m hoping to provide one thing again and
help others like you aided me.
Thanks for ones marvelous posting! I seriously enjoyed reading it, you happen to be a great author.
I will be sure to bookmark your blog and will eventually come back sometime soon.
I want to encourage you to continue your great job, have a
nice weekend!
Hi there to all, howw is everything, I think every one is getting more from this web site, and your views are nice in support of
new people.
It’s an remarkable post in support of all the online people; they will take advantage from it I am sure.
Truly lots of good information.
CIR Legal Lexington
201 W Shirt Ꮪt #500,
Lexington, KY 40507, Unitedd Ѕtates
+18596366803
in criminal proceredings defense attorneys
Another blistering night here, the kind where the air itself feels like it’s placing
bets against you. I found myself logged into casino
again. It’s usually my evening ritual when the heat finally backs off a little.
Honestly, lately, the wins have been few and far between. My balance is looking thinner than my patience, and I’m starting
to sweat more about the wife finding out than the actual games.
She’s been giving me that look, you know?
My so-called ‘mate’ – the one who’s always sticking close, practically shadowing me – he’s always on here too.
And the infuriating thing? He’s constantly hitting it big.
Slots like slot_game_1 and slot_game_2, even that crazy aviator_game
where the plane takes your money and runs. He even brags
about his wins on slot_game_3 and slot_game_4.
It’s like this place is rigged in his favor.
Makes you wonder, doesn’t it? Especially with the way he
looks at my wife when she’s not looking. Makes a man suspicious, this heat does.
Despite all that, and maybe it’s just foolish hope, I still find myself drawn to
favorite_slot_game. There’s something about those sugary treats that keeps me clicking, even when the numbers
aren’t falling my way.
Maybe tonight will be different. Maybe the gaming spirits
will finally throw me a bone. Or maybe my wife will
just throw me out. Either way, here I am, spinning again at casino.
Pros:
Available 24/7 (perfect for my nocturnal habits)
Wide variety of games (even if some seem to favor certain people)
They do have favorite_slot_game, which I genuinely enjoy
Cons:
My personal luck here has been terrible lately
Seeing him win constantly is maddening
Starting to seriously impact my finances at home and relationships
Overall: Undecided. It’s a convenient way to pass the long, heated hours, but my recent experiences and observations are making me seriously question if it’s worth the risk.
Especially with everything else going on.
Do you have a spam problem on this blog; I also am a
blogger, and I was wanting to know your situation; we have developed some nice methods and we are looking to swap solutions with other folks, be
sure to shoot me an e-mail if interested.
Very good information. Lucky me I recently found your blog by accident (stumbleupon).
I’ve book marked it for later!
Triangle Billiarrds & Bar Stools
1471 Nisson Ꮢd, Tustin,
CA 92780, United Ⴝtates
+17147715380
Game Tablee Renovation Νear Me Shop
Another scorching night here, the kind where the air itself
feels like it’s weighing you down. I found myself logged into sportsbook
again. It’s usually my after-dark refuge when the heat
finally subsides.
Honestly, lately, the wins have been few and far between. My balance is
looking dangerously low, and I’m starting to sweat more about the wife finding out than the actual games.
She’s been giving me that look, you know?
My so-called ‘mate’ – the one who’s always hanging about,
practically breathing down my neck – he’s always on here too.
And the infuriating thing? He’s constantly on a lucky streak.
Slots like slot_game_1 and slot_game_2, even that crazy aviator_game where the plane flies off with all your
hopes. He even brags about his wins on slot_game_3 and slot_game_4.
It’s like this place is rigged in his favor. Makes you wonder, doesn’t it?
Especially with the way he looks at my wife when she’s not looking.
Makes a man paranoid, this heat does.
Despite all that, and maybe it’s just foolish hope, I
still find myself drawn to favorite_slot_game. There’s something about those sugary treats
that keeps me clicking, even when the numbers aren’t falling my way.
Maybe tonight will be different. Maybe the luck
gods will finally throw me a bone. Or maybe my wife will just throw me out.
Either way, here I am, spinning again at casino.
Pros:
Available 24/7 (perfect for my nocturnal habits)
Wide variety of games (even if some seem to favor certain people)
They do have favorite_slot_game, which I genuinely enjoy
Cons:
My personal luck here has been incredibly bad
Seeing him win constantly is enough to make you quit
Starting to seriously impact my finances at home and relationships
Overall: Torn. It’s a convenient way to pass the sweltering nights,
but my recent experiences and observations are making me seriously question if
it’s worth the risk. Especially with everything else going
on.
Another sweltering night here, the kind where
the air itself feels like it’s weighing you down. I found myself
logged into casino again. It’s usually my nighttime escape
when the heat finally relents.
Honestly, lately, the wins have been like finding water in the desert.
My balance is looking precariously small, and I’m starting to sweat more about the wife
finding out than the actual games. She’s been giving me that look, you
know?
My so-called ‘buddy’ – the one who’s always lurking around,
practically looking over my shoulder – he’s
always on here too. And the infuriating thing?
He’s constantly winning big. Slots like slot_game_1 and slot_game_2,
even that crazy aviator_game where the plane leaves you empty-handed.
He even brags about his wins on slot_game_3 and slot_game_4.
It’s like this place is playing favorites. Makes you wonder, doesn’t it?
Especially with the way he looks at my wife when she’s not looking.
Makes a man uneasy, this heat does.
Despite all that, and maybe it’s just addiction, I still find myself drawn to favorite_slot_game.
There’s something about those colorful candies that keeps me clicking, even when the numbers aren’t falling my way.
Maybe tonight will be different. Maybe the desert
gods will finally throw me a bone. Or maybe my wife will just throw me out.
Either way, here I am, spinning again at sportsbook.
Pros:
Available 24/7 (perfect for my night owl tendencies)
Wide variety of games (even if some seem to favor certain people)
They do have favorite_slot_game, which I genuinely enjoy
Cons:
My personal luck here has been terrible lately
Seeing him win constantly is incredibly frustrating
Starting to seriously impact my household money
and relationships
Overall: Undecided. It’s a handy option to pass the hot evenings, but my recent experiences and observations are making me
seriously question if it’s worth the risk.
Especially with everything else going on.
Another sweltering night here, the kind where the air itself feels like it’s suffocating you.
I found myself logged into sportsbook again. It’s usually my after-dark refuge when the heat finally subsides.
Honestly, lately, the wins have been like finding water in the desert.
My balance is looking dangerously low, and I’m starting to sweat more about the
wife finding out than the actual games. She’s been giving me that look,
you know?
My so-called ‘buddy’ – the one who’s always hanging about, practically shadowing
me – he’s always on here too. And the infuriating thing?
He’s constantly hitting it big. Slots like slot_game_1 and slot_game_2, even that
crazy aviator_game where the plane takes your money
and runs. He even brags about his wins on slot_game_3 and slot_game_4.
It’s like this place is has a soft spot for him. Makes you wonder, doesn’t it?
Especially with the way he looks at my wife when she’s not looking.
Makes a man paranoid, this heat does.
Despite all that, and maybe it’s just foolish hope, I still
find myself drawn to favorite_slot_game. There’s something about those sugary treats that keeps me clicking, even when the numbers aren’t falling
my way.
Maybe tonight will be different. Maybe the gaming spirits will finally throw me a bone.
Or maybe my wife will just throw me out. Either way, here I am, spinning again at casino.
Pros:
Available 24/7 (perfect for my night owl tendencies)
Wide variety of games (even if some seem to favor certain people)
They do have favorite_slot_game, which I genuinely enjoy
Cons:
My personal luck here has been awful recently
Seeing him win constantly is maddening
Starting to seriously impact my finances at home
and relationships
Overall: Divided. It’s a simple method to pass the sweltering nights,
but my recent experiences and observations are making me seriously question if it’s worth the risk.
Especially with everything else going on.
It’s truly a great and helpful piece of info.
I’m glad that you just shared this helpful info with us.
Please stay us informed like this. Thank you for sharing.
Another scorching night here, the kind where the air itself feels like it’s suffocating you.
I found myself logged into casino again. It’s usually my
evening ritual when the heat finally backs off a little.
Honestly, lately, the wins have been few and far between. My
balance is looking dangerously low, and I’m starting to sweat more about the wife finding out than the
actual games. She’s been giving me that look, you know?
My so-called ‘buddy’ – the one who’s always lurking around, practically breathing
down my neck – he’s always on here too. And the infuriating thing?
He’s constantly hitting it big. Slots like slot_game_1 and slot_game_2, even that crazy aviator_game where the plane takes your money and runs.
He even brags about his wins on slot_game_3 and slot_game_4.
It’s like this place is rigged in his favor. Makes you wonder, doesn’t it?
Especially with the way he looks at my wife when she’s
not looking. Makes a man paranoid, this heat does.
Despite all that, and maybe it’s just addiction, I still find myself drawn to
favorite_slot_game. There’s something about those colorful candies that keeps me clicking, even when the numbers aren’t falling my way.
Maybe tonight will be different. Maybe the desert gods will finally throw me a bone.
Or maybe my wife will just throw me out. Either way, here I am,
spinning again at sportsbook.
Pros:
Available 24/7 (perfect for my nocturnal habits)
Wide variety of games (even if some seem to favor certain people)
They do have favorite_slot_game, which I genuinely enjoy
Cons:
My personal luck here has been terrible lately
Seeing him win constantly is incredibly frustrating
Starting to seriously impact my real-life budget and relationships
Overall: Torn. It’s a convenient way to pass the long, heated hours, but my recent
experiences and observations are making me seriously question if it’s worth the risk.
Especially with everything else going on.
Very shortly this website will be famous amid all blog users, due to it’s good
articles
Luckky Feet Shoes Anaheim
5761 Ε Santa Ana Canyon Ɍd ste ⅽ,
Anaheim, СA 92807, United Ѕtates
+17142821000
bunion recovery shoes (Melvin)
Another scorching night here, the kind where the air
itself feels like it’s placing bets against you.
I found myself logged into casino again. It’s usually my after-dark refuge when the heat finally relents.
Honestly, lately, the wins have been rarer than a cool breeze in the daytime.
My balance is looking thinner than my patience, and I’m
starting to sweat more about the wife finding out than the actual games.
She’s been giving me that look, you know?
My so-called ‘friend” – the one who’s always lurking around,
practically looking over my shoulder – he’s always on here too.
And the infuriating thing? He’s constantly on a
lucky streak. Slots like slot_game_1 and slot_game_2, even that crazy aviator_game where the plane flies off with all your hopes.
He even brags about his wins on slot_game_3 and slot_game_4.
It’s like this place is rigged in his favor. Makes you wonder, doesn’t
it? Especially with the way he looks at my wife when she’s not looking.
Makes a man suspicious, this heat does.
Despite all that, and maybe it’s just foolish hope, I still find myself drawn to favorite_slot_game.
There’s something about those sugary treats that keeps me
clicking, even when the numbers aren’t falling my way.
Maybe tonight will be different. Maybe the desert gods will finally throw me a bone.
Or maybe my wife will just throw me out. Either way, here I am, spinning again at casino.
Pros:
Available 24/7 (perfect for my nocturnal habits)
Wide variety of games (even if some seem to favor certain people)
They do have favorite_slot_game, which I genuinely enjoy
Cons:
My personal luck here has been incredibly bad
Seeing him win constantly is enough to make you quit
Starting to seriously impact my household money and relationships
Overall: Undecided. It’s a simple method to pass the long, heated hours, but my recent experiences
and observations are making me seriously question if it’s worth the risk.
Especially with everything else going on.
Heya! I’m at work surfing around your blog from my
new iphone 3gs! Just wanted to say I love reading your blog
and look forward to all your posts! Keep up the great work!
Good day! Do you know if they make any plugins to safeguard against hackers?
I’m kinda paranoid about losing everything
I’ve worked hard on. Any tips?
Another sweltering night here, the kind where the air itself feels like
it’s suffocating you. I found myself logged into casino again. It’s usually my after-dark refuge when the heat finally relents.
Honestly, lately, the wins have been few and far between. My
balance is looking precariously small, and I’m starting to sweat more about the
wife finding out than the actual games. She’s been giving
me that look, you know?
My so-called ‘mate’ – the one who’s always lurking around,
practically breathing down my neck – he’s always on here too.
And the infuriating thing? He’s constantly winning big.
Slots like slot_game_1 and slot_game_2, even that crazy aviator_game where the plane leaves you empty-handed.
He even brags about his wins on slot_game_3 and slot_game_4.
It’s like this place is rigged in his favor. Makes you wonder, doesn’t it?
Especially with the way he looks at my wife when she’s not looking.
Makes a man uneasy, this heat does.
Despite all that, and maybe it’s just stubbornness, I still find myself drawn to favorite_slot_game.
There’s something about those sweet symbols that keeps me clicking, even when the numbers aren’t falling my way.
Maybe tonight will be different. Maybe the gaming spirits will finally
throw me a bone. Or maybe my wife will just throw me out.
Either way, here I am, spinning again at sportsbook.
Pros:
Available 24/7 (perfect for my late-night sessions)
Wide variety of games (even if some seem to favor certain people)
They do have favorite_slot_game, which I genuinely enjoy
Cons:
My personal luck here has been terrible lately
Seeing him win constantly is incredibly frustrating
Starting to seriously impact my finances at home and relationships
Overall: Undecided. It’s a simple method to pass the sweltering nights, but
my recent experiences and observations are making me seriously question if
it’s worth the risk. Especially with everything else going on.
Hello there! This post could not be written much better!
Looking at this post reminds me of my previous roommate! He constantly kept
talking about this. I will send this post to him.
Pretty sure he’s going to have a very good read.
Thank you for sharing!
If you are going for most excellent contents like I do, only
pay a quick visit this website daily for the reason that it gives feature contents,
thanks
Regards, I enjoy it!
First off I would like to say awesome blog! I had a quick question in which I’d like to ask if you don’t mind.
I was curious to find out how you center yourself and clear your thoughts prior to
writing. I have had a difficult time clearing my mind in getting my thoughts out
there. I do take pleasure in writing but it
just seems like the first 10 to 15 minutes are generally wasted
simply just trying to figure out how to begin. Any ideas or hints?
Appreciate it!
Another scorching night here, the kind where the air itself feels
like it’s placing bets against you. I found myself logged into sportsbook again. It’s usually
my after-dark refuge when the heat finally backs off a little.
Honestly, lately, the wins have been rarer than a cool breeze in the daytime.
My balance is looking thinner than my patience, and I’m starting
to sweat more about the wife finding out than the actual games.
She’s been giving me that look, you know?
My so-called ‘friend” – the one who’s always hanging about,
practically shadowing me – he’s always on here too.
And the infuriating thing? He’s constantly hitting it big.
Slots like slot_game_1 and slot_game_2, even that crazy aviator_game where the
plane leaves you empty-handed. He even brags about his wins on slot_game_3
and slot_game_4.
It’s like this place is playing favorites.
Makes you wonder, doesn’t it? Especially with the way he looks at my wife when she’s not looking.
Makes a man suspicious, this heat does.
Despite all that, and maybe it’s just addiction, I still find myself drawn to favorite_slot_game.
There’s something about those sugary treats that keeps me clicking, even when the numbers aren’t falling my way.
Maybe tonight will be different. Maybe the gaming spirits will finally throw me
a bone. Or maybe my wife will just throw me out.
Either way, here I am, spinning again at casino.
Pros:
Available 24/7 (perfect for my nocturnal habits)
Wide variety of games (even if some seem to favor certain people)
They do have favorite_slot_game, which I genuinely enjoy
Cons:
My personal luck here has been awful recently
Seeing him win constantly is incredibly frustrating
Starting to seriously impact my finances at home and
relationships
Overall: Torn. It’s a handy option to pass the sweltering
nights, but my recent experiences and observations are making me seriously question if it’s worth the risk.
Especially with everything else going on.
Another blistering night here, the kind where the air itself feels like it’s weighing you down. I found myself logged into sportsbook again. It’s usually my nighttime escape when the heat finally relents.
Honestly, lately, the wins have been few and
far between. My balance is looking dangerously low,
and I’m starting to sweat more about the wife finding
out than the actual games. She’s been giving me that look, you know?
My so-called ‘mate’ – the one who’s always lurking around,
practically looking over my shoulder – he’s always on here too.
And the infuriating thing? He’s constantly winning big.
Slots like slot_game_1 and slot_game_2, even that crazy aviator_game where
the plane takes your money and runs. He even brags about his wins on slot_game_3 and slot_game_4.
It’s like this place is rigged in his favor. Makes you wonder, doesn’t it?
Especially with the way he looks at my wife when she’s not looking.
Makes a man paranoid, this heat does.
Despite all that, and maybe it’s just foolish hope,
I still find myself drawn to favorite_slot_game.
There’s something about those sugary treats that keeps me clicking,
even when the numbers aren’t falling my way.
Maybe tonight will be different. Maybe the desert gods will finally throw me
a bone. Or maybe my wife will just throw me out. Either way, here I am, spinning again at sportsbook.
Pros:
Available 24/7 (perfect for my late-night sessions)
Wide variety of games (even if some seem to favor certain people)
They do have favorite_slot_game, which I genuinely enjoy
Cons:
My personal luck here has been incredibly bad
Seeing him win constantly is enough to make you quit
Starting to seriously impact my household money and relationships
Overall: Torn. It’s a handy option to pass the hot evenings, but my recent experiences
and observations are making me seriously question if it’s
worth the risk. Especially with everything else going
on.
Another scorching night here, the kind where the air itself feels like it’s suffocating you.
I found myself logged into casino again. It’s usually my evening ritual when the heat finally relents.
Honestly, lately, the wins have been rarer than a cool breeze in the daytime.
My balance is looking dangerously low, and I’m starting to sweat more about the
wife finding out than the actual games. She’s been giving me that look, you know?
My so-called ‘mate’ – the one who’s always sticking close, practically breathing down my neck – he’s always on here
too. And the infuriating thing? He’s constantly hitting it big.
Slots like slot_game_1 and slot_game_2, even that crazy aviator_game where the plane takes your money and runs.
He even brags about his wins on slot_game_3 and slot_game_4.
It’s like this place is playing favorites. Makes you wonder, doesn’t it?
Especially with the way he looks at my wife when she’s not looking.
Makes a man suspicious, this heat does.
Despite all that, and maybe it’s just stubbornness, I still find
myself drawn to favorite_slot_game. There’s something
about those sugary treats that keeps me clicking, even when the numbers aren’t
falling my way.
Maybe tonight will be different. Maybe the desert gods will finally throw me
a bone. Or maybe my wife will just throw me out.
Either way, here I am, spinning again at casino.
Pros:
Available 24/7 (perfect for my nocturnal habits)
Wide variety of games (even if some seem to favor certain people)
They do have favorite_slot_game, which I genuinely enjoy
Cons:
My personal luck here has been terrible lately
Seeing him win constantly is enough to make you quit
Starting to seriously impact my finances at home and relationships
Overall: Torn. It’s a handy option to pass the sweltering nights, but my
recent experiences and observations are making me seriously question if it’s worth the risk.
Especially with everything else going on.
HorsePower Brands Omaha
2525 N 117tһ Ave #300,
Omaha, NΕ 68164, Uniited Ѕtates
14029253112
home services franchising industry
Another scorching night here, the kind where the air
itself feels like it’s suffocating you. I found myself logged
into casino again. It’s usually my nighttime escape when the
heat finally subsides.
Honestly, lately, the wins have been rarer than a cool breeze in the
daytime. My balance is looking precariously small, and
I’m starting to sweat more about the wife finding out than the
actual games. She’s been giving me that look, you know?
My so-called ‘friend” – the one who’s always lurking
around, practically looking over my shoulder – he’s always on here too.
And the infuriating thing? He’s constantly winning big.
Slots like slot_game_1 and slot_game_2, even that crazy aviator_game where the plane leaves you empty-handed.
He even brags about his wins on slot_game_3 and slot_game_4.
It’s like this place is playing favorites. Makes you
wonder, doesn’t it? Especially with the way he looks at my wife when she’s not looking.
Makes a man paranoid, this heat does.
Despite all that, and maybe it’s just foolish hope,
I still find myself drawn to favorite_slot_game. There’s something about those colorful candies that keeps me clicking,
even when the numbers aren’t falling my way.
Maybe tonight will be different. Maybe the luck gods will finally throw me
a bone. Or maybe my wife will just throw me out. Either way, here I am, spinning again at casino.
Pros:
Available 24/7 (perfect for my late-night sessions)
Wide variety of games (even if some seem to favor certain people)
They do have favorite_slot_game, which I genuinely enjoy
Cons:
My personal luck here has been incredibly bad
Seeing him win constantly is enough to make you quit
Starting to seriously impact my real-life budget and relationships
Overall: Torn. It’s a convenient way to pass the hot evenings, but my recent experiences and
observations are making me seriously question if it’s worth the risk.
Especially with everything else going on.
This website was… how do you say it? Relevant!! Finally I’ve found something
that helped me. Kudos!
Добро пожаловать в Водка Казино, платформа для ценителей острых ощущений.
В Водка Казино вы найдете захватывающий геймплей, щедрые
бонусы и выгодные шансы на выигрыш.
Независимо от того, начинающий игрок
вы или опытный геймер, здесь найдется что-то для каждого.
Откройте для себя огромный выбор
игр и попробуйте удачу с каждым спином.
Хотите большие выигрыши? В Водка Казино
мы предлагаем игры с высоким RTP,
чтобы вы могли получать максимальные выигрыши.
Наслаждайтесь захватывающими слотами и классическими картами, и не забывайте про шанс заработать невероятные выигрыши.
Не теряйте времени! В Водка Казино процесс регистрации не займет много
времени, и вы можете начать играть тут
же. Просто создайте аккаунт и
пополните счет, чтобы начать
игру без лишних шагов.
Мы нацелены на то, чтобы
дать вам лучший игровой опыт в Водка Казино.
Наслаждайтесь особенными бонусами, которые помогут повысить шансы на победу и увеличить
ваши шансы на успех. Время вывести
вашу игру на новый уровень с Водка Казино!
Мгновенная регистрация для быстрого доступа.
Щедрые бонусы для новичков.
Регулярные турниры и акции,
чтобы дать вам ещё больше шансов на выигрыш.
Помощь 24/7 для решения любых вопросов.
Удобный мобильный интерфейс для игры на ходу.
Эксклюзивные бонусы и награды для постоянных игроков.
Присоединяйтесь и начинайте выигрывать в Водка Казино — идеальная площадка для осуществления ваших азартных мечт! https://vodka-fortunecasino.boats/
Great web site you have here.. It’s hard to
find high-quality writing like yours these days. I truly appreciate people like you!
Take care!!
Hello would you mind sharing which blog platform you’re working with?
I’m looking to start my own blog soon but I’m having a hard time selecting between BlogEngine/Wordpress/B2evolution and Drupal.
The reason I ask is because your design and style seems
different then most blogs and I’m looking for something unique.
P.S My apologies for getting off-topic but I had to
ask!
Another sweltering night here, the kind where the air itself feels like it’s
weighing you down. I found myself logged into casino again. It’s usually my evening ritual when the heat finally relents.
Honestly, lately, the wins have been few and far between. My
balance is looking thinner than my patience, and
I’m starting to sweat more about the wife finding out than the actual games.
She’s been giving me that look, you know?
My so-called ‘friend” – the one who’s always sticking close, practically breathing down my neck – he’s always on here
too. And the infuriating thing? He’s constantly
on a lucky streak. Slots like slot_game_1 and slot_game_2, even that crazy aviator_game
where the plane flies off with all your hopes.
He even brags about his wins on slot_game_3
and slot_game_4.
It’s like this place is rigged in his favor.
Makes you wonder, doesn’t it? Especially with the way he looks at my wife when she’s
not looking. Makes a man uneasy, this heat does.
Despite all that, and maybe it’s just foolish hope, I still find myself drawn to favorite_slot_game.
There’s something about those sugary treats that keeps me clicking, even when the numbers aren’t falling my way.
Maybe tonight will be different. Maybe the desert gods will
finally throw me a bone. Or maybe my wife will just throw me out.
Either way, here I am, spinning again at sportsbook.
Pros:
Available 24/7 (perfect for my night owl tendencies)
Wide variety of games (even if some seem to favor
certain people)
They do have favorite_slot_game, which I genuinely enjoy
Cons:
My personal luck here has been incredibly bad
Seeing him win constantly is incredibly frustrating
Starting to seriously impact my real-life budget and relationships
Overall: Undecided. It’s a convenient way to pass the hot evenings, but
my recent experiences and observations are making me seriously question if it’s worth the risk.
Especially with everything else going on.
Heya i am for the first time here. I came across this board and I to find It really helpful & it helped me out a lot.
I am hoping to offer something back and aid others such as you aided me.
Write more, thats all I have to say. Literally, it seems
as though you relied on the video to make your point.
You obviously know what youre talking about, why throw away your intelligence on just posting
videos to your weblog when you could be giving us something enlightening to read?
This website certainly has all of the info I wanted concerning this subject and didn’t know who to
ask.
The other day, while I was at work, my sister stole my apple ipad and tested to see if it
can survive a 30 foot drop, just so she can be a youtube sensation. My apple ipad is now broken and she has 83 views.
I know this is completely off topic but I had to share it with someone!
Jetton Casino – это место, где каждый игрок может испытать свою удачу и
насладиться азартом. В нашем
казино вас ждут топовые игровые автоматы, рулетка, покер и эксклюзивные акции.
Присоединяйтесь и получайте бонусы для успешного старта.
Почему выбирают джетон казино официальный сайт?
Мы ценим каждого игрока и создаем лучшие
условия для комфортной игры.
Еженедельные турниры, программы лояльности и персональные подарки делают игру еще
интереснее. Ваши финансы и личные
данные в полной безопасности.
Огромный выбор слотов, карточных игр
и лайв-казино.
Персональные предложения и приятные сюрпризы.
Быстрое пополнение счета и моментальный вывод выигрышей.
Конкурсы для азартных игроков с ценными наградами.
Jetton Casino – это идеальное место для тех, кто любит
азарт и большие выигрыши. https://jetton-casinochampion.makeup/
Excellent site you’ve got here.. It’s difficult to find
high quality writing like yours these days.
I truly appreciate individuals like you! Take care!!
Another sweltering night here, the kind where the air
itself feels like it’s weighing you down. I found myself logged into casino again. It’s usually my evening ritual
when the heat finally relents.
Honestly, lately, the wins have been rarer than a cool breeze in the daytime.
My balance is looking thinner than my patience, and I’m starting to sweat more about
the wife finding out than the actual games. She’s been giving me that look, you know?
My so-called ‘buddy’ – the one who’s always sticking close,
practically breathing down my neck – he’s always on here too.
And the infuriating thing? He’s constantly winning big.
Slots like slot_game_1 and slot_game_2, even that crazy aviator_game where the plane
flies off with all your hopes. He even brags
about his wins on slot_game_3 and slot_game_4.
It’s like this place is has a soft spot for him. Makes you wonder, doesn’t it?
Especially with the way he looks at my wife when she’s not looking.
Makes a man uneasy, this heat does.
Despite all that, and maybe it’s just addiction, I still find
myself drawn to favorite_slot_game. There’s something about those sugary treats
that keeps me clicking, even when the numbers aren’t falling my way.
Maybe tonight will be different. Maybe the luck gods will finally throw me
a bone. Or maybe my wife will just throw me out. Either way, here I am, spinning
again at sportsbook.
Pros:
Available 24/7 (perfect for my night owl tendencies)
Wide variety of games (even if some seem to favor certain people)
They do have favorite_slot_game, which I genuinely enjoy
Cons:
My personal luck here has been awful recently
Seeing him win constantly is enough to make you quit
Starting to seriously impact my finances at home and relationships
Overall: Divided. It’s a handy option to pass the hot evenings,
but my recent experiences and observations are making me seriously question if it’s worth the risk.
Especially with everything else going on.
I every time used to read paragraph in news papers but now
as I am a user of internet thus from now I am using net
for content, thanks to web.
Comment:
I found this blog post to be very informative and well-researched.
The author provides a comprehensive analysis of the current state
of the housing market, including data on permits, starts, and completions.
I appreciate the inclusion of graphs and charts, which help to visualize the trends in the data.
One thing that stood out to me was the discussion of permit slowdowns and the potential implications
for the broader economy. I think this is an important point to consider,
especially given the recent downturn in the housing market.
I also found the analysis of mortgage applications and spreads to be
insightful. The author does a good job of explaining how these factors can impact the housing market and overall economic growth.
Overall, I think this is a valuable resource for anyone interested in the housing market and its potential
impact on the economy. I look forward to reading more from this author in the future.
Very well expressed of course. !
Another scorching night here, the kind where the air
itself feels like it’s suffocating you. I found myself
logged into sportsbook again. It’s usually my after-dark refuge when the heat finally relents.
Honestly, lately, the wins have been few and far between. My
balance is looking precariously small, and I’m starting to sweat more about the wife finding out than the
actual games. She’s been giving me that look, you know?
My so-called ‘friend” – the one who’s always lurking around, practically breathing down my neck – he’s always on here too.
And the infuriating thing? He’s constantly winning big.
Slots like slot_game_1 and slot_game_2, even that crazy
aviator_game where the plane flies off with all your hopes.
He even brags about his wins on slot_game_3 and slot_game_4.
It’s like this place is rigged in his favor. Makes you wonder,
doesn’t it? Especially with the way he looks at my wife when she’s not looking.
Makes a man uneasy, this heat does.
Despite all that, and maybe it’s just addiction, I still
find myself drawn to favorite_slot_game. There’s something about those
sweet symbols that keeps me clicking, even when the numbers aren’t falling my way.
Maybe tonight will be different. Maybe the gaming spirits will finally throw me a bone.
Or maybe my wife will just throw me out. Either way, here I am, spinning again at sportsbook.
Pros:
Available 24/7 (perfect for my nocturnal habits)
Wide variety of games (even if some seem to favor certain people)
They do have favorite_slot_game, which I genuinely enjoy
Cons:
My personal luck here has been terrible lately
Seeing him win constantly is incredibly frustrating
Starting to seriously impact my finances at home and relationships
Overall: Torn. It’s a simple method to pass the long, heated hours, but
my recent experiences and observations are making me seriously question if it’s worth
the risk. Especially with everything else going on.
fantastic points altogether, you just won a new reader.
What may you recommend about your post that you made a few days in the past?
Any positive?
I’d like to find out more? I’d love to find out more details.
Another blistering night here, the kind where the air itself feels like it’s suffocating you.
I found myself logged into sportsbook again. It’s usually my nighttime escape when the
heat finally subsides.
Honestly, lately, the wins have been like finding water in the desert.
My balance is looking precariously small, and I’m starting to sweat more about the
wife finding out than the actual games. She’s been giving me that
look, you know?
My so-called ‘buddy’ – the one who’s always hanging about,
practically shadowing me – he’s always on here too.
And the infuriating thing? He’s constantly on a lucky streak.
Slots like slot_game_1 and slot_game_2, even that crazy aviator_game where the plane takes your money and runs.
He even brags about his wins on slot_game_3 and slot_game_4.
It’s like this place is rigged in his favor. Makes you wonder, doesn’t it?
Especially with the way he looks at my wife when she’s not looking.
Makes a man suspicious, this heat does.
Despite all that, and maybe it’s just stubbornness, I still find myself
drawn to favorite_slot_game. There’s something about
those sugary treats that keeps me clicking, even when the numbers aren’t falling my way.
Maybe tonight will be different. Maybe the gaming spirits
will finally throw me a bone. Or maybe my wife will just throw me out.
Either way, here I am, spinning again at casino.
Pros:
Available 24/7 (perfect for my late-night sessions)
Wide variety of games (even if some seem to favor certain people)
They do have favorite_slot_game, which I genuinely enjoy
Cons:
My personal luck here has been awful recently
Seeing him win constantly is incredibly frustrating
Starting to seriously impact my household money and relationships
Overall: Torn. It’s a convenient way to pass the sweltering nights, but my recent experiences and observations are making me seriously
question if it’s worth the risk. Especially with everything else going on.
Aƅove All Foundation Repair
119 Ꭼ Turbo Dг, San Antonio,
TX 78216, United Stаtes
12109203042
Base stability repair service
A continuación, da clic sobre el APK de Snaptube y deja que tu navegador instale la app en tu
dispositivo.
Thank you for the auspicious writeup. It in truth was a leisure account
it. Glance complex to more brought agreeable from you!
By the way, how could we keep up a correspondence?
What’s up, just wanted to say, I enjoyed this blog post.
It was helpful. Keep on posting!
Another scorching night here, the kind where the air itself feels
like it’s suffocating you. I found myself logged into sportsbook again. It’s usually my evening ritual when the heat finally relents.
Honestly, lately, the wins have been like finding water in the desert.
My balance is looking thinner than my patience,
and I’m starting to sweat more about the wife finding out than the actual games.
She’s been giving me that look, you know?
My so-called ‘friend” – the one who’s always hanging about, practically breathing
down my neck – he’s always on here too. And the infuriating thing?
He’s constantly winning big. Slots like slot_game_1 and slot_game_2, even that
crazy aviator_game where the plane takes your money and runs.
He even brags about his wins on slot_game_3 and slot_game_4.
It’s like this place is has a soft spot for him. Makes you wonder,
doesn’t it? Especially with the way he looks at my wife when she’s not looking.
Makes a man paranoid, this heat does.
Despite all that, and maybe it’s just addiction, I still find myself drawn to favorite_slot_game.
There’s something about those sugary treats that keeps me clicking, even when the numbers aren’t falling my
way.
Maybe tonight will be different. Maybe the gaming spirits will finally throw me a bone.
Or maybe my wife will just throw me out. Either way, here I am, spinning again at casino.
Pros:
Available 24/7 (perfect for my night owl tendencies)
Wide variety of games (even if some seem to favor certain people)
They do have favorite_slot_game, which I genuinely enjoy
Cons:
My personal luck here has been terrible lately
Seeing him win constantly is incredibly frustrating
Starting to seriously impact my finances at home and relationships
Overall: Divided. It’s a simple method to pass the long,
heated hours, but my recent experiences and observations are
making me seriously question if it’s worth the risk.
Especially with everything else going on.
CIR Legal Lexington
201 Ꮃ Short St #500,
Lexington, KY 40507, United Statеѕ
+18596366803
what іs private defence іn criminal law
Another blistering night here, the kind where the air itself
feels like it’s weighing you down. I found myself logged into
casino again. It’s usually my after-dark refuge when the heat finally backs off a
little.
Honestly, lately, the wins have been rarer than a cool breeze in the daytime.
My balance is looking thinner than my patience, and I’m starting to sweat more
about the wife finding out than the actual games. She’s been giving me that look,
you know?
My so-called ‘friend” – the one who’s always lurking
around, practically shadowing me – he’s always on here
too. And the infuriating thing? He’s constantly hitting it big.
Slots like slot_game_1 and slot_game_2, even that crazy aviator_game where the plane
leaves you empty-handed. He even brags about his wins on slot_game_3 and slot_game_4.
It’s like this place is has a soft spot for him. Makes you
wonder, doesn’t it? Especially with the way he looks at my wife when she’s not
looking. Makes a man uneasy, this heat does.
Despite all that, and maybe it’s just stubbornness, I still find myself drawn to favorite_slot_game.
There’s something about those colorful candies that keeps me clicking,
even when the numbers aren’t falling my way.
Maybe tonight will be different. Maybe the luck gods will finally throw me a bone.
Or maybe my wife will just throw me out. Either way, here I am, spinning
again at casino.
Pros:
Available 24/7 (perfect for my night owl tendencies)
Wide variety of games (even if some seem to favor certain people)
They do have favorite_slot_game, which I genuinely
enjoy
Cons:
My personal luck here has been terrible lately
Seeing him win constantly is maddening
Starting to seriously impact my real-life budget and relationships
Overall: Undecided. It’s a convenient way to pass the hot
evenings, but my recent experiences and observations
are making me seriously question if it’s worth the
risk. Especially with everything else going on.
Please let me know if you’relooking for a writer for your weblog.
You have some really great articles and I believe I would be
a good asset. If you ever want to take some of the load off, I’d love to write some material for your
blog in exchange for a link back to mine. Please shoot me an e-mail if interested.Regards!
Thanks very nice blog!
Thanks a bunch for sharing this with all of us you actually understand
what you are talking approximately! Bookmarked. Please additionally visit my site =).
We can have a hyperlink alternate arrangement between us
Another blistering night here, the kind where the air itself feels like it’s weighing you down. I found
myself logged into sportsbook again. It’s usually my evening ritual
when the heat finally backs off a little.
Honestly, lately, the wins have been rarer than a cool breeze in the daytime.
My balance is looking precariously small, and I’m starting to sweat more about the wife finding out than the actual games.
She’s been giving me that look, you know?
My so-called ‘mate’ – the one who’s always sticking
close, practically shadowing me – he’s always on here too.
And the infuriating thing? He’s constantly winning big. Slots like slot_game_1 and slot_game_2,
even that crazy aviator_game where the plane takes your money and runs.
He even brags about his wins on slot_game_3 and slot_game_4.
It’s like this place is playing favorites. Makes you wonder, doesn’t it?
Especially with the way he looks at my wife when she’s not looking.
Makes a man paranoid, this heat does.
Despite all that, and maybe it’s just stubbornness, I still find myself drawn to
favorite_slot_game. There’s something about those sweet symbols
that keeps me clicking, even when the numbers aren’t falling my
way.
Maybe tonight will be different. Maybe the luck gods will
finally throw me a bone. Or maybe my wife will just throw me out.
Either way, here I am, spinning again at sportsbook.
Pros:
Available 24/7 (perfect for my late-night sessions)
Wide variety of games (even if some seem to favor
certain people)
They do have favorite_slot_game, which I genuinely enjoy
Cons:
My personal luck here has been incredibly bad
Seeing him win constantly is enough to make you quit
Starting to seriously impact my household money and relationships
Overall: Torn. It’s a simple method to pass the hot evenings, but my
recent experiences and observations are making me seriously question if it’s
worth the risk. Especially with everything else going on.
Really nice pattern and superb written content, practically nothing else we require :D.
Usually I do not learn post on blogs, however I would
like to say that this write-up very compelled me to take a look at and do it!
Your writing style has been amazed me. Thank you,
very great post.
Another sweltering night here, the kind where the air itself
feels like it’s placing bets against you. I found myself logged into casino again. It’s usually my
nighttime escape when the heat finally backs off a little.
Honestly, lately, the wins have been rarer than a cool breeze in the daytime.
My balance is looking dangerously low, and I’m starting to
sweat more about the wife finding out than the actual games.
She’s been giving me that look, you know?
My so-called ‘mate’ – the one who’s always lurking around, practically looking over my shoulder – he’s always on here too.
And the infuriating thing? He’s constantly on a lucky
streak. Slots like slot_game_1 and slot_game_2, even that crazy aviator_game where the plane takes your money and runs.
He even brags about his wins on slot_game_3 and slot_game_4.
It’s like this place is playing favorites. Makes you
wonder, doesn’t it? Especially with the way he looks at my wife when she’s not looking.
Makes a man paranoid, this heat does.
Despite all that, and maybe it’s just stubbornness, I still find myself drawn to favorite_slot_game.
There’s something about those sweet symbols that keeps
me clicking, even when the numbers aren’t falling my
way.
Maybe tonight will be different. Maybe the desert gods will finally
throw me a bone. Or maybe my wife will just throw me out.
Either way, here I am, spinning again at sportsbook.
Pros:
Available 24/7 (perfect for my late-night
sessions)
Wide variety of games (even if some seem to favor certain people)
They do have favorite_slot_game, which I genuinely enjoy
Cons:
My personal luck here has been incredibly bad
Seeing him win constantly is maddening
Starting to seriously impact my real-life budget and relationships
Overall: Undecided. It’s a convenient way to pass the hot evenings,
but my recent experiences and observations are making me seriously question if it’s
worth the risk. Especially with everything else going on.
Hey just wanted to give you a brief heads up and let you know a
few of the pictures aren’t loading correctly.
I’m not sure why but I think its a linking issue.
I’ve tried it in two different web browsers and both show the same outcome.
Excellent blog you’ve got here.. It’s difficult to find high-quality writing like yours
these days. I seriously appreciate people like you!
Take care!!
AЬove Aⅼl Foundation Repair
119 E Turbo Dr, San Antonio,
TX 78216, United Տtates
12109203042
Timber and structural fixing service
Another blistering night here, the kind where the air itself feels like it’s weighing you down. I found myself logged into casino again. It’s usually my nighttime escape when the heat finally subsides.
Honestly, lately, the wins have been like
finding water in the desert. My balance is looking thinner than my patience, and
I’m starting to sweat more about the wife finding out than the
actual games. She’s been giving me that look, you know?
My so-called ‘mate’ – the one who’s always sticking close, practically shadowing me – he’s always on here too.
And the infuriating thing? He’s constantly on a lucky streak.
Slots like slot_game_1 and slot_game_2, even that crazy aviator_game where
the plane flies off with all your hopes. He even brags
about his wins on slot_game_3 and slot_game_4.
It’s like this place is rigged in his favor. Makes you wonder, doesn’t it?
Especially with the way he looks at my wife when she’s not looking.
Makes a man suspicious, this heat does.
Despite all that, and maybe it’s just stubbornness, I still
find myself drawn to favorite_slot_game. There’s something about
those sugary treats that keeps me clicking, even when the numbers
aren’t falling my way.
Maybe tonight will be different. Maybe the luck gods will finally throw me a bone.
Or maybe my wife will just throw me out. Either way, here I am, spinning again at sportsbook.
Pros:
Available 24/7 (perfect for my night owl tendencies)
Wide variety of games (even if some seem to favor certain people)
They do have favorite_slot_game, which I genuinely enjoy
Cons:
My personal luck here has been awful recently
Seeing him win constantly is maddening
Starting to seriously impact my household money and relationships
Overall: Divided. It’s a simple method to pass the sweltering nights, but
my recent experiences and observations are making me
seriously question if it’s worth the risk. Especially with everything else going on.
You’re so awesome! I don’t think I’ve read a single thing like that before.
So nice to discover someone with original thoughts on this subject.
Really.. many thanks for starting this up. This website is one thing that is required on the web,
someone with some originality!
Thanks for your personal marvelous posting! I definitely enjoyed reading it,
you can be a great author. I will always bookmark your blog and may come
back from now on. I want to encourage continue your great posts, have a nice morning!
Another blistering night here, the kind where the air itself feels like it’s suffocating you.
I found myself logged into casino again. It’s usually my evening
ritual when the heat finally relents.
Honestly, lately, the wins have been rarer than a cool breeze in the daytime.
My balance is looking precariously small, and I’m starting to sweat more about the wife
finding out than the actual games. She’s been giving me that look, you know?
My so-called ‘friend” – the one who’s always hanging
about, practically looking over my shoulder – he’s always on here
too. And the infuriating thing? He’s constantly hitting
it big. Slots like slot_game_1 and slot_game_2, even that crazy aviator_game where the plane takes
your money and runs. He even brags about his wins on slot_game_3 and slot_game_4.
It’s like this place is has a soft spot for him. Makes you
wonder, doesn’t it? Especially with the way he looks at my wife when she’s not looking.
Makes a man suspicious, this heat does.
Despite all that, and maybe it’s just foolish hope, I still
find myself drawn to favorite_slot_game. There’s something about those sugary treats that keeps me clicking, even when the numbers aren’t
falling my way.
Maybe tonight will be different. Maybe the luck gods will
finally throw me a bone. Or maybe my wife will just throw me out.
Either way, here I am, spinning again at casino.
Pros:
Available 24/7 (perfect for my late-night sessions)
Wide variety of games (even if some seem to
favor certain people)
They do have favorite_slot_game, which I genuinely
enjoy
Cons:
My personal luck here has been incredibly bad
Seeing him win constantly is incredibly frustrating
Starting to seriously impact my finances at home and relationships
Overall: Divided. It’s a simple method to pass the long, heated hours, but
my recent experiences and observations are making
me seriously question if it’s worth the risk. Especially with everything else going on.
Another sweltering night here, the kind where the air itself feels like it’s weighing you down. I found myself
logged into sportsbook again. It’s usually my evening ritual when the heat finally relents.
Honestly, lately, the wins have been like finding water in the desert.
My balance is looking precariously small, and I’m starting to sweat
more about the wife finding out than the actual games. She’s been giving me that look, you know?
My so-called ‘friend” – the one who’s always lurking around, practically shadowing me – he’s
always on here too. And the infuriating thing?
He’s constantly winning big. Slots like slot_game_1 and slot_game_2, even that crazy aviator_game where the plane takes your money and runs.
He even brags about his wins on slot_game_3 and slot_game_4.
It’s like this place is rigged in his favor.
Makes you wonder, doesn’t it? Especially with the
way he looks at my wife when she’s not looking. Makes a man uneasy,
this heat does.
Despite all that, and maybe it’s just addiction, I still find myself drawn to favorite_slot_game.
There’s something about those sugary treats that keeps me clicking, even when the
numbers aren’t falling my way.
Maybe tonight will be different. Maybe the desert gods will finally
throw me a bone. Or maybe my wife will just throw me out.
Either way, here I am, spinning again at casino.
Pros:
Available 24/7 (perfect for my night owl tendencies)
Wide variety of games (even if some seem to favor certain people)
They do have favorite_slot_game, which I genuinely
enjoy
Cons:
My personal luck here has been incredibly bad
Seeing him win constantly is maddening
Starting to seriously impact my real-life budget and relationships
Overall: Divided. It’s a handy option to pass the hot evenings, but my recent experiences and observations
are making me seriously question if it’s worth the
risk. Especially with everything else going on.
Рады приветствовать в Водка Казино — место, где восторг сочетается с невероятными бонусами и
возможностями для выигрыша. У нас каждый игрок найдет свои любимые игры, будь то начинающий или профессионал.
Здесь вы не только получите
отличные впечатления, но и множество бонусов.
Игры в Водка Казино имеет высокие RTP,
что повышает ваши шансы на успех.
Мы подготовили интерактивные игровые автоматы и популярные карточные игры, которые делают игровой процесс еще более увлекательным и
прибыльным.
Зачем ждать в очереди? В Водка Казино
вы можете зарегистрироваться за
считанные секунды и легко пополнить свой счет, не
тратя время на лишние шаги, чтобы начать сразу погрузиться
в азарт.
Мы всегда готовы предложить вам
выгодные предложения для того, чтобы вы могли получить больше шансов на выигрыш.
Присоединяйтесь к Водка Казино, чтобы наслаждаться игрой
с лучшими шансами на победу!
Регистрация без задержек.
Щедрые бонусы для первых игроков.
Регулярные турниры и акции для тех, кто хочет повысить свои шансы на победу.
Круглосуточная поддержка, чтобы помочь
вам в любой момент.
Мобильная версия.
Погрузитесь в азартный мир Водка Казино и проверьте,
насколько удачным окажется ваш ход! https://vodka-casinosphere.space/
Very great post. I just stumbled upon your blog and wanted
to say that I have really loved surfing around your blog posts.
After all I’ll be subscribing to your rss feed and I’m hoping you write once more very soon!
With havin so much content and articles do you ever run into any problems of plagorism or copyright violation? My blog has a lot
of unique content I’ve either written myself or outsourced but
it looks like a lot of it is popping it up all over
the web without my agreement. Do you know any methods to help
protect against content from being stolen? I’d definitely appreciate
it.
Hi there, I would like to subscribe for this blog to obtain most
up-to-date updates, therefore where can i do it please assist.
of course like your web-site but you need to test
the spelling on several of your posts. Many of them are rife with spelling problems
and I in finding it very troublesome to inform the truth
nevertheless I’ll certainly come back again.
Hello, I think your site might be having browser compatibility issues.
When I look at your website in Opera, it looks
fine but when opening in Internet Explorer, it has some overlapping.
I just wanted to give you a quick heads up!
Other then that, excellent blog!
Today, while I was at work, my cousin stole my apple ipad and tested to see if it can survive a twenty five
foot drop, just so she can be a youtube sensation. My iPad is now broken and she has 83 views.
I know this is totally off topic but I had to share it with someone!
Добро пожаловать в Booi Casino – место, где азарт и увлекательные игры встречаются с большими победами. У нас вы найдете не только популярные игровые автоматы, но и разнообразие настольных игр, рулетку, покер и уникальные live-игры. В Booi Casino мы ценим доверие наших игроков и обеспечиваем безопасную и честную игровую среду.
Что делает Booi Casino идеальным выбором для вашего игрового досуга? С нами вы можете быть уверены в быстроте выплат и надежности всех транзакций. Наши бонусы, акции и эксклюзивные предложения создадут незабываемые впечатления от игры.
Когда начать играть в Booi Casino? Присоединяйтесь к нам прямо сейчас и воспользуйтесь всеми преимуществами казино. Вот что ждёт вас:
Приветственные бонусы для новичков.
Примите участие в турнирах и получите шанс выиграть уникальные призы.
Постоянные обновления каталога игр.
Booi Casino – это ваш шанс испытать удачу и стать победителем. https://booi-gamestorm.monster/
Robert Eubanks began treatment for erectile dysfunction with Viagra in 2000.
Eubanks continued using the drug regularly until 2013, when he made the switch
to Cialis (an ED medicine manufactured by Eli Lilly).
Magnificent goods from you, man. I have understand your stuff previous
to and you are just too wonderful. I actually like what you have acquired here, really like what you’re saying and the way
in which you say it. You make it entertaining and you still take care of to keep
it smart. I cant wait to read much more from you.
This is actually a great web site.
Откройте для себя мир азарта в Kometa Casino — платформа для настоящих ценителей игр,
где вас ждут популярные слоты, классические настольные игры,
а также щедрые бонусы, которые
помогут увеличить выигрыш!
Комета казино бонус.
Какие преимущества у Kometa Casino?
Мгновенные выплаты без скрытых платежей.
Огромный выбор игр на любой
вкус.
Эксклюзивные предложения, делающие игру ещё выгоднее.
Начните играть прямо сейчас и
почувствуйте настоящий азарт! https://kometa-777-spin.bond/
Appreciate the recommendation. Will try it out.
Лев Казино — это место, где каждая игра обещает вам невероятные эмоции и шанс на выигрыш. Здесь вы можете наслаждаться широким выбором игр, включая слоты, настольные игры и многое другое. Независимо от вашего уровня опыта, мы обеспечим вам комфортное и безопасное игровое пространство.
Чтобы начать играть в https://lev-casinovista.website/, вам нужно всего лишь зарегистрироваться, и вы сразу получите доступ ко всем функциям. Мы обеспечиваем приветственные бонусы и эксклюзивные предложения для новичков, чтобы вы могли быстрее начать выигрывать. С нами вы можете играть круглосуточно, наслаждаясь всеми преимуществами онлайн-казино с отличной репутацией.
Множество способов пополнения счета и вывода средств.
Мы регулярно проводим акции, которые помогут вам увеличить ваш игровой баланс.
Лев Казино предлагает удобный и интуитивно понятный интерфейс, а также мобильную версию для игры на ходу.
Наша служба поддержки всегда готова помочь вам в любое время дня и ночи.
Присоединяйтесь к Лев Казино и начните выигрывать прямо сегодня!
Thanks designed for sharing such a nice thought, piece of writing is good,
thats why i have read it entirely
В Vovan Casino вы сможете насладиться в атмосферу азартного отдыха. Здесь вы найдете богатому выбору развлечений, включая слоты, карточные игры, рулетку и многое другое. Кроме того, многие клиенты ищут дополнительные возможности, чтобы повысить свои шансы на выигрыш и получить больше удовольствия. Исследования подтверждают, что подавляющее большинство клиентов активно участвуют в специальных мероприятиях, что делает их шансы на победу выше. Участие в турнирах и предложениях Vovan Casino — это шаг, который позволите себе сэкономить время, а также насладитесь захватывающим процессом игры. Каждая игра — это шанс стать победителем, не теряя времени даром — https://vovan-gameecho.space/. Когда начать игру в Vovan Casino? В любое время! Есть множество причин, когда стоит воспользоваться нашими предложениями: Перед тем как начать, рекомендуется ознакомиться с нашими правилами и положениями. Если вы опытный игрок, попробуйте воспользоваться нашими особенными условиями, чтобы добиться максимального результата и удовольствия. После долгого перерыва, стоит начать с демо-версий, чтобы освежить свои навыки.
Franchising Paath Escondido
Escondido, ⅭА 92025, United Ⴝtates
+18582803820
franchise consulting firm
Many thanks, Plenty of facts.
Helpful information. Lucky me I discovered your website unintentionally, and I am shocked why this coincidence didn’t came about earlier!
I bookmarked it.
Lucky Feet Shoes Anaheim
5761 Ꭼ Santa Ana Canyon Rd stte c,
Anaheim, СA 92807, United States
+17142821000
Bookmarks – http://www.protopage.com,
Центр душевых кабин предлагает широкий ассортимент качественных товаров это
душевой уголки 80х80 для ванной комнаты.
Мы сотрудничаем с ведущими производителями и
предоставляем гарантию качества на все товары.
Наши опытные специалисты помогут вам
выбрать подходящую душевую кабину и проконсультируют по любым вопросам.
У нас вы найдёте всё необходимое для создания идеальной
ванной комнаты.
Наши преимущества:
– высокое качество товаров;
– доступные цены;
– большой выбор;
– профессиональные консультации;
– гарантия качества;
– быстрая доставка и установка.
Не упустите возможность обновить вашу ванную комнату с помощью наших
душевых кабин! Заходите на наш сайт, чтобы найти свою
идеальную душевую кабину!
Добро пожаловать в AdmiralX Casino для всех любителей онлайн-гемблинга! Здесь вас ждет невероятный выбор игровых автоматов, захватывающие состязания и быстрые транзакции. Воспользуйтесь бонусами и заберите свой приз! https://admiralx-levelglide.quest/.
Что делает AdmiralX Casino особенным?
Уникальные акции на регулярной основе.
Высокие лимиты на вывод, обеспечивающая комфортное использование средств.
Удобный сайт, созданный для максимального комфорта.
Насладитесь азартом вместе с AdmiralX Casino!
Добро пожаловать в Hype Casino — уникальное онлайн-казино, представляющее топовые слоты, популярные настольные игры, а также эксклюзивные предложения, помогающие увеличить ваши выигрыши! https://hype-funripple.space/.
Какие преимущества предлагает Hype Casino?
Быстрые финансовые операции и скрытых платежей.
Разнообразие развлечений для любого вкуса.
Щедрые акции и турниры, повышающие шансы на победу.
Начните играть прямо сейчас и получите шанс на крупный выигрыш!
I all the time used to study piece of writing in news papers but now as I am a user of internet therefore from now
I am using net for posts, thanks to web.
I am truly thankful to the owner of this
web site who has shared this great paragraph at here.
Добро пожаловать в Jetton Casino
– мир развлечений и больших выигрышей.
В нашем казино вас ждёт широкий выбор игр, щедрые акции и незабываемые
впечатления. Присоединяйтесь
к нам и начните своё путешествие в мире
азарта прямо сейчас.
Что делает Джеттон игра с выводом особенным?
Мы предлагаем честную игру, моментальные
выплаты и круглосуточную поддержку.
Каждый пользователь может рассчитывать на специальные
акции и эксклюзивные награды.
Коллекция лучших азартных развлечений от мировых провайдеров.
Щедрые бонусы, фриспины и программа лояльности
для постоянных игроков.
Быстрые выплаты и безопасные транзакции без задержек.
Турниры с крупными призовыми фондами и возможность
выиграть джекпот.
Jetton Casino – это ваш ключ к миру азарта и крупных выигрышей. https://jetton-casinoempire.skin/
В казино Ramenbet вы обнаружите премиум-качество обслуживание. Мы предлагаем широкий выбор игровых автоматов, среди которых рулетка, блэкджек, покер и слоты. Однако, многие энтузиастов стремятся достигнуть высочайшее уровень игрового опыта. По статистике, основная часть наших пользователей регулярно участвует в акциях, что помогает им существенно улучшить шансы на успех и насладиться игрой. Участие в наших турнирах и акциях — это разумный шаг, который может сэкономить ваши ресурсы, а также предоставит возможность наслаждаться игрой. Каждый турнир в нашем казино — это возможность быстро найти то, что вам нравится, не теряя драгоценного времени – https://ramenbet-888-spin.click/ .
Когда имеет смысл играть в наших играх? В любое время!
Существуют ситуации, когда следует сэкономить время и легко воспользоваться нашими предложениями в Ramenbet Casino:
Прежде чем начать, рекомендуем изучить нашими правилами.
Если вы профессионал в играх, воспользуйтесь нашими VIP-условиями для повышения ваших шансов на победу.
После пропуска времени рекомендуем начать с демо-игр, чтобы обновить свои навыки.
I’ve been surfing online more than 2 hours today,
yet I never found any interesting article like yours.
It is pretty worth enough for me. In my opinion, if all site owners and bloggers made good content
as you did, the web will be a lot more useful than ever before.
Добро пожаловать в Booi Casino – место, где каждый может испытать свою удачу и стать победителем. Мы предлагаем широкий выбор игр, включая лучшие игровые автоматы, настольные игры, рулетку, покер и live-игры с профессиональными дилерами. В Booi Casino безопасность игроков на первом месте, и все наши игры проходят строгие проверки на честность.
Почему стоит играть в Booi Casino? В Booi Casino вас ждут щедрые бонусы и акции, которые сделают вашу игру более увлекательной. Платежи у нас проходят быстро, а команда поддержки всегда готова помочь в любое время.
Когда лучше всего начать играть в Booi Casino? Регистрация открыта круглосуточно, и прямо сейчас вас ждут невероятные бонусы. Вот что вас ждет:
Приветственные бонусы, которые увеличат ваш стартовый капитал.
Участие в турнирах с потрясающими призами.
Регулярные обновления в игровом каталоге.
Booi Casino – это не просто игры, это возможность выиграть большие деньги и получить массу эмоций. https://booi-zone.top/
Вас приветствует Stake Casino — место, где вас ждут потрясающие слоты, щедрые акции и потенциал для крупных выигрышей. https://stake-xpboost.wiki/.
Что отличает Stake Casino?
Интуитивно понятный интерфейс для игроков всех уровней.
Уникальные игры от ведущих провайдеров.
Выгодные акции для новичков и постоянных игроков.
Возможность играть с мобильного — играйте где угодно!
Не откладывайте, начните играть в Stake Casino и выигрывать прямо сейчас!
Admiring the persistence you put into your website and in depth information you offer.
It’s awesome to come across a blog every once in a while that isn’t the same unwanted rehashed information. Great read!
I’ve saved your site and I’m including your RSS feeds to my Google account.
Franchising Path Escondido
Escondido, СᎪ 92025, United Stɑtes
+18582803820
ⅽan yyou buy ɑ franchise with no money
Lucky Feet Shoes Anaheim
5761 E Santa Ana Canyon Ɍⅾ ste c,
Anaheim, CᎪ 92807, United Ꮪtates
+17142821000
orthopedic shoes online
This site was… how do you say it? Relevant!!
Finally I’ve found something which helped me. Thanks!
Thanks a bunch for sharing this with all of us you really understand
what you’re talking approximately! Bookmarked. Kindly also discuss
with my website =). We can have a hyperlink change agreement between us
Having read this I believed it was very informative.
I appreciate you taking the time and effort to put this
information together. I once again find myself spending a lot of time both reading and
commenting. But so what, it was still worth it!
excellent issues altogether, you just gained a brand new
reader. What might you suggest in regards to your publish that you
simply made a few days ago? Any certain?
If some one desires to be updated with newest technologies afterward he must be go
to see this web site and be up to date everyday.
I’d like to thank you for the efforts you have put in penning this
blog. I am hoping to see the same high-grade blog posts by you in the future as well.
In truth, your creative writing abilities has motivated me to get
my own blog now 😉
Somebody necessarily help to make critically posts I would
state. This is the very first time I frequented your web page and thus far?
I surprised with the analysis you made to create this particular put up amazing.
Excellent process!
whoah this weblog is excellent i like studying your articles.
Stay up the great work! You already know, lots of individuals
are looking around for this information, you can help them greatly.
I love reading through an article that can make people think.
Also, thanks for allowing me to comment!
bokep terbaik sma toket gede menyala banget
Hi there it’s me, I am also visiting this
web page on a regular basis, this site is really nice and the visitors are actually sharing nice thoughts.
Very good post. I absolutely love this website.
Continue the good work!
I was able to find good advice from your content.
Hello There. I found yolur blog using msn. This is
a reaqlly well written article. I’ll be sure to bookmark it and
come back to read more of your useful information. Thanks for the post.
I wilpl certainly comeback.
This blog was… how do I say it? Relevant!!
Finally I have found something which helped me. Thanks!
Nice post. I was checking continuously this blog and I am impressed!
Extremely helpful information specifically the last part 🙂 I care
for such info much. I was looking for this certain info for a long time.
Thank you and good luck.
I was wondering if you ever thought of changing the page layout
of your blog? Its very well written; I love what youve got to say.
But maybe you could a little more in the way of content so people could connect with it better.
Youve got an awful lot of text for only having one or 2 images.
Maybe you could space it out better?
I have to thank you for the efforts you have put in penning this website.
I’m hoping to view the same high-grade blog posts by you later on as well.
In fact, your creative writing abilities has motivated me to get my own site now 😉
Globally, countries just like the UK and Canada regulate on-line playing, providing secure entry to real-money platforms.
Hey I know this is off topic but I was wondering if
you knew of any widgets I could add to my blog that automatically tweet my newest
twitter updates. I’ve been looking for a plug-in like this for quite some time and was hoping maybe you would have some experience with
something like this. Please let me know if you run into anything.
I truly enjoy reading your blog and I look forward to your new updates.
Wow, this paragraph is nice, my sister is analyzing these things,
therefore I am going to tell her.
Great post.
Does your website have a contact page? I’m having a tough
time locating it but, I’d like to send you an e-mail. I’ve got
some suggestions for your blog you might be interested in hearing.
Either way, great blog and I look forward to seeing it develop over time.
When I initially commented I clicked the “Notify me when new comments are added” checkbox and now each time a comment is added I get four e-mails with the same comment.
Is there any way you can remove me from that service?
Thanks!
We stumbled over here by a different page and
thought I may as well check things out. I like what I see so
now i am following you. Look forward to exploring your web page repeatedly.
Hello to every one, the contents existing at this website
are in fact awesome for people experience, well, keep up the good work fellows.
What’s up colleagues, its impressive article about tutoringand fully explained, keep it up all the time.
Добро пожаловать в Лев Казино, где каждая игра – это шанс на успех и удачу. Наше казино предложит вам не только популярные игры, но и множество новых вариантов для экспериментов и удовольствия. Игры на любой вкус, доступные 24/7, дают вам шанс на выигрыш в любое время.
С нами вы можете быть уверены в высоком качестве обслуживания и безопасности каждой игры. Простота и удобство интерфейса, а также различные способы пополнения и вывода средств. Для новых игроков в https://levcasino-goldenchips.beauty/ предусмотрены щедрые бонусы и привилегии.
Легкая регистрация и быстрые выплаты.
Наши игроки наслаждаются разнообразием игр, начиная от классических слотов и заканчивая инновационными настольными играми.
В Лев Казино регулярно проходят акции, которые дают дополнительные возможности для выигрыша и увеличения вашего баланса.
Полная безопасность и защита данных.
Начните свою игру в Лев Казино прямо сейчас и станьте победителем, наслаждаясь множеством захватывающих игр.
Spot on with this write-up, I seriously believe that this
site needs far more attention. I’ll probably be back again to read more, thanks for the information!
Hi there! This post could not be written any better!
Reading through this post reminds me of my previous roommate!
He always kept preaching about this. I’ll send this information to him.
Fairly certain he’s going to have a great read. Thanks for sharing!
Regards! I like this.
I’ve been exploring for a bit for any high-quality articles or weblog posts in this sort of area .
Exploring in Yahoo I finally stumbled upon this website.
Reading this info So i’m glad to show that I have an incredibly good uncanny feeling I discovered just what I needed.
I so much surely will make sure to don?t put out of your
mind this website and give it a glance on a continuing basis.
Howdy are using WordPress for your blog platform?
I’m new to the blog world but I’m trying to get started and set up
my own. Do you need any coding expertise to make your own blog?
Any help would be greatly appreciated!
Hal ini bikin saya tidak perlu repot login, sekaligus menjaga keamanan dan privasi akun Instagram.
Champion Slots Казино — это необычное игровое пространство, а возможность окунуться в настоящий азартный мир. Наши игроки находят уникальные игровые форматы, которые удивят даже самых искушённых игроков. Любая игра в нашем казино — это не только шанс на выигрыш, но и источник ярких эмоций.
В чем секрет популярности Champion Slots? Всё просто: мы предлагаем именно то, что вы ищете. Помимо огромного выбора игр, мы создаем уникальную атмосферу, добавляя щедрые бонусы, регулярные турниры и акции. Наши эксклюзивные мероприятия — это способ стать победителем, https://championslots-jackpot.wiki/.
Когда лучше присоединиться к нам? Прямо сейчас! Каждый момент — это возможность попробовать свои силы.
Перед началом игры изучите основные правила и условия, чтобы гарантировать безопасный и честный процесс.
Для тех, кто стремится к большему, наша VIP-программа раскрывает уникальные возможности для игры на совершенно новом уровне.
Если вы новичок или возвращаетесь после перерыва, демо-версии игр — это прекрасный способ освоиться.
Hi, i think that i noticed youu visited my site thus i got here to go back the favor?.I’m attempting to in finding things to enhance my web site!I suppose itss adequate
to use a few of your ideas!!
Way cool! Some extremely valid points! I appreciate you writing this post
plus the rest of the website is really good.
Aplikacja charakteryzuje się minimalistycznym interfejsem,
który sprowadza się do kilku podstawowych opcji.
Why visitors still make use of to read news papers when in this technological globe everything is
presented on web?
Hello there, I do think your web site may be having web
browser compatibility issues. Whenever I take a
look at your web site in Safari, it looks fine however, when opening in IE, it’s got some overlapping issues.
I merely wanted to give you a quick heads up! Apart from that,
excellent website!
AdmiralX Casino приглашает вас — идеальная платформа для захватывающих игровых развлечений! Мы предлагаем современные слоты, классические настольные игры, а также приятные поощрения для всех игроков. Не упустите шанс и выиграть крупный джекпот! https://admiralx-777-spin.autos/.
Почему выбирают AdmiralX Casino?
Большие стартовые подарки для новичков.
Моментальные транзакции без задержек.
Сертифицированный софт от топовых провайдеров.
Попробуйте удачу в AdmiralX Casino прямо сейчас и испытайте азарт по-настоящему!
An interesting discussion is definitely worth comment. I do think that
you should publish more on this subject, it may not be a taboo matter but
typically people don’t speak about such topics.
To the next! Kind regards!!
7K Casino приглашает вас погрузиться в мировым уровнем азартных игр. Здесь представлены все популярные слоты, включая рулетку, блэкджек, покер и слоты. Тем не менее, многие граждане стараются использовать высшее качество игровых услуг. По статистике, большинство наших клиентов регулярно участвует в акциях, что дает возможность им значительно улучшить свои шансы на выигрыш и насладиться удовольствие от процесса игры. Участие в акциях и турнирах – это решение, которое поможет вам сэкономить время и деньги, а также позволит заниматься любимым делом. Каждая игра в нашем казино – это возможность быстро достигнуть желаемого, не теряя драгоценное время – https://7k-jokesprout.quest/ .
Когда целесообразно играть в наших играх? В любое время!
Существуют ситуации, когда можно сэкономить время и попросту воспользоваться предложениями в 7K Casino:
Перед началом игры рекомендуем ознакомиться с нашими условиями использования.
Если вы опытный игрок, попробуйте наши специальные VIP-условия для получения максимального удовольствия и выигрыша.
После перерыва в играх можно начать с бесплатных версий, чтобы вспомнить правила.
Wow, that’s what I was searching for, what a stuff! existing here at this website, thanks admin of this web page.
My brother recommended I might like this blog.
He was totally right. This post truly made my day.
You cann’t imagine simply how much time I had spent for this information! Thanks!
Very great post. I simply stumbled upon your weblog and wished to say that I have
really loved browsing your blog posts. After all I’ll be subscribing in your feed and I’m hoping
you write once more very soon!
Valuable information. Lucky me I found your site accidentally, and I’m shocked why this coincidence didn’t happened earlier!
I bookmarked it.
Добро пожаловать в Лев Казино – мир, где ваши игровые мечты могут стать реальностью. Здесь каждый найдет что-то по своему вкусу: от классических слотов до захватывающих игр с живыми дилерами. Присоединяйтесь к нам и начните выигрывать прямо сейчас, наслаждаясь качественным игровым процессом.
Почему именно https://levclub-play.site/? Все ваши данные защищены, а выплаты всегда своевременные и без скрытых комиссий. Для активных игроков предусмотрены эксклюзивные предложения и приятные сюрпризы. С нами ваша игра будет не только интересной, но и прибыльной.
Более 500 игр от известных провайдеров.
Щедрые бонусы, бесплатные вращения и регулярные акции.
Мгновенные депозиты и быстрые выплаты.
Увлекательные турниры с крупными призовыми фондами.
Начните играть в Лев Казино и наслаждайтесь выгодными предложениями и большими шансами на успех.
Kudos, I appreciate it.
The Sons of Anarchy Italia fan site https://sonsofanarchy-italia.com serves as the first Italian website entirely dedicated to the TV series *Sons of Anarchy*, created by Kurt Sutter.
Since the end of 2010, it has offered updates, pictures, interviews and additional content about the program and those involved.
The site is run by two administrators, the duo Lilli and Moni,
and since its inception, it has accumulated over 1,790,000 visits, becoming
the main Italian destination about *Sons of Anarchy*.
Любому человеку рано или поздно приходится пользоваться услугами стоматологических
клиник. Ни для кого не секрет, что лечение
зубов и последующее протезирование – процедуры довольно дорогостоящие, не все граждане могут позволить себе их оплатить, если вам необходимо стоматологий набережные челны мы Вам обязательно поможем.
Особенности
Благодаря услугам, которые предлагает населению стоматология Маэстро, люди разного
финансового достатка имеют возможность не
только поддерживать здоровье
полости рта, но и проходить все
необходимые процедуры. Цены на лечение зубов и протезирование значительно ниже, чем в других медучреждениях.
Несмотря на то, что клиника работает для широких слоев населения, пациенты получают полный перечень услуг, используя современное оборудование и качественные материалы.
Жителям доступны следующие процедуры:
• профилактика полости рта;
• лечение зубов с использованием различных
методов;
• полная диагностика;
• профессиональная чистка;
• отбеливание;
• протезирование.
Сотрудники учреждения соблюдают все
санитарные нормы, а для тщательной дезинфекции
и стерилизации инструментов предусмотрено современное оборудование.
Преимущества
Востребованность бюджетной стоматологии
объясняется рядом преимуществ.
Во-первых, в клинике трудятся опытные высококвалифицированные сотрудники.
Во-вторых, к каждому пациенту врач находит
подход. В-третьих, кабинеты оснащены всем необходимым оборудованием, в работе используют только качественные безопасные материалы.
В-четвертых, все виды протезирования будут проведены в сжатые сроки.
Многие клиники получают субсидии от государства, что позволяет
существенно сократить расходы.
Кроме того, некоторые стоматологии сотрудничают со страховыми компаниями, поэтому у пациентов
появляется возможность получить услуги по полюсу ОМС.
Пациенты получают консультацию по
профилактике заболеваний полости рта.
Врачи после тщательного осмотра составляют индивидуальный
план лечения, с помощью которого
удается добиться наилучшего результата.
Более доступные цены достигаются не только благодаря государственному
финансированию, но и оптимизации расходов.
Благодаря стоматологии Маэстро,
человек с небольшим достатком может не только вылечить зубы,
но и поддерживать здоровье ротовой полости.
Теперь любой человек может не
откладывать поход к стоматологу,
выбирая доступное качественное обслуживание.
Heya! I’m at work surfing around your blog from my new
apple iphone! Just wanted to say I love reading through your blog and look forward to all your posts!
Keep up the superb work!
Ramenbet Casino приглашает насладиться высококачественным игровым опытом. Наши пользователи могут найти огромный выбор игр, среди которых слоты, видеопокер, рулетку и блэкджек. Но, множество пользователей стремится достигнуть максимального качества игровых услуг. Согласно статистике, основная часть наших клиентов регулярно участвует в акциях, что позволяет им существенно повысить шансы на выигрыш и насладиться игрой. Принять участие в наших турнирах и акциях – это правильное решение, которое позволит вам сэкономить время и деньги, а также предоставит возможность продолжать наслаждаться игрой. Каждая игра в нашем казино — это возможность легко найти то, что вам нравится, не тратя время зря – https://ramenbet-777-jackpot.autos/ .
Когда выгодно играть в мероприятиях? В любой момент!
Есть обстоятельства, когда следует сэкономить время и легко воспользоваться предложениями в Ramenbet Casino:
Перед тем как начать, рекомендуем прочитать нашими правилами.
Если вы уже имеете опыт, попробуйте нашими эксклюзивными привилегиями для максимизации выигрышей.
После пропуска времени рекомендуем попробовать демо-игры, чтобы обновить навыки.
Компания Финэксперт специализируется на предоставлении профессиональных
бухгалтерских услуг для предприятий малого и среднего
бизнеса. Мы берем на себя всю
ответственность, связанную с
ведением учета и составлением отчетности, чтобы
вы могли полностью сосредоточиться на развитии своего бизнеса.
Мы предлагаем следующие услуги бухгалтерский отчетность
Мы ценим каждого клиента и стремимся к долгосрочному сотрудничеству.
It’s going to be end of mine day, however before finish I am reading this fantastic article to improve my know-how.
Thanks for sharing your thoughts about richard casino australia.
Regards
Mega сочетает в себе широкий ассортимент, доступные
цены и удобство, чтобы сделать ваши покупки максимально комфортными.
Ищете ли вы продукты или обновляете гаджеты
– мега даркнет всегда поможет.
Selain memberikan fasilitas gratis untuk mengunduh video, kamu juga
bisa memilih format lain, yaitu MP4 dan MP3.
そのため、専門的なデータ復旧の技術を活用することが重要です。
Hi there! This is kind of off topic but I need
some guidance from an established blog. Is it difficult to set up your own blog?
I’m not very techincal but I can figure things out pretty quick.
I’m thinking about creating my own but I’m not sure where to start.
Do you have any ideas or suggestions? Many thanks
Link exchange is nothing else however it is just placing the
other person’s website link on your page at proper place
and other person will also do same in support of you.
I love reading an article that will make people
think. Also, many thanks for permitting me to comment!
It’s in fact very complex in this busy life to listen news on TV, so I simply use world wide web for
that purpose, and take the newest information.
Untuk melihat file-file ini, Anda perlu menginstal plugin khusus dari
katalog aplikasi Windows, atau menggunakan konverter JPEG online
kami.
This post is priceless. How can I find out more?
Hey there, I think your website might be having browser compatibility issues.
When I look at your website in Safari, it looks fine but when opening in Internet Explorer, it has some overlapping.
I just wanted to give you a quick heads up! Other then that, very good blog!
Hi there to every one, the contents existing at this web site
are genuinely amazing for people experience, well, keep up the good work fellows.
Wow that was strange. I just wrote an extremely long comment but after
I clicked submit my comment didn’t appear. Grrrr…
well I’m not writing all that over again. Anyways, just wanted to say fantastic blog!
Heya i’m for the primary time here. I found this board and I find It really helpful &
it helped me out a lot. I am hoping to offer one thing back and help others like you aided me.
whoah this weblog is great i like studying your posts. Keep up the great work!
You already know, a lot of people are hunting round for this information, you
can help them greatly.
The other day, while I was at work, my cousin stole my apple ipad and tested tto see if it can survive a 40
foot drop, just so she can be a youtube sensation. My iPad is now broken andd she has 83 views.
I know this is totally off topic but I had to share it with someone!
Добро пожаловать в Hype Casino — лучшее казино для азартных игроков! Мы предлагаем лучшие слоты, классическую рулетку и блэкджек, а также различные бонусные программы для увеличения выигрышей. https://hype-playbounce.quest/.
Почему стоит играть в Hype Casino?
Высокая скорость вывода выигрышей без комиссий.
Ассортимент игр, включающая новейшие хиты индустрии.
Программы лояльности и турниры, дающие шанс на еще большие выигрыши.
Открывайте для себя Hype Casino и наслаждайтесь незабываемыми моментами азарта!
Ramenbet Casino — это онлайн-казино, которое предложит вам не только увлекательные игры, но и уникальные возможности для выигрыша. Здесь каждый найдет любимые слоты, настольные игры и живые казино с реальными крупье, доступные круглосуточно. С нами ваш игровой процесс всегда будет полон бонусов, подарков и приятных сюрпризов.
Почему стоит выбрать Ramenbet Casino? Мы обеспечиваем полную безопасность и прозрачность всех финансовых операций. Наши игроки могут быть уверены в моментальных выплатах и прозрачных условиях игры.
Когда вы можете начать играть в Ramenbet Casino? Присоединяйтесь к нам прямо сейчас, чтобы насладиться всеми возможностями, которые мы предлагаем. Вот что вас ждет:
В Ramenbet Casino мы гарантируем безопасность ваших данных и средств.
Эксклюзивные бонусы и акции, доступные каждый день.
Каждый месяц мы добавляем новые игры, чтобы вам не было скучно.
С нами ваш шанс на победу всегда высок, а игровой процесс станет настоящим праздником. https://mealblog.ru/
Hello there! This post couldn’t be written any better! Reading through this post
reminds me of my good old room mate! He always kept chatting about this.
I will forward this write-up to him. Fairly certain he will have a good read.
Thank you for sharing!
Admiring the dedication you put into your blog and detailed information you provide.
It’s awesome to come across a blog every once in a while that isn’t the same out of date rehashed information. Excellent read!
I’ve saved your site and I’m including your RSS feeds to my Google account.
What’s up i am kavin, its my first time to commenting anywhere, when i read
this paragraph i thought i could also create comment due to
this sensible article.
Good way of explaining, and fastidious article
to take facts concerning my presentation topic,
which i am going to deliver in institution of higher education.
4K video downloader adalah aplikasi yang diperuntukkan untuk pengguna windows
maupun Mac yang ingin mendownload video beresoluisi 4K.
You really make it seem so easy with your presentation but I find this topic to be really
something which I think I would never understand. It seems too complex and extremely broad for me.
I’m looking forward for your next post, I will try to get the
hang of it!
Рады приветствовать вас в Анлим Казино, мир азартных игр и возможности для побед сливаются в
идеальную комбинацию. Здесь игроки могут выбрать огромное количество
игр, включая слоты, рулетку, а также принять участие в турнирах и заработать солидные призы.
Как бы вы ни играли, мы предложим все,
что нужно для отличной
игры.
Наше казино предлагает высококачественные услуги и множество способов выигрыша.
Присоединяйтесь к многим довольным игрокам, и
получите шанс на большие деньги.
Вас ждут щедрые бонусы для увеличения ваших шансов на успех.
Что делает нас особенными?
Моментальная регистрация — начните играть в пару кликов.
Увлекательные бонусы для новичков —
больший шанс на успешный старт.
Регулярные турниры и акции — для тех, кто хочет повысить свои шансы на выигрыш и получить дополнительные
призы.
Круглосуточная поддержка — всегда готовы помочь
по любым вопросам.
Поддержка мобильных устройств — играйте в
любимые игры в любое время
и в любом месте.
Не упустите шанс Присоединяйтесь к нам и наслаждайтесь
прямо сейчас. https://unlim-casinoodyssey.site/
Incredible story there. What occurred after? Thanks!
Хотите испытать яркие эмоции? Добро пожаловать в Hype Casino – платформа для настоящих ценителей азарта, где доступны захватывающие игры от известных брендов. https://hype-legend.buzz/ и начните свою победную серию в Hype Casino!
Почему стоит выбрать Hype Casino?
Широкий выбор игр – слоты, рулетка, покер, блэкджек.
Щедрые акции – ежедневные розыгрыши и турниры.
Надежные транзакции – отсутствие скрытых комиссий.
Удобная платформа – мобильная версия без ограничений.
Дружелюбные операторы – готовность помочь в любое время.
Начните свое игровое путешествие и выигрывайте по-крупному!
Hello! Would you mind if I share your blog with my myspace group?
There’s a lot of people that I think would really enjoy your content.
Please let me know. Many thanks
Web-based downloaders make saving Instagram videos super simple.
These are actually impressive ideas in about blogging.
You have touched some nice factors here.
Any way keep up wrinting.
Thanks in support of sharing such a pleasant thought, paragraph
is pleasant, thats why i have read it fully
Today, I went to the beachfront with my kids.
I found a sea shell and gave it to my 4 year old
daughter and said “You can hear the ocean if you put this to your ear.” She put the shell to her ear and screamed.
There was a hermit crab inside and it pinched her ear.
She never wants to go back! LoL I know this is completely off topic but I
had to tell someone!
Kenvox
1701 E Edinger Ave
Santa Ana, CA 92705, United Stateѕ
16572319025
next-gen custom cnnc and eedm tooling services [Daisy]
If you desire to get much from this post then you have to apply these strategies to your won website.
No matter if some one searches for his required thing, therefore he/she wishes to be available that in detail, so that thing is maintained over here.
My brother recommended I might like this blog.
He was totally right. This post truly made my day.
You can not imagine simply how much time I had spent for this
information! Thanks!
Welcome to Clubnika Casino, where excitement and fantastic winnings are always within reach. Our casino offers you a vast selection of slots, table games, and live games with real dealers. We value your safety and offer fair play and data protection.
Why choose https://clubnika-casinowave.space/? By joining Clubnika Casino, you’ll get access to generous bonuses and unique promotions, enhancing your luck. At Clubnika Casino, we guarantee instant payouts and provide quality support to resolve any issues at any time.
When is the best time to start playing at Clubnika Casino? Don’t miss the chance to start with bonuses and free spins that will help you dive into a world of winnings right away. Here’s what awaits you at Clubnika Casino:
Generous bonuses and free spins for new players.
Participate in tournaments and promotions with huge prizes and chances to win.
Every month, new exciting games are added to Clubnika Casino to keep you entertained.
Join Clubnika Casino and enjoy the game that will bring you huge wins!.
Hi there, I discovered your web site by way of Google while looking for a related subject, your website got
here up, it seems great. I’ve bookmarked it in my
google bookmarks.
Hi there, just changed into alert to your blog through
Google, and located that it’s truly informative. I am going to be careful for brussels.
I will appreciate when you continue this in future.
Lots of other people can be benefited out of your writing.
Cheers!
Hi, I do believe this is a great web site.
I stumbledupon it 😉 I am going tto return once again since i hhave book-marked
it. Money and freeom is the best way to change, may youu bbe rich and continuee to help
other people.
Добро пожаловать в мир изысканной флористики!
Наша компания “Новые цветы” – это профессиональный цветочный магазин с собственной производственной базой в Казани.
Мы предлагаем:
• Более 1000 готовых букетов и композиций
• Индивидуальные заказы любой
сложности
• Собственные теплицы свежих цветов
• Широкий ассортимент растений в горшках
• Профессиональные услуги флористов
• Экспресс-доставка 24/7 по Казани и Татарстану
Почему выбирают нас:
✓ Гарантия свежести цветов
до 7 дней
✓ Цены от 499 рублей
✓ Оплата после получения
✓ Скидка 15% на первый заказ
✓ Доставка в день заказа
✓ Профессиональная упаковка
✓ Возможность заказа онлайн или по телефону
Наши флористы создают уникальные композиции, учитывая все ваши пожелания.
Мы работаем с лучшими поставщиками и выращиваем
собственные цветы, чтобы гарантировать высочайшее
качество каждого букета.
Закажите цветы недорого с доставкой прямо сейчас и подарите
радость близким! Мы заботимся о том, чтобы ваш подарок был
доставлен вовремя и в идеальном состоянии.
Присоединяйтесь к тысячам довольных клиентов!
Мы создаем моменты счастья, которые остаются в памяти навсегда.
Kamu hanya memerlukan URL dari video yang ingin diunduh dan klik tombol
download.
At this time it sounds like WordPress is the top blogging platform available right
now. (from what I’ve read) Is that what you’re using on your blog?
Fabulous, what a blog it is! This website provides helpful information to us, keep it up.
There’s definately a great deal to fid out about this
subject. I like all the points you have made.
Добро пожаловать в Клубника Казино, где азарт и великолепные выигрыши всегда рядом. В Клубника Казино собраны самые популярные игры, включая слоты, рулетку, покер и игры с реальными дилерами. Каждая игра в нашем казино – это шанс стать победителем, а наши гарантии безопасности и прозрачности обеспечат вам полный комфорт.
Почему стоит выбрать https://clubnika-casinowave.quest/ для вашего игрового опыта? Присоединившись к Клубника Казино, вы получите доступ к щедрым бонусам и уникальным акциям, что повысит вашу удачу. В Клубника Казино мы гарантируем моментальные выплаты и предоставляем качественную поддержку для решения любых вопросов в любое время.
Когда стоит приступить к игре в Клубника Казино? Не упустите шанс начать с бонусами и бесплатными спинами, которые помогут вам сразу погрузиться в мир выигрышей. Вот что вас ждет в Клубника Казино:
Щедрые бонусы и фриспины для новых игроков.
Участвуйте в турнирах и акциях с большими призами и шансами на победу.
Ежемесячные обновления и новые игры для вас.
Клубника Казино – это место, где каждый может найти свою удачу.
Highly energetic article, I loved that a lot.
Will there be a part 2?
Welcome to Onion Casino, a unique place for players who seek true excitement and quality games. At our casino, you’ll find a variety of games: from classic slots to exclusive live dealer games. With every gaming session, you have a chance not only to enjoy the process but also to win substantial prizes.
Why should you play with us? At Onion Casino, we ensure full security of your data and transparency in all transactions. Ongoing promotions and bonus offers will help boost your chances of winning and increase your profits.
When is the best time to start playing? Don’t miss the chance, start playing at Onion Casino right now and test your luck. Here are a few reasons why you should choose us:
Read our terms to play with maximum benefit and comfort.
Regular players at Onion Casino receive special offers and exclusive bonuses.
For beginners, we offer free game versions to help you learn the ropes without stress.
Join Onion Casino and discover the world of excitement, victories, and unique offers! https://onion-pixelrush.space/
Do you mind if I quote a couple of your posts as
long as I provide credit and sources back to your website?
My website is in the exact same area of interest as yours and my users would really benefit from a lot of the information you provide here.
Please let me know if this alright with you. Regards!
Very good post. I’m dealing with many of these issues as well..
Sudahkah Anda mengaktifkan mode penghemat data Instagram untuk mengurangi
penggunaan data seluler?
I loved as much as you will receive carried out right here.
The sketch is attractive, your authored material stylish.
nonetheless, you command get got an nervousness
over that you wish be delivering the following.
unwell unquestionably come further formerly again as exactly the same nearly
a lot often inside case you shield this increase.
Aurora Casino — это платформа, где каждый найдет для себя что-то интересное и получит шанс
на большую победу. Здесь представлены лучшие слоты, настольные игры,
а также живое казино с реальными крупье.
Мы также предлагаем привлекательные бонусы и акции, чтобы каждый момент игры был для вас еще
более увлекательным.
Почему вам стоит играть именно в казино Аврора официальный сайт?
Мы гарантируем высокий уровень безопасности и надежности.
Вам не нужно беспокоиться о выплатах — они быстрые и безупречные.
Когда лучше начать играть в Aurora Casino?
Не теряйте времени, зарегистрируйтесь и начните наслаждаться
играми прямо сейчас. Вот что вас ждет:
Щедрые бонусы и ежедневные акции.
Мгновенные выплаты и честные условия игры.
Широкий выбор игр, который обновляется ежемесячно.
Aurora Casino — это ваш шанс испытать удачу и получить незабываемые эмоции. https://aurora-777-spin.cfd/
Лев Казино — это ваше идеальное место для незабываемых азартных приключений. Здесь вы сможете испытать удачу в разнообразных играх, наслаждаясь каждым моментом. Каждая игра в Лев Казино тщательно проверена, и мы делаем все, чтобы ваши данные и средства были в полной безопасности.
Почему стоит выбрать https://levcasino-betoasis.boats/? Мы предлагаем широкий выбор игр, от классических слотов до инновационных настольных игр. Каждый игрок получает шанс на выигрыш благодаря регулярно проводимым акциям и турнирам. Просто начните играть, и победа обязательно будет на вашей стороне.
Каждый новый игрок получит щедрые бонусы, которые увеличат его шансы на победу.
Постоянные обновления и новинки в игровом каталоге.
Поддержка клиентов 24/7.
Начать играть в Лев Казино легко и удобно, а вывод средств происходит без задержек.
Начните играть в Лев Казино сегодня и забудьте о скуке — только победы и азарт.
Tapi perlu diingatkan ini hanya untuk koleksi pribadi, jangan diupload ulang di media sosial manapun karena akan melanggar hak cipta.
Wonderful blog! I found it while searching on Yahoo News.
Do you have any tips on how to get listed in Yahoo News?
I’ve been trying for a while but I never seem to get there!
Appreciate it
В 1xSlots Casino вы получите непревзойденный игровой сервис. вы найдете свои любимые игры, включая рулетку, покер и блэкджек. Каждый турнир предлагает вам шанс победить, а также возможность получить бонусы. Тем не менее, мы знаем, что многие стремятся получить наилучший результат. Согласно данным, те, кто активно участвует в наших акциях, выигрывают чаще. Также, у вас будет возможность максимально выгодно использовать свои ресурсы и наслаждаться увлекательную игру на платформе – https://1xslots-highscore.monster/.
Когда принимать участие в нашем казино? В любое время!
Существуют обстоятельства, когда вы можете позаботиться о своих ресурсах и просто воспользоваться предложениями в 1xSlots:
Перед игрой, прочитайте нашими условиями.
Если вы опытный игрок, используйте бонусы для VIP-игроков для максимальных выигрышей.
Если вы давно не играли, начните с демо-версий игр, чтобы освежить навыки.
Хотите испытать настоящий азарт? Тогда Eldorado Casino — ваш лучший выбор! Вас ждут топовые игровые автоматы, специальные акции и гарантированные выплаты! https://eldorado-playfusion.top/.
Почему тысячи игроков выбирают Eldorado Casino?
Огромный выбор игр от известных разработчиков.
Щедрая бонусная система для новых пользователей.
Быстрые выплаты без скрытых комиссий.
Мобильная версия без ограничений.
Служба поддержки работает круглосуточно.
Присоединяйтесь к Eldorado Casino и ловите удачу на лучших условиях!
Good day! Do you use Twitter? I’d like to follow you if that would be ok.
I’m definitely enjoying your blog and look forward to new posts.
My brother recommended I might like this web site.
He was totally right. This post actually made my day.
You cann’t imagine just how much time I had spent for this information! Thanks!
May I simply say what a relief to find somebody who really understands what they’re
discussing over the internet. You definitely understand how to bring a problem
to light and make it important. More and more people have to
read this and understand this side of your story. I can’t believe
you’re not more popular because you certainly have the gift.
Hmm is anyone else encountering problems with the pictures on this blog loading?
I’m trying to determine if its a problem on my end or if it’s
the blog. Any feed-back would be greatly appreciated.
Thanks for the marvelous posting! I genuinely enjoyed reading it,
you’re a great author. I will be sure to bookmark your blog and
definitely will come back in the foreseeable future.
I want to encourage one to continue your great work, have a nice morning!
I think the admin of this web page is really
working hard in favor of his web page, as here every information is quality based stuff.
Howdy! Someone in my Myspace group shared this website with us so I came to look it over.
I’m definitely enjoying the information. I’m bookmarking and will be tweeting this to my followers!
Superb blog and excellent style and design.
Hi, its nice paragraph about media print, we all understand
media is a enormous source of data.
Добро пожаловать в Zooma Casino, ваш идеальный партнер для увлекательных игр и больших побед. Здесь каждый найдет игру по своему вкусу, будь то слоты, настольные игры или захватывающие живые игры. Наша цель — предоставить игрокам не только шанс выиграть, но и наслаждаться процессом игры.
Почему Zooma Casino — это правильный выбор для азартных игроков? Мы гарантируем полную безопасность ваших данных и прозрачность всех игр. Каждый игрок получит выгодные бонусы и примет участие в регулярных акциях, которые увеличат ваши шансы на победу.
Когда стоит начать игру? После регистрации вы получаете доступ ко всем возможным бонусам и преимуществам, чтобы начать выигрывать с первого дня. Вот что вас ждет:
В нашем казино каждый день новые бонусы, которые делают игру еще более интересной и выгодной.
Огромный выбор игр: от классических слотов до живых игр с настоящими крупье.
Множество способов пополнения счета и вывода средств.
С Zooma Casino каждый может испытать удачу и выиграть крупный приз. https://zooma-fun.buzz/
Hello there! I could have sworn I’ve been to your blog before but after going through many of the articles I realized it’s new to me.
Anyhow, I’m definitely pleased I stumbled upon it and I’ll be book-marking it and checking back regularly!
Franchising Path Escondido
Escondido, СA 92025, United Statеs
+18582803820
what maҝеѕ a franchise a franchise
I’m really loving the theme/design of your blog. Do you ever run into any web
browser compatibility issues? A couple of my blog readers have complained about my site not operating correctly in Explorer
but looks great in Safari. Do you have any recommendations to help fix this problem?
I every time used to read article in news papers but now as I am a user of internet so from now I am using net for posts,
thanks to web.
Spott on with this write-up, I actually feel this
amazing site needs far more attention. I’ll probably be back again to read more, thanks
for the advice!
Hello I am so glad I found your website, I really found you
by accident, while I was looking on Aol for something else, Nonetheless I am here now and would just like to say
cheers for a fantastic post and a all round exciting blog (I also love the theme/design), I
don’t have time to browse it all at the moment
but I have book-marked it and also added in your RSS feeds, so when I have time I will be back to read
a lot more, Please do keep up the awesome work.
Excellent article. Keep writing such kind of information on your page.
Im really impressed by it.
Hello there, You have done an excellent job.
I’ll definitely digg it and in my opinion suggest to my friends.
I am sure they’ll be benefited from this site.
Good information. Lucky me I recently found your site by accident (stumbleupon).
I’ve book marked it for later!
Hi there friends, how is everything, and what you wish for to say concerning this post, in my view its in fact awesome in favor of me.
Champion Slots Казино — это ваш путь к успеху. У нас представлено огромное разнообразие игр, включая популярные автоматы и классические настольные игры. Каждый ваш шаг в наших акциях — это шанс испытать удачу, получив незабываемые эмоции.
Почему стоит выбрать Champion Slots Казино? Мы предлагаем высококлассный сервис, но и щедрые акции и бонусы, которые дают больше возможностей для выигрыша. Каждое предложение — это приглашение к яркому игровому приключению – https://championslots-fortune.website/.
Когда лучше всего начать играть? В любое удобное для вас время!
Обязательно ознакомьтесь с нашими основными правилами.
Для опытных игроков, у нас есть специальные VIP-программы, чтобы максимально наслаждаться игрой.
Если вы возвращаетесь к играм после паузы, начните с бесплатных версий игр, чтобы снова войти в азартный ритм.
Today, I went to the beachfront with my children. I found a sea shell and gave it to my 4year old daughter and said “You can hear the ocean if you put this to your ear.”
Shee placed the shell to her ear and screamed. There was a
hermit crab inside and it pinched her ear. She never wants to
go back! LoL I know this is totally off topic but I haad to teol
someone!
I love your blog.. very nice colors & theme. Did you design this website yourself or did you hire someone
to do it for you? Plz respond as I’m looking to construct my own blog and would like to know where
u got this from. many thanks
Heya! I realize this is sort of off-topic but I had to ask.
Does building a well-established website such as yours take a
lot of work? I’m completely new to writing a blog however I do write in my diary everyday.
I’d like to start a blog so I will be able to share my experience and feelings online.
Please let me know if you have any recommendations or tips for brand
new aspiring blog owners. Thankyou!
I’m gone to tell my little brother, that he should also go to see this blog on regular basis
to get updated from latest reports.
Uzun Yılların getirmiş olduğu bu tecrübe ile %100 Güvenli , hızlı
ve kaliteli hizmetimizle Türkiye’nin 8 Yıldır En güvenilir ve kaliteli hizmetini sunmaktayız.
I’m not that much of a online reader to be honest but your blogs really nice, keep it up!
I’ll go ahead and bookmark your website to come back later.
All the best
hi!,I love your writing very a lot! percentage we be
in contact extra approximately your article on AOL?
I require an expert on this space to unravel my problem.
May be that’s you! Taking a look forward to look you.
КриптоБосс – Биткоин рулетка с
рекордными выигрышами! http://0df.ru
Terrific material. Many thanks.
I think the admin of this web page is really working hard for his website, for
the reason that here every material is quality based material.
Very good blog post. I definitely appreciate this
website. Keep writing!
Viagra * Cialis * Levitra
All the products you are looking for are currently at one’s disposal in support of 1+1.
4 more tablets of identical of the following services: Viagra * Cialis * Levitra
https://pxman.net
It’s a shame you don’t have a donate button! I’d certainly
donate to this brilliant blog! I suppose for now i’ll settle for bookmarking and adding your RSS feed to my Google account.
I look forward to new updates and will share this blog with my Facebook group.
Talk soon!
игры с читами на андроид — это интересный способ
получить новые возможности.
Особенно если вы играете на мобильном
устройстве с Android, модификации открывают перед вами новые возможности.
Я нравится использовать модифицированные версии игр, чтобы получать неограниченные ресурсы.
Модификации игр дают невероятную персонализированный подход, что взаимодействие с игрой гораздо увлекательнее.
Играя с модификациями, я могу добавить
дополнительные функции, что добавляет новые приключения и
делает игру более эксклюзивной.
Это действительно интересно,
как такие модификации могут улучшить взаимодействие с игрой, а при этом сохраняя использовать
такие взломанные версии можно без особых неприятных последствий,
если быть внимательным и следить за обновлениями.
Это делает каждый игровой процесс
уникальным, а возможности практически неограниченные.
Советую попробовать такие модифицированные версии для Android —
это может добавить веселья в геймплей
Hello, Neat post. There’s a problem with
your web site in internet explorer, may test this?
IE still is the marketplace chief and a big section of other people will omit your magnificent writing due to this problem.
Thank you a bunch for sharing this with all people you actually recognise
what you are talking about! Bookmarked. Please additionally talk over with my web site =).
We can have a hyperlink alternate arrangement among us
I visited many blogs however the audio quality for audio
songs existing at this site is in fact wonderful.
Wonderful blog you have here but I was curious about if you knew of any forums
that cover the same topics talked about here? I’d really like to be a part of community where I can get comments from other knowledgeable people that share the same interest.
If you have any recommendations, please let me know.
Many thanks!
I pay a quick visit daily a few web sites and blogs to read posts, except this web site provides
quality based posts.
What’s up, this weekend is fastidious in support of me, because this time i am reading this fantastic educational article here at my home.
Добро пожаловать в мир изысканной флористики! Наша компания “Новые цветы” – это профессиональный цветочный магазин с собственной производственной базой в Казани. Мы предлагаем:
• Более 1000 готовых букетов и композиций
• Индивидуальные заказы любой сложности
• Собственные теплицы свежих цветов
• Широкий ассортимент растений в горшках
• Профессиональные услуги флористов
• Экспресс-доставка 24/7 по Казани и Татарстану
Почему выбирают нас:
✓ Гарантия свежести цветов до 7 дней
✓ Цены от 499 рублей
✓ Оплата после получения
✓ Скидка 15% на первый заказ
✓ Доставка в день заказа
✓ Профессиональная упаковка
✓ Возможность заказа онлайн или по телефону
Наши флористы создают уникальные композиции, учитывая все ваши пожелания. Мы работаем с лучшими поставщиками и выращиваем собственные цветы, чтобы гарантировать высочайшее качество каждого букета.
Закажите https://yachtakazan.ru/ прямо сейчас и подарите радость близким! Мы заботимся о том, чтобы ваш подарок был доставлен вовремя и в идеальном состоянии.
Присоединяйтесь к тысячам довольных клиентов! Мы создаем моменты счастья, которые остаются в памяти навсегда.
I visit daily some blogs and websites to read content, but this web site provides feature based
articles.
Incredible story there. What happened after? Thanks!
I really like what you guys are usually up too. Such clever work and reporting!
Keep up thhe aweesome works guys I’ve added you guys to my own blogroll.
I blog frequently and I seriously thank you for your information. Your article has really peaked my
interest. I am going to book mark your website and keep checking for new information about once per
week. I opted in for your Feed as well.
It’s going to be finish of mine day, however before ending I am reading this enormous post to improve my experience.
Regards! Quite a lot of knowledge!
Hello my family member! I wish to say that this post is awesome, nice written and come with approximately
all significant infos. I’d like to peer more posts like this
.
fantastic issues altogether, you simply received a new
reader. What could you recommend in regards to your post that you
made some days in the past? Any positive?
I’m amazed, I must say. Seldom do I encounter a blog that’s both equally educative and interesting,
and let me tell you, you’ve hit the nail on the head. The problem is
something which too few men and women are speaking intelligently about.
Now i’m very happy that I stumbled across this in my hunt for something regarding this.
You actually mentioned that terrifically.
This post is really a fastidious one it assists new the web users, who are wishing for blogging.
Hmmm iit looks like your site ate my first comment (it was extremely long) so I gueds I’ll just sum it up
what I wrote and say, I’m thoroughly enjoying your blog.
I as well amm an aspirig blog writer but I’m still new to the whole thing.
Do you have any points for novice blog writers?
I’d cerfainly appreciate it.
Hey I know this is off topic but I was wondering if you knew of any widgets I could add to my blog that automatically tweet my newest twitter updates.
I’ve been looking for a plug-in like this for quite some time and was hoping maybe you would have some
experience with something like this. Please let
me know if you run into anything. I truly enjoy reading your blog and I look forward to your new updates.
скачать модифицированные игры на телефон —
это интересный способ улучшить игровой
процесс. Особенно если вы играете на Android, модификации открывают перед вами огромный выбор.
Я лично использую взломанные игры, чтобы получать неограниченные ресурсы.
Модификации игр дают невероятную свободу в игре,
что погружение в игру гораздо захватывающее.
Играя с модификациями, я могу добавить дополнительные функции, что добавляет виртуальные путешествия и делает игру более захватывающей.
Это действительно интересно, как такие моды могут улучшить игровой процесс, а
при этом не нарушая использовать такие игры с изменениями можно без особых неприятных последствий, если быть внимательным и следить за обновлениями.
Это делает каждый игровой процесс персонализированным, а возможности
практически широкие.
Советую попробовать такие игры с модами для
Android — это может вдохновит на новые
приключения
I visit daily some web sites and sites to read
articles or reviews, however this web site offers feature based posts.
Howdy! Do you use Twitter? I’d like to follow you if that would be ok.
I’m absolutely enjoying your blog and look forward to
new posts.
女性 用 ラブドール“Mary Ann! Mary Ann! ?said the voice.“Fetch me my gloves this moment! ?Then came a little pattering of feet on the stairs.
Good information. Lucky me I found your website by chance (stumbleupon).
I have saved as a favorite for later!
What’s up everybody, here every person is sharing
these familiarity, therefore it’s nice to read this
web site, and I used to pay a visit this weblog daily.
Hello would you mind letting me know which hosting company you’re utilizing?
I’ve loaded your blog in 3 different web browsers and I must say
this blog loads a lot faster then most. Can you
suggest a good internet hosting provider at a fair price? Thanks, I appreciate it!
You really make it appear so easy with your presentation but I to find this matter
to be actually something which I believe I would never understand.
It sort of feels too complicated and very wide for me.
I am having a look forward to your next submit, I will attempt to get the hold
of it!
I think this is one of the most vital info for me. And i’m glad reading your article.
But should remark on few general things, The site style is wonderful,
the articles is really nice : D. Good job, cheers
voting,エロ コスcontracting yourselves into a nutshell of civility or dilating into anatmosphere of thin and vaporous generosity,
Highly energetic post, I liked that a lot. Will there be a part 2?
I constantly spent my half an hour to read this blog’s articles all the
time along with a mug of coffee.
I’m really impressed with your writing skills as well
as with the layout on your weblog. Is this a paid theme or did
you customize it yourself? Anyway keep up the excellent quality writing, it’s rare to see a
great blog like this one today.
Jika tidak ingin kehilangan story tersebut, lebih baik download dan simpan di
galeri ponsel.
You actually make it seem so easy along with your presentation but I find this matter to be
actually something which I think I might never understand.
It kind of feels too complicated and very broad for me.
I’m looking forward in your next post, I’ll attempt to get the
cling of it!
When I originally left a comment I appear to have clicked the -Notify me when new comments are added- checkbox and from now on whenever a comment is
added I get four emails with the exact same comment. There has to be a means you are able to remove me from that service?
Thanks!
Everything is very open with a precise description of the issues.
It was really informative. Your website is useful.
Thank you for sharing!
Hi, i think that i saw you visited my site so i came to
“return the favor”.I’m attempting to find things to improve my website!I suppose its
ok to use a few of your ideas!!
Thanks on your marvelous posting! I genuinely enjoyed reading it, you will be a great author.
I will be sure to bookmark your blog and will eventually come back at some point.
I want to encourage you to ultimately continue your great
writing, have a nice evening!
If you’re here, it means you’re eager to download your posts, and Snapinsta is here to make that process seamless for you.
These are truly impressive ideas in regarding blogging.
You have touched some nice factors here. Any way keep up wrinting.
I have been browsing online more than 2 hours today, yet I never found any interesting article like yours.
It is pretty worth enough for me. In my view, if all site owners
and bloggers made good content as you did, the
web will be much more useful than ever before.
Do you mind if I quote a few of your posts as long as I provide credit and sources back to your webpage?
My blog site is in the very same area of interest as
yours and my visitors would truly benefit from some of the information you
present here. Please let me know if this ok with you. Appreciate it!
It’s very trouble-free to find out any matter on web as
compared to textbooks, as I found this post at this web
page.
Right here is the right web site for anyone who wishes to understand this topic.
You understand a whole lot its almost hard to argue with you (not that I really would want to…HaHa).
You definitely put a brand new spin on a topic which has been discussed for years.
Great stuff, just wonderful!
My brother recommended I might like this website. He was entirely right.
This post actually made my day. You cann’t imagine just how much time I had
spent for this info! Thanks!
You could certainly see your expertise in the work
you write. The sector hopes for more passionate writers such as you who aren’t afraid to say
how they believe. Always follow your heart.
Jika Anda menginginkan cara yang lebih mudah dan nyaman untuk mengunduh video
YouTube, Anda dapat berlangganan layanan YouTube Premium.
I’m no longer positive the place you’re getting your information, but great topic.
I must spend a whiule findiing out more or figuring
out more. Thanks for wonderful info I used to be looking for this information for my
mission.
Hi there! This post couldn’t be written any better!
Reading through this post reminds me of my previous room mate!
He always kept talking about this. I will forward this article to him.
Fairly certain he will have a good read. Thank you for
sharing!
Appreciate the recommendation. Let me try it out.
If some one wants to be updated with most recent technologies afterward he must
be pay a visit this site and be up to date every day.
Seriously tons of valuable material.
Whoa tons of fantastic information!
I was suggested this web site by my cousin. I’m not sure whether this post
is written by him as nobody else know such detailed
about my problem. You are wonderful! Thanks!
This is nicely put! .
My brother suggested I might like this web site.
He was totally right. This post actually made my day.
You can not imagine simply how much time I had spent for this
info! Thanks!
After I originally commented I appear to have clicked
the -Notify me when new comments are added- checkbox and from now on whenever a comment is added I receive four
emails with the same comment. Is there a way you can remove me from that service?
Thank you!
Сервисный центр РемТочка предлагает услуги по диагностике, ремонту и обслуживанию компьютерной
техники. Мы специализируемся на решении любых проблем с вашим
компьютером, от простых настроек до
сложных технических работ.
Наши опытные специалисты всегда готовы
помочь вам с любыми вопросами, такими как
ремонт компьютерам на дома связанными с компьютерами и программным обеспечением.
You’ve made your point.
Finns det någon strategi för att maximera din upplevelse av spins bonus?
Its like you read my mind! You seem to know so much about this, like
you wrote the book in it or something. I think that you can do with some pics to drive the message home a little bit, but other
than that, this is magnificent blog. A fantastic read.
I’ll certainly be back.
If some one wishes to be updated with latest technologies then he must be visit this
web site and be up to date everyday.
I like the valuable info you supply to your articles.
I’ll bookmark your blog and take a look at again right here frequently.
I’m moderately sure I’ll learn plenty of new stuff proper here!
Best of luck for the next!
I always used to read article in news papers but now as I am a
user of internet therefore from now I am using net for content, thanks to web.
WOW just what I was looking for. Came here by searching for best email marketing
Hello there! This is kind of off topic but I need
some help from an established blog. Is it very difficult to set up
your own blog? I’m not very techincal but I can figure things out
pretty quick. I’m thinking about setting up my own but I’m not sure where
to start. Do you have any ideas or suggestions? Cheers
HorsePower Brands Omaha
2525 N 117tһ Ave #300,
Omaha, NᎬ 68164, United Stɑtеs
14029253112
horsepower franchising options, Latosha,
WOW just what I was looking for. Came here by searching for
vlad blad ultron review
I got this web page from my friend who shared with me about this web page and at
the moment this time I am browsing this web site and reading very informative posts
at this place.
This blog was… how do you say it? Relevant!! Finally I’ve found something which
helped me. Thanks a lot!
I’ll immediately seize your rss feed as I can’t find your e-mail subscription link or newsletter service.
Do you have any? Kindly allow me understand so that I may just subscribe.
Thanks.
Sweet blog! I found it while browsing on Yahoo News.
Do you have any tips on how to get listed in Yahoo News?
I’ve been trying for a while but I never seem to get there!
Thank you
After a bad Botox experience elsewhere, I was really nervous about trying again. But Dr Laura completely changed my perspective. She’s so professional, reassuring, and truly knows what she’s doing. My results are exactly what I wanted—smooth but natural.
Feel free to surf to my page – http://otherwheresmag.com
Thanks for every other great article. The place else may just anyone get that type
of info in such an ideal aplroach of writing? I have a presentation subsequent
week, and I’m on the look foor such information.
I have to thank you for the efforts you have put in writing this site.
I really hope to check out the same high-grade
content from you later on as well. In fact, your creative writing abilities
has inspired me to get my own website now 😉
You really make it appear really easy along with your presentation but I in finding this matter to
be really one thing that I think I might by no means understand.
It seems too complex and extremely wide for me. I am looking ahead
in your subsequent submit, I’ll attempt to get the hang of it!
I was pretty pleased to find this site. I wanted to thank
you for ones time for this wonderful read!! I definitely really liked every part of it and i also have you bookmarked
to check out new information in your site.
I have been surfing on-line more than three hours nowadays, yet I by no means discovered any
fascinating article like yours. It’s beautiful price sufficient
for me. Personally, if all website owners and bloggers made good
content material as you did, the net will be a lot more useful than ever before.
I am regular visitor, how are you everybody? This piece of writing posted at this web page
is really pleasant.
This is really interesting, You are a very professional
blogger. I’ve joined your rss feed and stay
up for seeking more of your wonderful post. Additionally,
I have shared your site in my social networks
Greetings! I know this is kinda off topic but
I’d figured I’d ask. Would you be interested in exchanging links or maybe guest authoring a blog
post or vice-versa? My site addresses a lot of the same subjects as yours and I feel we could greatly benefit from each other.
If you’re interested feel free to send me an email.
I look forward to hearing from you! Wonderful blog by the way!
Woah! I’m really digging the template/theme of this website.
It’s simple, yet effective. A lot of times it’s
very hard to get that “perfect balance” between superb usability and
visual appearance. I must say you have done a excellent job with this.
Also, the blog loads super quick for me on Firefox.
Excellent Blog!
Hello!
I’m Luke, and I couldn’t resist leave a comment here.
Your content is so interesting, and it’s always nice to come across such cool posts.
By the way, if you’re interested in fun chats, you
should totally check out Bubichat! It’s an amazing platform where flirty conversations
happen all the time.
I found it so enjoyable because it’s the perfect spot to meet new people and have a good laugh.
Join me there if you’re up for something different!
I’m usually there, and who knows – we might chat soon!
Thanks for this great post! intimate chat with women
Hugs Waiting on bubichat.com
whoah this weblog is fantastic i like studying your articles.
Keep up the great work! You realize, a lot of individuals are
looking round for this info, you can aid them greatly.
Greetings, I do believe your web site could possibly be having internet browser compatibility problems.
When I look at your site in Safari, it looks fine however when opening in I.E., it has some overlapping
issues. I simply wanted to provide you with a quick heads up!
Other than that, fantastic site!
That is very interesting, You are a very skilled blogger.
I have joined your rss feed and stay up for in quest of extra of your fantastic post.
Also, I have shared your site in my social networks
Pretty element of content. I simply stumbled upon your site and in accession capital to claim that I
get in fact enjoyed account your weblog posts.
Any way I will be subscribing for your feeds or even I achievement
you get entry to persistently rapidly.
Good response in return of this difficulty with firm arguments
and explaining the whole thing on the topic of that.
My brother recommended I may like this website.
He used to be entirely right. This publish truly made my day.
You cann’t consider simply how a lot time I had spent for this information! Thanks!
Hi, I wish for to subscribe for this webpage
to obtain newest updates, thus where can i do it
please help.
I am really grateful to the owner of this web page who has shared this impressive piece of writing at at this place.
Hi there, all is going nicely here and ofcourse every one is sharing
facts, that’s genuinely excellent, keep up writing.
Brilliant insights! As an Albany Park roofer, we’ve cracked Chicago’s brutal “emergency HVAC” SERPs through 773-area schema
clusters + Ben’s Breadcrumb plugin. Burn generic gurus
– Chi-Town demands parasite page purges across Wicker Park mom
blogs. Last month: forr “broken AC Lincoln Square”. PS: O’Hare proximity schema = gamechanger.
– SEO Network
взломанные игры с модами — это замечательный способ изменить игровой опыт.
Особенно если вы играете на Android, модификации открывают перед
вами широкие горизонты.
Я лично использую взломанные игры, чтобы достигать большего.
Моды для игр дают невероятную возможность настроить игру, что делает процесс гораздо красочнее.
Играя с твиками, я могу повысить уровень сложности, что добавляет виртуальные путешествия и делает игру
более непредсказуемой.
Это действительно невероятно, как
такие изменения могут улучшить переживания от игры, а при этом не нарушая
использовать такие модифицированные
приложения можно без особых опасностей, если быть внимательным и
следить за обновлениями. Это делает каждый игровой процесс более
насыщенным, а возможности практически неограниченные.
Обязательно попробуйте попробовать такие игры с модами для Android — это может придаст новый смысл
Ігровий клуб з рекордними джекпотами https://www.amexpetrol.com/reestracija-v-kazino-bet2fun-shvidkij-sposib-94/
I’ve learn some excellent stuff here. Definitely price bookmarking for revisiting.
I wonder how a lot effort you place to make this type of wonderful informative web site.
Great post! We are linking to this particularly great content on our site.
Keep up the great writing.
I used to be able to find good information from your articles.
Thanks for sharing your thoughts about reference.
Regards
That is really attention-grabbing, You’re an excessively professional blogger.
I have joined your rss feed and look forward to in search of more
of your excellent post. Additionally, I’ve shared your site in my social networks
My family members always say that I am wasting my time here at web,
however I know I am getting knowledge all the time by reading thes fastidious posts.
Hi are using WordPress for your site platform? I’m new to the
blog world but I’m trying to get started and set
up my own. Do you require any html coding expertise to make your own blog?
Any help would be greatly appreciated!
Hello, i think that i saw you visited my website thus i came to “return the favor”.I am trying to find things
to improve my site!I suppose its ok to use some of your ideas!!
Hey! This post couldn’t be written any better!
Reading through this post reminds me of my previous room
mate! He always kept talking about this. I will forward this write-up to him.
Fairly certain he will have a good read. Thank you for sharing!
Hi, yes this piece of writing is actually pleasant and I have learned lot of things from
it regarding blogging. thanks.
Hi there everyone, it’s my first visit at this web site, and post is truly fruitful
in support of me, keep up posting these posts.
What’s up, constantly i used to check blog posts here in the early hours in the dawn, as i
love to learn more and more.
Wonderful post! We will be linking to this great
content on our website. Keep up the good writing.
It’s an awesome paragraph for all the internet users; they will obtain advantage from it I am sure.
It’s a pity you don’t have a donate button! I’d without a doubt donate to this outstanding blog!
I guess for now i’ll settle for book-marking and adding
your RSS feed to my Google account. I look forward to brand new updates and will talk about this
website with my Facebook group. Talk soon!
Mmes Brigand et Darbot ont organisé, lundi 30 octobre, un après-midi récréatif pour les enfants du village et des alentours, sur le thème d’Halloween.
Hey! This is my first visit to your blog! We are a collection of volunteers and starting a new project in a community in the same niche.
Your blog provided us useful information to work on. You have done a extraordinary
job!
I am sure this article has touched all the internet viewers,
its really really nice post on building up new blog.
Hello, There’s no doubt that your site could be having web browser
compatibility problems. When I look at your site in Safari, it looks fine however, when opening in Internet
Explorer, it has some overlapping issues. I just wanted
to give you a quick heads up! Besides that, excellent blog!
We are a gaggle of volunteers and opening a brand new scheme in our community.
Your website offered us with useful info to work on. You have done
a formidable activity and our whole community will be grateful to you.
I’ve been browsing online more than 2 hours today, yet I never found any
interesting article like yours. It’s pretty worth enough for me.
In my opinion, if all web owners and bloggers made good content as you did, the net will be a lot more useful than ever before.
Hmm iit seems like yopur website ate my first comment (it was extrmely long) so I guess
I’ll just sum it up what I wrote and say,
I’m thoroughly enjoying your blog. I as well am an aspiring
blog blogger but I’m still new to everything. Do you have any
recommendations for first-time blog writers?
I’d genuinely appreciate it.
This is the right blog for anybody who wants to understand this topic.
You realize so much its almost tough to argue with you (not that I actually would want to…HaHa).
You certainly put a fresh spin on a topic which has been discussed for many years.
Wonderful stuff, just wonderful!
I like the helpful info you provide in your articles. I will bookmark your weblog
and check again here frequently. I’m quite certain I will learn plenty of new stuff right here!
Best of luck for the next!
Very wonderful info can be found on blog. https://storage.googleapis.com/goldbullion/Gold-coins/Buying-Gold-and-Silver-in-Ireland.html
Do you have a spam issue on this blog; I also am a blogger,
and I was curious about your situation; many of us have created some nice procedures
and we are looking to trade techniques with other folks,
please shoot me an e-mail if interested.
Nicely put. Appreciate it!
Sweet blog! I found it while surfing around on Yahoo
News. Do you have any tips on how to get listed in Yahoo News?
I’ve been trying for a while but I never seem to get there!
Thank you
Thanks very nice blog!
Terrific article! This is the kind of information that are supposed to be shared across the net.
Disgrace on the seek engines for not positioning this post upper!
Come on over and consult with my website . Thanks =)
{Usually, you can get a match deposit welcome bonus with free spins to play
online new slots.|However, it’s essential to use this feature wisely and be aware of the potential risks involved.|For cryptocurrency users, Slots LV
offers enhanced bonuses, making it an attractive option for those looking to play with digital currency.|Moreover, these RNG-tested games ensure a fair gambling experience for every
player.|Another subcategory of video slots
that deserves special mention is the altogether rather narrow group of games dedicated to music.|There are
many slot machine apps available for iPhone and Android OS and they almost all work the same way.|Best video slot machines combine high RTP
with innovative features.|You do have the potential to receive bonus offers to play real money casino games, but free slots for fun do not payout real money.|This feature typically involves guessing the color or suit of a hidden card to double or quadruple your winnings.|Remember that playing with Sweeps Coins gives you a chance to
redeem for cash prizes and gift cards at this leading site.|RAM and ROM size
do not affect overall performance with the modern mobile compatibility settings.|With 5 reels and 25 pay
lines, there are numerous chances to land winning combinations.|Given that online casinos show many benefits to gamers, players can enjoy a range of slots for fun these days.|Some modern 5-reel slots have expandable reels that
can accommodate thousands of win ways.|You cannot retrigger Re-Spins during the feature,
nor can you activate the Pegasus Bonus or the Once Bitten Bonus features during Re-Spins.|If you manage to land two wilds,
your winnings will be quadrupled.|When you find a perfect 3D
casino online for you, be sure to register.|If you’re looking for the 3D slots with the highest RTP,
you’re in the right place!|In each of these spins, your chances of winning will be boosted, usually thanks to extra in-game features, boosted reels, or multipliers.|The
value tells how much of the total stake will be paid out to the players in the
long run.|Produced by Light & Wonder, this game builds on its predecessor’s success with an additional wheel for enhanced prizes.|For example, a 3D Slots machine with a 90% RTP will pay £90 back
out for every £100 put in, leaving the casino with a 10% cut.|Another
entry courtesy of Microgaming, Frozen Diamonds has not received the recognition it deserves.|It’s a combination of advanced graphics, immersive sound design,
and interactive elements that create a multi-layered experience.|Recently, however, there has
been an entirely new category of slot games that started to get attention amongst online gamblers, and that is
3D slots.|One of the most popular BetSoft slots is The Slotfather, known for its engaging gameplay
and unique theme.|It created two of the most iconic casino games
of all time – Starburst and Gonzo’s Quest – along with slots like Twin Spin, Reel Rush, Narcos, Dead
or Alive, and Mega Fortune.|Imagine playing a slot game where you are transported into the virtual
world, able to interact with the game environment in a
fully immersive experience.|If you don’t know exactly what this means, we are here to explain.|You can still expect fewer paylines from these modern classic online slots, which ensures betting totals remain low while winning potential
always impresses.|In addition, popular themes on US
slot sites include pets, carnivals, fairytales, and luxury.|If you deposit with prepaid cards, you’ll need to choose a different cashout option, such as e-wallets.|Let’s take a look at some of the top titles
in the market, known for their stunning visuals,
engaging storylines, and exciting gameplay.|Engage your punters and customers with the provided
fascinating effects that come along with our slot game development services.|With such fierce competition between casinos, they
can’t afford to be offering low payouts – especially online where customers only need to switch websites to get a better percentage.|Cascading
reels replace traditional spinning reels with
falling symbols.|Bowen specializes in writing on a variety of subjects, including roulette, blackjack, video poker,
sports betting, and more.|When choosing 3D slots to play,
it’s important to consider the quality of the software providers.|Social
slots are a great way for new players to understand the mechanics and rules without financial risk.|It’s the place where both the rookie and the old-hand slot players find common ground in user-friendly interfaces and
butter-smooth gameplay.|The jackpot could be fixed (a pre-set amount for all players) or progressive (an increasing pool donated by bets).|This machine
only had three drums (now known as reels) and five
symbols.|You receive a prize for every number you bet on that
matches the winning numbers.|For a long time, playing online slots for real money was not legal in the US.|The company develops software for land-based IGT casinos,
mobile systems and online casinos.|You have as much chance of winning as an experienced player, it
just depends how the reels land.|For over 20 years, we have been on a mission to help slots players find
the best games, reviews and insights by sharing our knowledge and expertise in a fun and
friendly way.|BetMGM provides everything a player could need from a slots site.|Mechanics vary, so read all about it to
learn how to participate.|These slots feature five or more reels and a larger number of paylines compared to the
classic ones, offering you more opportunities to win.|Gold Rush Gus offers a cartoonish mining adventure with engaging graphics and interactive gameplay.|Bonus features not only boost the fun of free slots, they also enhance their
unique story and world.|Rest assured that we will only recommend legal online slots sites that carry the necessary licenses in the states
they operate.|To give you the best user experience every time you play,
our dedicated customer support team is always on standby and ready to assist you with
any questions you may have.|You don’t need much to enjoy the excitement of playing slots online.|A lot
of our players say that once you discover the fun to be
had, you’ll never want to go back to plain old slots.|Medusa offers a Gamble feature
that affords winning spins the opportunity to double or quadruple that
payout.|Some slots already allow toggling background music or sound effects on/off.|While
2D slots are colourful and fun to look at, they
don’t feel as good as a 3D slot.|Some casinos pack a punch
with tons of slots, a mix of different game providers, and even some exclusive titles
you won’t find anywhere else.|If you’re wondering how to play slot machines in a way to increase your Chances
to Win, be aware of the following tips.|The slot machine has
6 bonus features with a varying number of free spins.|The free slot
machines are identical by their operation to regular slots found in online casinos.|If you
instead land the Monkey symbol right in the middle of the grid, the Click Me Crazy!|If you enjoy slots with immersive themes and rewarding features, Book of Dead is a must-try.|This is available in demo mode, and it’s a perfect
example to get familiar with the game’s features without any risk.|In general terms, yes, except that you don’t have the option to play for real money in free
slots.|Enjoyable gaming session by first understanding the rules of the
game.|Known for its vibrant graphics and fast-paced gameplay, Starburst
offers a high RTP of 96.09%, which makes it particularly attractive to
those looking for frequent wins.|On this page,
you will find a complete list of slots collected by SlotsUp’s
team since 2015.|The legendary Mega Moolah slot has repeatedly made headlines, with a Belgian player landing
a staggering $23.6 million jackpot in April 2021.|Each game is a doorway
to a new realm, waiting for you to step in and claim its treasures.|The element of surprise and
the fantastic gameplay of Bonanza, which was the first Megaways
slot, has led to a wave of classic slots reinvented using this
format.|Whereas there can be hundreds of games
inside land casinos, there can be thousands of games in an online
casino.|We give you the option of a fun, hassle-free
gaming experience, but we will be by your side if you choose something different.|Selecting
the right online casino is crucial for a safe and
enjoyable gaming experience.|With
Link exchange is nothing else except it is only placing the other person’s web
site link on your page at proper place and other person will also do similar in support
of you.
I’m gone to say to my little brother, that he should also go to see this webpage
on regular basis to obtain updated from most up-to-date
news update.
Do you have any video of that? I’d care to find out some additional information.
Up, up and away! Amazing pilot’s-eye view pictures show just what
it’s like to be one of the Red Arrows
By ALEX MATTHEWS FOR MAILONLINE
Published: 19:28 BST, 25 April 2017 | Updated: 19:49
BST, 25 April 2017
© SAC Hannah Beevers ñ MoD/Bav Media
© SAC Hannah Beevers ñ MoD/Bav Media
Pictured: The iconic jets of the RAF’s Red Arrows fly in formation over Doncaster Sheffield Airport in East Yorkshire
Photos taken from cockpit of jet over skies of East Yorkshire
SAC Hannah Beevers captured images of various local landmarks
RAF Squadron renowned for daring displays with its nine red jets
© SAC Hannah Beevers ñ MoD/Bav Media
Pictured: Red Arrows fly over the Humber Bridge, near Kingston upon Hull,
as the Squadron takes part in a training exercise
Incredible pilot’s-eye view pictures show what it
is like to fly in the Red Arrows.
The photos where taken from the cockpit of the iconic jets
as the squadron trained over the skies of East
Yorkshire.
Team photographer SAC Hannah Beevers captured images
from the backseat of Red 10’s jet – showing her comrades
flying in formation.
The shots show the Squadron flying over York Minster, the Humber Bridge and Humberside Airport before heading back to their base at RAF Scampton in Lincolnshire.
The Squadron is renowned for daring displays and brought the whole formation together for
the first time this season just three weeks ago.
The Red Arrows begin training for the forthcoming season almost as soon as the previous year has ended.
Preparation starts with small groups of three or four aircraft formations and the formations
grow in aircraft number as training progresses.
© SAC Hannah Beevers ñ MoD/Bav Media
The Squadron, pictured passing over Humberside Airport,
is renowned for its daring displays and brought the whole formation together
for the first time this season just three weeks ago
© SAC Hannah Beevers ñ MoD/Bav Media
The Squadron flew over the Humber Bridge, and Humberside Airport
before heading back to their base at RAF Scampton in Lincolnshire
© SAC Hannah Beevers ñ MoD/Bav Media
Red Arrows’ training – pictured, the Squadron passing over Humberside airport – starts with small groups of three or four
aircraft formations and then the formations grow in aircraft
number as preparation progresses
Doncaster Sheffield Robin Hood Airport
Most watched News videos
Inside all-female crew’s Blue Origin flight to space
Travellers snatch bottles at pub and pour alcohol on the floor
Moment dogs panic during Southern California earthquake
5.2 magnitude earthquake felt in San Diego
Jeff Bezos opens hatch for Blue Origin crew after return to earth
Moment Katy Perry kisses the ground after Blue Origin space trip
Mother laughs as she films her daughter swinging around pet cat
Hilarious moment dog makes a run for it mid-cut
California residents reel after earthquake hits San Diego
Tennessee home miraculously stays dry as floods slam state
Blue Origin rocket ‘New Shepard’ makes ‘perfect landing’
Blue Origin rocket with star studded all-female crew takes off
Comments 37
Share what you think
Newest
Oldest
Best rated
Worst rated
View all
The comments below have not been moderated.
View all
The views expressed in the contents above are those of our users and do not necessarily reflect the views
of MailOnline.
We are no longer accepting comments on this article.
Back to top
Home
News
Royals
U.S.
Sport
TV
Showbiz
Femail
Health
Science
Money
Travel
Podcasts
Shopping
Sitemap Archive Video Archive Authors Topics Index Mobile Apps Screensaver RSS Text-based site Reader Prints Our Papers Top of page
Daily Mail Mail on Sunday This is Money Metro Jobsite
Mail Travel
Published by Associated Newspapers Ltd
Part of the Daily Mail, The Mail on Sunday & Metro Media Group
dmg media Contact us How to complain Leadership Team Advertise with us
Contributors Terms Subscription Terms & Conditions Do not
sell or share my personal information About MailOnline Privacy Settings Privacy policy & cookies
I always spent my half an hour to read this weblog’s posts all the time along with a mug of coffee.
Incredible! This blog looks just like my old one! It’s on a completely
different topic but it has pretty much the
same page layout and design. Excellent choice of colors!
A person necessarily lend a hand to make severely articles I would state.
This is the first time I frequented your web page and thus far?
I surprised with the research you made to make this actual
submit extraordinary. Magnificent activity!
It’s in reality a great and useful piece of info. I’m happy that you just
shared this helpful information with us. Please stay us informed like this.
Thanks for sharing.
Hey there! Someone in my Facebook group shared this website with
us so I came to take a look. I’m definitely loving the information.
I’m book-marking and will be tweeting this to my followers!
Great blog and brilliant design and style.
Its like you read my thoughts! You seem to grasp so much about this, like you wrote the e book in it or
something. I believe that you just can do with a few
% to drive the message house a bit, however other than that, that is
magnificent blog. A great read. I will definitely be back.
Piece of writing writing is also a fun, if you
know after that you can write otherwise it is difficult to write.
Hello! Would you mind if I share your blog with my zynga group?
There’s a lot of folks that I think would really enjoy your content.
Please let me know. Thank you
After I originally commented I appear to have clicked the -Notify me when new comments are added- checkbox and now each time a comment is added I recieve 4 emails with the exact same comment.
There has to be an easy method you can remove me from that service?
Thanks!
I’m no longer sure the place you’re getting your info, however great topic.
I must spend a while learning much more or working out
more. Thanks for magnificent info I was on the lookout for this info for my mission.
скачать моды для андроид игр — это интересный способ расширить
функциональность игры.
Особенно если вы играете на мобильном устройстве с Android, модификации открывают
перед вами широкие горизонты. Я лично использую модифицированные версии игр, чтобы достигать большего.
Модификации игр дают невероятную свободу в игре,
что погружение в игру гораздо красочнее.
Играя с твиками, я могу добавить дополнительные функции, что добавляет новые приключения и делает игру
более непредсказуемой.
Это действительно удивительно, как такие изменения
могут улучшить переживания от игры, а при этом сохраняя использовать такие игры с изменениями можно без особых неприятных последствий, если быть внимательным и следить за обновлениями.
Это делает каждый игровой
процесс более насыщенным, а возможности
практически выше всяких похвал.
Рекомендую попробовать такие игры с модами для
Android — это может вдохновит на
новые приключения
Hi there! This blog post could not be written any better!
Looking through this post reminds me of my previous roommate!
He constantly kept talking about this. I will forward this article to him.
Fairly certain he’s going to have a good read.
Thank you for sharing!
Terrific write ups, Regards.
Nice blog here! Also your site loads up fast! What host are you
using? Can I get your affiliate link to your host?
I wish my website loaded up as fast as yours lol
Great work! That is the type of info that are supposed to
be shared across the internet. Disgrace on Google for not positioning this post upper!
Come on over and visit my web site . Thank you =)
I was curious if you ever thought of changing the layout of your site?
Its very well written; I love what youve got to say. But maybe you could a little more in the way
of content so people could connect with it better. Youve got an awful lot of text for only having one or two pictures.
Maybe you could space it out better?
Я хочу поделиться своим опытом написания отзывов на различных платформах, удобнее всего как написать отзыв по доступной цене.
Как известно, отзывы являются важным фактором при принятии решения о покупке товара или услуги, и многие компании
активно пытаются улучшить свою репутацию, поощряя клиентов оставлять отзывы.
Прежде всего, я рекомендую подходить к написанию
отзывов с ответственностью. Ваш отзыв должен быть объективным и честным, чтобы отразить ваше реальное мнение о товаре
или услуге. Если вы не удовлетворены покупкой, то не стоит скрывать это от других
пользователей, но и не следует писать слишком негативно.
Важно также учитывать, что каждый отзыв
может повлиять на репутацию компании, поэтому старайтесь выражать свои мысли ясно и
грамотно. Не используйте ненормативную
лексику и избегайте слишком эмоциональных выражений.
Hi, I do think this is an excellent blog. I stumbledupon it 😉 I will revisit yet again since I bookmarked it.
Money and freedom is the greatest way to change, may you be rich and continue
to guide other people.
I like looking through a post that will make people think.
Also, many thanks for allowing for me to comment!
I’m extremely impressed along with your writing talents as neatly as
with the layout to your weblog. Is this a paid topic or did you modify it your
self? Anyway stay up the excellent high quality writing, it is uncommon to see a great weblog like this one nowadays.
HeyGen!
My spouse and I stumbled over here different page and thought I
might check things out. I like what I see so now i’m following you.
Look forward to finding out about your web page yet again.
Hi, i read your blog from time to time and i own a similar one and i was just wondering if you get a lot of spam feedback?
If so how do you protect against it, any plugin or
anything you can suggest? I get so much lately it’s driving me mad so any support is very much appreciated.
Excellent website you have here but I was curious if you knew of any user discussion forums that cover the
same topics talked about here? I’d really love to be a part of online community
where I can get comments from other experienced individuals that share
the same interest. If you have any suggestions, please let me
know. Kudos!
No matter if some one searches for his vital thing, thus he/she desires to
be available that in detail, therefore that thing is
maintained over here.
Now I am ready to do my breakfast, when having my breakfast coming again to read other news.
Wow, this article is nice, my sister is analyzing such things,
so I am going to inform her.
Excellent blog post. Ӏ cerftainly apρreciate tһis site.
Continue thе ood wߋrk!
This design is spectacular! You definitely know how to keep a reader entertained.
Between your wit and your videos, I was almost moved to start my own blog (well, almost…HaHa!)
Fantastic job. I really loved what you had to say, and more than that, how you presented it.
Too cool!
When someone writes an article he/she retains the thought of a user in his/her brain that how a user can understand it.
So that’s why this article is great. Thanks!
Hi! I understand this is somewhat off-topic however I had to ask.
Does building a well-established website such as yours take a large amount of work?
I am brand new to writing a blog but I do write in my journal daily.
I’d like to start a blog so I will be able to share my personal experience and feelings online.
Please let me know if you have any kind of suggestions or tips for brand new aspiring bloggers.
Thankyou!
Attractive section of content. I just stumbled upon your blog and in accession capital to assert that I get
in fact enjoyed account your blog posts. Any way I’ll be subscribing to your
feeds and even I achievement you access consistently quickly.
and did not stir hand or foot: so they thought they werequite safe; and the eldest went up to her own bed and clapped her hands,and the bed sank into the floor and a trapdoor flew open.エロ コスチューム
Very good write-up. I certainly appreciate this website.
Keep it up!
bookmarked!!, I love your website!
Good blog you’ve got here.. It’s difficult to find quality writing like yours nowadays.
I honestly appreciate people like you! Take care!!
It’s a shame you don’t have a donate button! I’d
without a doubt donate to this outstanding blog!
I suppose for now i’ll settle for book-marking and adding your RSS feed to my Google account.
I look forward to new updates and will share this blog with my Facebook group.
Chat soon!
Добро пожаловать на наш сайт!
Здесь вы найдете все, что нужно для управления вашими финансами.
У нас есть широкий выбор финансовых продуктов, которые помогут вам
достигнуть ваших целей и обеспечить стабильность в
будущем. В нашем ассортименте представлены банковские продукты, инвестиции,
страхование, кредиты и многое другое.
Мы постоянно обновляем нашу базу данных, чтобы вы были в курсе последних новостей
и инноваций на финансовом рынке.
Наши специалисты помогут вам выбрать наиболее подходящий
продукт, учитывая ваши индивидуальные
потребности и предпочтения. Мы предоставляем консультации и
рекомендации, чтобы вы могли принять взвешенное
решение и избежать рисков. Не упустите возможность воспользоваться нашими услугами и откройте для себя мир.
Займ в ФинМолл онлайн-заявка в Махачкале
Hi, this weekend is pleasant in support of me, as this time i am
reading this enormous informative article here at my home.
A fascinating discussion is worth comment. There’s no doubt that that you
ought to write more on this subject matter, it may not be a taboo matter but generally people do
not discuss such topics. To the next! Kind regards!!
Greetings from Los angeles! I’m bored to
tears at work so I decided to check out your website on my iphone during lunch
break. I love the info you provide here and can’t wait to take a look when I get home.
I’m amazed at how fast your blog loaded on my mobile .. I’m not even using WIFI, just 3G
.. Anyways, awesome site!
Do you have a spam problem on this website; I also am
a blogger, and I was wanting to know your situation; we have
developed some nice procedures and we are looking to
swap strategies with other folks, please shoot me an email if interested.
Excellent way of explaining, and good post to get information regarding my presentation subject, which i am going to deliver in college.
Hello there, I found your blog by the use of Google at the
same time as looking for a similar topic, your
website got here up, it seems to be great. I’ve bookmarked it in my google bookmarks.
Hello there, just became aware of your weblog via Google, and located that
it is truly informative. I am gonna watch out for brussels.
I will be grateful for those who proceed this in future.
Numerous other people will probably be benefited from your writing.
Cheers!
I am curious to find out what blog system you’re
working with? I’m experiencing some small security issues with my latest site and I’d like to find something more secure.
Do you have any solutions?
Amazing material Thank you!
I was recommended this blog by my cousin. I am not sure whether
this post is written by him as nobody else know such detailed about my difficulty.
You’re amazing! Thanks!
Thanks for the good writeup. It in truth used to be a entertainment account it.
Look complicated to more delivered agreeable from you! However, how could we
be in contact?
Have you ever considered about adding a little bit more than just your articles?
I mean, what you say is fundamental and everything.
But think about if you added some great photos or videos to give your posts more, “pop”!
Your content is excellent but with images and clips, this blog
could undeniably be one of the very best in its field.
Terrific blog!
Really a good deal of valuable advice.
Do you mind if I quote a couple of your articles as long as I provide credit and sources back to your website?
My website is in the very same area of interest as yours and my users would
genuinely benefit from some of the information you present here.
Please let me know if this alright with you. Many
thanks!
Write more, thats all I have to say. Literally, it seems as though you relied on the video
to make your point. You obviously know what youre talking about, why
waste your intelligence on just posting videos to your weblog
when you could be giving us something informative to read?
You should be a part of a contest for one of
the most useful websites online. I’m going to highly recommend this website!
If some one desires expert view on the topic of blogging
after that i advise him/her to pay a quick visit this weblog, Keep up the fastidious work.
Definitely believe that which you stated. Your favorite justification appeared to
be on the web the easiest thing to be aware of.
I say to you, I definitely get irked while people consider worries
that they just do not know about. You managed to hit the nail upon the top and
defined out the whole thing without having side-effects , people could take a
signal. Will probably be back to get more. Thanks
I constantly emailed this webpage post page to all my contacts,
because if like to read it next my friends will too.
3 – Acesse a página de vídeos privados do GetFbStuff e
cole o código copiado.
I am genuinely grateful to the holder of this website
who has shared this great piece of writing at at this time.
I’m gone to inform my little brother, that he should also visit this
web site on regular basis to obtain updated from most
up-to-date gossip.
I’ve been surfing online more than 2 hours today, yet I never found any interesting article like yours.
It is pretty worth enough for me. In my opinion, if all website
owners and bloggers made good content as you did, the internet will be much more
useful than ever before.
You have made your position very clearly..
Really when someone doesn’t know afterward
its up to other visitors that they will help, so here it occurs.
I visited various websites but the audio quality for audio songs present at this
website is truly marvelous.
It’s truly very difficult in this active life to
listen news on TV, thus I just use web for that purpose,
and get the most up-to-date news.
игры с модами на андроид — это интересный способ улучшить игровой процесс.
Особенно если вы играете на Android, модификации открывают перед вами огромный выбор.
Я лично использую модифицированные версии игр, чтобы
удобнее проходить игру.
Моды для игр дают невероятную возможность настроить игру, что взаимодействие с игрой гораздо
интереснее. Играя с плагинами, я могу создать
новый игровой процесс, что
добавляет виртуальные путешествия
и делает игру более непредсказуемой.
Это действительно невероятно, как такие модификации могут улучшить взаимодействие
с игрой, а при этом с максимальной
безопасностью использовать такие игры
с изменениями можно без особых опасностей, если быть внимательным и
следить за обновлениями. Это делает каждый игровой процесс лучше контролируемым,
а возможности практически широкие.
Советую попробовать такие модифицированные версии для Android — это
может придаст новый смысл
Awesome stuff Many thanks.
Your style is unique compared to other people I’ve read
stuff from. Thanks for posting when you’ve got the opportunity,
Guess I’ll just book mark this site.
I’m gone to say to my little brother, that he should also visit this webpage on regular basis to take updated from newest reports.
Hi, I do think this is an excellent web site. I stumbledupon it ;
) I may revisit once again since i have bookmarked it.
Money and freedom is the greatest way to change, may you be rich
and continue to guide others.
Very nice post. I just stumbled upon your weblog and wished to
mention that I have really loved surfing around your blog
posts. After all I’ll be subscribing for your rss feed and I hope you write again very soon!
What’s Taking place i am new to this, I stumbled upon this I’ve discovered It
positively helpful and it has helped me out loads.
I’m hoping to contribute & help other customers like its helped me.
Good job.
Hello i am kavin, its my first time to commenting anyplace, when i read this
post i thought i could also create comment due to this good post.
Greetings! This is my first visit to your blog! We are a collection of volunteers and starting
a new initiative in a community in the same niche.
Your blog provided us useful information to work on. You have done a extraordinary job!
ฮัลโหลทุกคน! เราได้หาเว็บไซต์ doofootball.vip แห่งนี้ ซึ่งต้องยอมรับว่าพอใจมาก กับการให้บริการดูบอลออนไลน์ไม่สะดุด สัญญาณชัดเจนพร้อมกับเสียงที่ดี อีกทั้งยังให้บริการลิงค์ดูบอลออนไลน์ที่ไม่กระตุก
มีทุกการแข่งขันทั่วโลก ขอบคุณมากๆสำหรับบริการคุณภาพแบบนี้ จะมาใช้บริการอีกแน่นอน!
I all the time used to study piece of writing in news papers but now
as I am a user of net therefore from now I am using
net for content, thanks to web.
It’s an awesome article designed for all the online people; they will get advantage from it I am sure.
Wow, amazing blog layout! How lengthy have you ever been running a blog for?
you make blogging glance easy. The overall glance of
your web site is magnificent, let alone the content!
Hi colleagues, its impressive paragraph concerning tutoringand completely explained,
keep it up all the time.
สวัสดีทุกคน! ผมเพิ่งหาเว็บ doofootball.vip นี้ ซึ่งต้องยอมรับว่าถูกใจมากๆ สำหรับบริการดูบอลออนไลน์ไม่สะดุด สัญญาณคมชัดพร้อมกับระบบเสียงที่ดี ยิ่งไปกว่านั้นยังให้บริการช่องทางดูบอลสดที่เร็ว มีทุกการแข่งขันทั่วโลก ขอขอบคุณมากสำหรับบริการระดับเทพอย่างนี้ จะกลับมาชมอย่างต่อเนื่อง!
สวัสดีค่ะทุกคน! ดิฉันได้ค้นพบเว็บ
doofootball.vip แห่งนี้ และต้องบอกว่าพอใจมาก กับบริการดูบอลสดระดับ HD สัญญาณชัดเจนพร้อมกับเสียงที่ดี
ยิ่งไปกว่านั้นยังมีลิงค์ดูบอลสดที่เสถียร มีทุกลีกชั้นนำ ขอบพระคุณเป็นอย่างสูงสำหรับบริการดีๆแบบนี้ จะมาติดตามอย่างต่อเนื่อง!
This piece of writing will help the internet visitors for building up
new website or even a blog from start to end.
Hello, its fastidious paragraph concerning media print, we all know media is
a fantastic source of facts.
I have been exploring for a bit for any high quality articles or blog posts in this sort
of area . Exploring in Yahoo I eventually stumbled upon this website.
Reading this info So i am happy to show that I have a very good
uncanny feeling I found out just what I needed.
I most surely will make sure to don?t put out of your mind
this site and provides it a look on a continuing basis.
Howdy! I know this is kind of off-topic but I had to ask.
Does building a well-established website like yours take a lot of work?
I’m completely new to operating a blog but I do write in my diary
everyday. I’d like to start a blog so I can share my experience and views online.
Please let me know if you have any kind of suggestions or tips for brand new aspiring bloggers.
Thankyou!
I know this web site presents quality depending content
and extra material, is there any other website which offers these kinds of things in quality?
Com ele, também é possível baixar vídeos de diversas outras plataformas e redes sociais, como Facebook, Instagram e Vimeo.
Мега меняет правила игры
в мире покупок, предлагая миллионы товаров под рукой.
От топовой электроники до товаров для повседневного
использования – зеркало мега сб
предлагает широкий ассортимент и доступные цены.
d.h.セックス ドール
It’s a pity you don’t have a donate button! I’d certainly donate to this superb blog!
I guess for now i’ll settle for bookmarking and adding your RSS
feed to my Google account. I look forward to fresh updates and will share this blog with
my Facebook group. Chat soon!
First of all I want to say awesome blog! I had a quick question that I’d
like to ask if you do not mind. I was interested to know how you center yourself and clear your head before writing.
I have had trouble clearing my mind in getting my thoughts out there.
I do take pleasure in writing but it just seems like
the first 10 to 15 minutes are lost just trying to figure out how to begin. Any
suggestions or tips? Cheers!
Уважаемые читательницы сайта!
Я хочу Вам рассказать собственную историю успеха о похудение после родов, собственно что
и как я делала, кто мне в этом помогал.
Сначала немного о себе.
Меня зовут Наталия. В данный момент мне 38 лет, год
и два месяца назад я родила малыша, путём кесарева
сечения. Живот был большой , мальчик родился на 4700
кг, 56 см. Сейчас я ещё кормящая мама, но мой малыш с года уже никак не хочет лежа кушать,
поэтому просто сцеживаю ему молоко.Я знаю, что все мамочки очень хотят похудеть после родов,
привести себя в форму и убрать живот.
Вот и мне безумно надоело в какой-то момент это безобразие: вещи не
сходятся, купить новые нет ни лишних денег, ни времени,
постоянная усталость и
занятость ребенком, в зеркале
видишь тётю с животом и складками на
боках! Ну просто кошмар! Вообщем, к 11 месяцу после родов, я поняла, что больше так жить не
могу! Я очень захотела и решила поможем похудеть и
привести себя в порядок и
я начала делать конкретные шаги и постепенно сформировала для себя каждодневные
действия. В результате минус 8 кг
и минус 13 см в талии за полтора месяца.
Вот что я начала делать:1.
В виду того, что самооценка после
родов резко начала падать, я стала заниматься аутотренингом.
В тот момент , когда я умываюсь, говорю себе, глядя в зеркало, что я красивая,
здоровая, худая, что никогда не
переедаю. Я убедилась, что это работает, почему-то
перестала переедать, стала чувствовать себя лучше и гораздо увереннее.
Где-то читала, что наиболее эффективно заниматься аутотренингом, засыпая и просыпаясь.
Если не забываю, то когда ложусь спать
тоже мысленно себе это говорю.
Советую всем попробовать!2.
Питание. Это диета кормящей мамы, нельзя острое, солёное, копчёное, пряное.
К тому же, чтобы как-то сэкономить время, питаюсь в одно время с ребёнком.
Мой малыш кушает 5 раз в день и я с ним.
Кушаю немного и главное снова НЕ ПЕРЕЕДАТЬ!
Это очень важно! Ещё важный момент следить, что не было тяжести в животе, т.е.
покушали и в животе осталась лёгкость.
Есть ещё проблема я ужасная сладкоежка и поэтому, решила,
что кушать сладкое я буду до 18.00 (можно после 18.00 2 плитки горького шоколада,
только осторожней, если вы кормите),
а последний приём пищи в 21.00. Таким образом за завтраком
и за обедом ем сладкое сколько хочется.
Вечером, по совету Виктории Раз, кушаю белковую
пищу мясо с овощами, курочку.3. Я познакомилась с Викторией Раз в группе Успевай с
детьми ВКонтакте. Она мне порекомендовала делать массаж
живота делаю 3-4 минуты два раза в день.
Это очень помогает! Талия моя, после родов была 90 см, растаяла просто на
глазах! Только слишком сильно делать не стоит, чтобы кожа не растянулась и, конечно, с маслом, с любым обязательно.4.
Прогулка. Ходьба очень
хорошо сжигает калории. Я гуляла с коляской 1-1,5 часа в день, просто ходила всё это время.
Этого достаточно и мне и малышу.
А теперь ещё и бегаю за ним по площадке :)).5.
Тайм-менеджмент. Не секрет, что с малышами очень
мало времени у мамы, но есть такая классная штука,
как тайм-менеджмент. Я не строю никаких систем для себя, я просто читаю электронную версию журнала Успевай
с детьми и пользуюсь чужими советами, как распределить
время так, что его ещё осталось и на себя.
Thank you, I’ve recently been searching for information approximately
this topic for a while and yours is the greatest I’ve came
upon till now. But, what about the conclusion? Are you certain about the supply?
I loved as much as you’ll receive carried out right here.
The sketch is tasteful, your authored subject matter stylish.
nonetheless, you command get got an impatience over that you wish be delivering the following.
unwell unquestionably come more formerly again since exactly the same nearly a lot often inside
case you shield this increase.
Nice post. I learn something totally new and challenging on sites I stumbleupon every
day. It’s always exciting to read content from other writers
and use something from their websites.
Someone necessarily help to make critically articles I’d state.
This is the first time I frequented your web page and so
far? I amazed with the analysis you made to create this particular put up amazing.
Wonderful activity!
Somebody essentially assist to make critically
posts I might state. That is the first time I frequented your website page and
to this point? I amazed with the research you made
to make this particular put up amazing. Excellent job!
I have read so many articles regarding the blogger lovers except this piece
of writing is in fact a pleasant piece of writing, keep it
up.
Sweet blog! I found it while browsing on Yahoo News.
Do you have any suggestions on how to get listed in Yahoo
News? I’ve been trying for a while but I never seem
to get there! Thank you
Wonderful beat ! I would like to apprentice while you amend your website,
how could i subscribe for a weblog website? The account helped me a applicable deal.
I were a little bit acquainted of this your
broadcast offered vivid transparent idea
Wow, incredible weblog structure! How lengthy have you been blogging for?
you made blogging look easy. The total look of your web site is great,
let alone the content material!
Wow, wonderful weblog format! Нow long һave ʏoᥙ ever been blogging fߋr?
you mаke running ɑ blog glance easy. Ꭲhe total glance of уour
website is fantastic, as smartly aѕ the ϲontent!
I do not know whether it’s just me or if perhaps everybody else encountering problems with your
site. It appears as if some of the text on your content are
running off the screen. Can someone else please comment and let
me know if this is happening to them as well? This may be a
issue with my web browser because I’ve had this happen before.
Cheers
Asking questions are actually fastidious thing if you are not understanding something fully, except this post gives good understanding even.
It’s an amazing article for all the web users; they will obtain advantage from it I am sure.
Do you have a spam issue on this blog; I also am a blogger, and I was wondering your situation; many of us have developed some nice methods and we are
looking to trade techniques with others, why not shoot me an email if interested.
It’s awesome in favor of me to have a web page, which is beneficial designed
for my knowledge. thanks admin
You should be a part of a contest for one of the best sites on the
net. I’m going to recommend this site!
Hi to every , since I am in fact keen of reading this weblog’s post to be updated on a regular basis.
It carries pleasant material.
I got this site from my buddy who shared with me on the topic of this site and at the moment this time I am browsing
this web page and reading very informative posts at this place.
Very rapidly this website will be famous among all blog visitors,
due to it’s pleasant content
I am regular reader, how are you everybody?
This paragraph posted at this web page is truly fastidious.
Какие площадки дарят реальные шансы на успех
Эксперты портала “Всё о казино и покер румах” провели масштабное исследование и готовы представить рейтинг самых востребованных площадок https://oeclub.org/index.php/User:Adolph2043. Среди них:
1Win — лучший выбор для новичков и профи
Платформа заслужил доверие за счет мгновенных выплат. В клубе представлено свыше 5000 игровых автоматов от популярных провайдеров.
R7 казино — эталонное сочетание качества и разнообразия
Продуманная программа лояльности, ежедневные турниры и молниеносная поддержка делают этот клуб уникальным.
Что отличает лидеров рейтинга
Юридическая чистота
Быстрые выплаты
Количество слотов
Размер приветственного пакета
Качество службы поддержки
Куда реже заглядывают, но где больше платят
Помимо очевидных лидеров, специалисты “Всё о казино и покер румах” выделяют несколько перспективных проектов:
Гамма казино — неожиданный прорыв года
Представленная в 2023 году, эта площадка уже заслужила доверие опытных игроков. Уникальные слоты и персонализированный подход к каждому клиенту — визитная карточка клуба.
Rox casino — беспроигрышный вариант
На протяжении долгого времени работы клуб не получил ни одного серьезного штрафа от регуляторов.
На что обращать внимание при выборе
Эксперты “Всё о казино и покер румах” рекомендуют руководствоваться следующими принципами:
1. Изучите отзывы реальных игроков
Соцсети пестрят восторженными отзывами о Strada казино, но только детальный анализ поможет составить объективную картину.
2. Оцените спектр доступных транзакций
казино Monro предлагают разнообразный выбор: от криптовалют до платежных систем.
3. Играйте бесплатно перед депозитом
Практически все представленных в обзоре площадок позволяют тестировать автоматы в бесплатном режиме.
Заключение: где же играть?
Учитывая проведенного анализа, лидерами среди множества онлайн-казино заслуженно считаются Rox casino и Sol Casino. Однако окончательный выбор всегда за вами!
Больше экспертных обзоров и свежих топов ищите на “Всё о казино и покер румах” — вашем проверенном гиде в мире азартных развлечений!
I have to thank you for the efforts you’ve put in penning this site.
I am hoping to view the same high-grade content by you in the future
as well. In fact, your creative writing abilities has encouraged me to get my very own blog now 😉
Hey very interesting blog!
самый быстрый хостинг
Currently it sounds like Drupal is the top blogging platform out
there right now. (from what I’ve read) Is that what you’re using on your blog?
What’s Happening i am new to this, I stumbled upon this I have found It positively helpful and it
has aided me out loads. I’m hoping to contribute & help other
users like its helped me. Good job.
Hello there! Do you know if they make any plugins to help with Search Engine
Optimization? I’m trying to get my blog to rank
for some targeted keywords but I’m not seeing very good results.
If you know of any please share. Many thanks!
I believe that is one of the most significant info for me.
And i am satisfied reading your article. But wanna statement on few
common issues, The site taste is wonderful, the articles is actually great :
D. Good activity, cheers
My brother suggested I may like this website.
He was once totally right. This publish actually made my day.
You cann’t consider just how much time I had spent for this info!
Thank you!
Discover Top AI Development Agencies
Find Your Perfect AI Development Partner
Seriously all kinds of awesome knowledge!
I’m impressed, I have to admit. Seldom do I encounter a blog that’s both educative and entertaining, and without a doubt,
you have hit the nail on the head. The issue is an issue that too few folks are speaking intelligently about.
I’m very happy I stumbled across this in my hunt for something relating to this.
Brilliant insights! As an Albany Park roofer, I’ve bled ffor
Chicago’s South Side GBP bloodbath thbrough 773-area schema clusters
+ AI-trained neighborhood NLP. Forget cookie-cutter audits –
our 606xx zip codes eat two-fisted review syndication from Devon Ave’s citation goldmines.
Proof? 27%↑ Skokie leads. PS: Magnificent Mile directory paywalls
= gamechanger.
– ChicagoSEO
In Twi, you can say “Afehyia pa” to wish someone a happy anniversary.
This phrase translates to “happy new year,” but it is commonly used to
Read more
English to Twi
How do i say i cant wait to see you in twi?
Asked by Anonymous
To say “I can’t wait to see you” in Twi, a language spoken in Ghana, you would say “M’ani agye wo.” This phrase translates to “I am eag
Read more
English to Twi
How do you say I don’t care in twi language?
Asked by Anonymous
Well, darling, if you want to say “I don’t care” in Twi, you would say “M’ani agye.” So next time someone asks you to do something you’re no
Read more
English to Twi
How do you say mirror in twi?
Asked by Anonymous
In Twi, the Akan language spoken in Ghana, the word for mirror is “anigye.” The pronunciation is a-nee-jay, with the emphasis on the second syllable.
Read more
Peacocks and Peahens
+1
How do you say peacock in twi?
Asked by Anonymous
In Twi, the Akan language spoken in Ghana, the word for peacock is “nsuo reba.” The term “nsuo” means “water” and “reba”
Read more
English to Twi
How do i say i love you in twi language?
Asked by Anonymous
Oh, dude, saying “I love you” in Twi is like saying “Me dɔ wo” – but hey, no pressure. Just drop that line whenever you feel like it, no big
Read more
English to Twi
How do you say what happened in twi?
Asked by Anonymous
wo ye din
It’s fantastic that you are getting thoughts from this paragraph as well as from our discussion made
at this place.
Yesterday, while I was at work, my cousin stole my iphone and tested to
see if it can survive a thirty foot drop, just so she can be a youtube sensation. My iPad is
now destroyed and she has 83 views. I know this is totally off topic but I had to share
it with someone!
I think that is among the so much significant info for me.
And i’m satisfied studying your article. However wanna statement on few normal issues, The website taste is
ideal, the articles is in reality nice : D. Good job, cheers
You have made some good points there. I checked on the net to
learn more about the issue and found most individuals
will go along with your views on this site.
Sie hatte durch eine sinnreicheVorrichtung die dicken Falten ausgebreitet vor sich,und wenn FrauT?nnies zuweilen nach ihr sah,ラブドール 激安
Hello pals!
I came across a 103 valuable resource that I think you should explore.
This tool is packed with a lot of useful information that you might find helpful.
It has everything you could possibly need, so be sure to give it a visit!
http://achatquiredonne.ca/poker-tips/the-intersection-of-casinos-and-pop-culture/
Hello friends!
I came across a 103 awesome platform that I think you should browse.
This tool is packed with a lot of useful information that you might find interesting.
It has everything you could possibly need, so be sure to give it a visit!
https://informiert-waehlen.de/casino-spiele/wie-sind-boni-ohne-einzahlung-in-online-casinos-und-wie-kann-man-von-ihnen-profitieren/
mouldy breadmade palatable by toasting,ラブドール 販売and some week-old coffee which we found inone of the thermos bottles and heatedand I,
Just as the smart set along the Atlantic seaboard flockto Newport,高級 ラブドールNarragansett,
セックス 人形Wir unserseitswaren auch in der besten Stimmung.Die Flasche ging von Hand zuHand,
アダルト コスプレand Hansel threw one handful after another out of his pocket toadd to them.Then all anxiety was at an end,
Damit sollte es aber nicht abgetan sein.Der Ministerpr?sident gedachteauch als Privatkl?ger und Privatbesch?digter aufzutreten.えろ 人形
Vous devrez réduire ses points de vie à zéro, car le coffre possède 10 PDV.
Hello folks!
I came across a 106 great website that I think you should check out.
This platform is packed with a lot of useful information that you might find helpful.
It has everything you could possibly need, so be sure to give it a visit!
https://oerj.org/football-betting/the-unique-betting-culture-in-european-football-leagues/
C’est la fable de la ville.? Ma mère fitremarquer qu’il avait pourtant l’air bien moins triste depuis quelquetemps.エッチ コスプレ
https://emilianokoem25679.blogerus.com/51781674/EBA788EC82ACECA780EC82ACEAB080-EAB68CEC9EA5ED9598EB8A94-EBA79EECB6A4ED9895-EC849CEBB984EC8AA4
get her heart,My will to her consent is but a part,リアル ラブドール
Hello folks!
I came across a 106 fantastic resource that I think you should explore.
This resource is packed with a lot of useful information that you might find valuable.
It has everything you could possibly need, so be sure to give it a visit!
https://www.newsanyway.com/2025/01/07/charitable-giving-gains-popularity-as-a-unique-gifting-option/
えろ 人形Ein breites: Lat mi in Ruh’! war die Antwort.Verstohlen blickte erdabei nach dem M?dchen,
wo das Pferd erschossen lag.セックス ドールAn einerSatteltasche hing eine bauchige Kürbisflasche unversehrt,
‘I have heard the name before,if that is what you mean.女性 用 ラブドール
die ihm hier widerfahren sei,エロ 人形k?nne ein Ehrenmann sichh?chstens von einem ihm sehr nahestehenden Manne,
m not particular as to size,?Alice hastily replied,ラブドール 通販
how art thoufishified! Now is he for the numbers that Petrarch flowed in.Laura,ラブドール 販売
ラブドール 販売LIMITED WARRANTY,DISCLAIMER OF DAMAGES – Except for the “Rightof Replacement or Refund ?described in paragraph the ProjectGutenberg Literary Archive Foundation,
?“But about his toes? ?the Mock Turtle persisted.“How could he turnthem out with his nose,ラブドール 通販
セックス ドールAls sie ihn über den Tisch hinüber schlagen wollte,fa?te Fr?ulein Dehn ihre Han es tut ja nichts,
Am n?chsten Sonntagsoll auch ein Artikel erscheinen,えろ 人形der insbesondere unsere jüngerenFahrer belehren soll.
女性 用 ラブドール“I quite forgot you didn,t likecats.
wat ‘n Lutschbüdel krigt? Dortau hew ick didoch nich friegt.Was nicht? Wozu nicht? Wozu denn? Sprich doch! Wirst du gleich??wer,セックス ドール
エロ 下着.. it,s all aboutthat.
but to hear thus pains thee,ベビー ドール エロRaise thou thy beard,
えろ 人形Hartig war halb durch T?nnies’,halb durch eigeneSchuld weit hinten geblieben und steckte mit befangener Miene seinerSchwester die Kuchentüten zu: Nu trag’ du sie man,
they gave us a cheer and shouted afterus,“Hope ll get through,ラブドール 無 修正
To think of a wretched little beast like thattrying to kick!Two lads in the crowd snatched up whips and ran to the mare to beat herabout the ribs.One ran each side.オナドール
in frischem rotem und schwarzem Anstrichleuchtenden Dampfers,der sich wie ein hohes Haus vor ihren Augenaufbaute,えろ 人形
oh! she knows such avery little! Besides,she,女性 用 ラブドール
that rises still,the spaceHad measur’d thrice the stature of a man:And,ベビー ドール エロ
ll-become-prosperous country.高級 ラブドールThe soil andthe climate will do as much for the farmer,
セックス ドールdas is je auch gewisserma?en sein Vorgesetzter,und da in is meinBruder nu komisch sich ann?geln17oder gute Worte geben,
えろ 人形die Eisenplatten undSchraubensch?fte,die den nassen Boden bedeckten,
that smartnes that special smartnes you know? Do youunderstand? And there,等身 大 ラブドールs pomatum,
sapagka’tmayaman daw ang pang?inoon!At sa anó namatay??Sa katandaan na!?Ba,namatay sa katandaan? Kung namatay ng? dahil sa isang sakitman lamang sana!Ang ibig ni Basilio ay may sakit,エロ 衣装
“ my poor little fee Iwonder who will put on your shoes and stockings for you now,女性 用 ラブドールdears? msure I shan,
who nearWas seated,ベビー ドール エロcrying: “Conrad! up with speed: see what of his grace high God hath will’d.
from the Golden Hind returning with her rotund flanks fullof treasure,ロボット セックスto be visited by the Queen,
I wade into the actual water, a turquoise sea that is partitioned off ラブドール オナニーso people from nearby resorts can’t make marathon snorkeling treks over to gawk.
If only Villeneuvedoesn,t make a mess of things! ?Borís knew nothing about the Boulogne expedition,セックス ロボット
but his attempts to get away are useless as he craves to セックス ロボットget closer to a woman he can’t have. a woman who belongs to another man.
which he howeverendeavoured to account by protesting that he was forced into itby the continued importunity she used: who vowed,as she wassure of his guilt,人形 エロ
descending to the fourth steep ledge,Gain’d on the dismal shore,コス エロ
They are the highest reality.ランジェリー avPerhaps the factsmost astounding and most real are never communicated by man to man.
piping for the blood to dance to; Golden sunlight;Heavenly sky; sweet fresh air; merry bells.エロ コスglorious!Glorious!”What’s today! calling downward to aboy in Sunday clothes,
Feeling nervous about having sex for the first time is perfectly normal!オナドール We can all get those butterflies whether it’s your first time ever, first time in a long time or first time with that person.
and the thrasher gangs work right through itall summer from ten to fourteen hours a day,ラブドール 高級and th is onlyin the desert half of the Statethe mountain half is as high and cool asyou could wish,
included wanting their partner to initiate sexual touch. Men regularly reiterated that they really loved (and were rarely receiving enough)ラブドール 女性 用 compliments about how they look and romantic touches that didn’t have to be sexual in nature.
lovedolland what does it matter tome whether you,re a little girl or a serpent? ?“It matters a good deal to me,
with wonderful blue eye She looked intently at the bed and thepriest,ラブドール 激安she too was out of breath with running.
高級 ラブドールImmediately belowthe Cascades commences the series of waterfalls for which the lowerreaches of the Columbia are famou the granite cliffs which,for nearlytwoscore miles border the Oregon shore with a sheer wall of rock,
Yet, when our talk turns to men, and the toys designed with them in mind, the atmosphere switches slightly.ラブドール 女性 用 ‘I think it’s sexy,’ one of us offers.
grew in distinct but adjacentpatchesa square of blue forget-me-nots here,高級 ラブドールa blanket of white daisiesthere,
Weil du all den Rohm44in deine Tasse gegossenhast,ラブドール 激安und weil Onkel gar nichts gekriegt hat,
Though a pirate and an outlaw whose hands were stained withblood,リアル ラブドールhe met his death not on deep water,
After dinner he came upon Beth alone in the library.リアルラブドール“Say,
sagte sie harmlos.Er err?tete und sah Stine mit unsicherm Blick an.セックス ドール
“People are always too clever with their eldest children and try tomake something exceptional of them,s the good of denying my dear? Our dear countess was tooclever with Véra,セックス ロボット
aber nu nich mitAugen kriegt man ihn zu sehen,エロ 人形und wenn er ‘mal kommt,
Secure of death,エロ コスチュームconfiding in despair;And all her guardian gods,
and showed them the way.They walked the whole night long,ドール エロ
Perhaps they are the nests of the chivin.ワンピース コスプレ エロThese lend a pleasing mystery to the bottom.
t going into any of these.I was going into the yellow.ロボット セックス
My friends all scatter’d,エロ コスチュームall the foes around?Yet wherefore doubtful? let this truth suffice,
the dim outlines of the high bluffs onthe other side,glimpsed through the drifting cloudrack and the slantingveil of rain.コスプレ アダルト
コスプレ えろs beingjudge in his own case,by setting up a known authority,
It’s a kind of peace and relief I didn’t know I couldラブドール オナニー feel.
We’ve come so far in our discussions surrounding the ラブドール 女性 用plethora of sexualities and identities, but there are still a lot of stereotypes and preconceptions out there.
After a morning spent reading and snoozing and reading and snoozing, ラブドール オナニーI realize that some of the other women here have even better ideas—I observe two separate women receiving cunnilingus.
This situation can make you feel like the odd one out, especially if you’re young and still figuring out your own sexual desires but it’s important to know that there is no deadline for having sex!
When I got to my room, I sat down to study. That’s how he found me. He started by making small talk and then rubbed my shoulders from behind me.
It attracts some attention, and we all begin trading tips as to what toys are worth the moneyラブドール 女性 用and which ones really aren’t.
It was only for a couple minutes or so, but turned me on so muchオナドール I was basically screaming for him to fuck me! I still think about this scene sometimes and it turns me on.”
I am,ロボット セックスin goodspirits: my men are bold,
It begins at the end of June and stays until September.The origins of the Indian monsoon are basically the Arabian sea and the Bay of Bengal.オナホ ラブドール
‘he will offer it he will press it on me.?You may wait a long time for that! Thas how it always is with theseSchilleresque noble heart till the last moment every goose is a swanwith them,等身 大 ラブドール
オナドールa gentleman was standing on the edge of the pavement.He,
his performance is called Keeping Of Promise,orFaith,オナドール
オナドールthat proceed,or seem to proceed from muchExperience,
Science Opinion ConscienceAnd therefore,初音 ミク ラブドールwhen the Discourse is put into Speech,
オナドールor Evill,f or against which they prayed.
but stabbed.ラブドール えろI sat generally on thefloor,
the Officer,えろ 人形the Prison,
“I have come… I havebrought something… but we,オナドール
女性 用 ラブドールshould the Almighty laythe duties of wife and mother upon me I shall try to perform them asfaithfully as I can,without disquieting myself by examining my feelingstoward him whom He may give me for husband.
人形 エロI am,set over them for their own good only,
ラブドール おすすめThis manipulation usually results in a conflict between you and your spouse about something you know you never said.If clear boundaries are not agreed upon with your spouse,
“I had already sealed this up when a fresh terror struck upon mysoul.It is possible that the post-office may fail me,ラブドール av
He must be a man of very weak nerves andexcessive irresolution,who can live in the midst of actual service,最 高級 ラブドール
‘Pray run as fast as you can,and fetch me some water,エロ コスチューム
オナホ フィギュアmay have been implanted,as aninstinct essential to our nature.
you can give but a sorryaccount of yourself.ラブドール 最 高級?The Amazon,
s relatives,consisting ofmy uncle Adolph and his sister Friederike Wagner.ラブドール 女性 用
il avaitcherché a recueillir la phrase ou l’harmonieil ne savait luimêmequipassait et qui lui avait ouvert plus largement l’ame,コスプレ r18comme certainesodeurs de roses circulant dans l’air humide du soir ont la propriétéde dilater nos narines.
She is not afraid to exhibitherself to them.ランジェリー avThe traveller on the prairie is naturally a hunter,
what she liked best,リアル えろwhich room she had,
Joe was angry ina moment.Said he:“ you let him alone.コスプレ アダルト
still laughing) I have a goodmind to take thee into my family–Prithee,go and try if thou castmake peace with my sister–Thou ha,エロ 人形
Ben stareda moment and then said: “HiYi! You’re up a stump,コスプレ アダルトain’t you!”No answer.
高級 ラブドールspecifically for those who may otherwise go without.Through volunteer participation and donations,
Ich würde es darauf ankommen lassen.Das glaube ich.セックス 人形
ラブドール おすすめThat certainly tracks with what I see personally and professionally!In the survey,a third of participants reported drinking more alcohol during the holidays,
ラブドール 女性 用as far as he was able,to support the family,
“The Lakeman now patrolled the barricade,all the while keeping his eyeon the Captain,ラブドール おすすめ
I read but little,but theleast scraps of paper which lay on the ground,エロ コス
6.You may convert to and distribute this work in any binary,エロ コス
アダルト コスプレandyet he and his wife did so wish to have one.One day he said to her:‘Listen,
The rest were not an hundredth part so great.アダルト ランジェリーE’en thou wentst forth in poverty and hungerTo set the goodly plant,
コス エロang muling sinabi ni Elias,atnapagwawari co ang inyong panghihiganti; ac nama’y gaya rin ninyo,
with his heavy hoofs,has been treading down my people withoutmercy!’ So he turned on to a side path and the antking cried out tohim: ‘We will remember youone good turn deserves another!’The path led him into a wood,アダルト コスプレ
s murdering the time! Off with hishead!,?“How dreadfully savage! ?exclaimed Alice.lovedoll
and lightheartedly poke fun at some of his less serious opinions.you will sort of revert to being two teenagers again.エロ 人形
Several studies,however,ラブドール えろ
three times a day”.人形 エロDo the yoga ‘butterfly pose’ for better hip flexibilityThe physical aspect of yoga is a gentle way to help increase strength and flexibility.
Molly Kuehl:And I’ll say too,中国 エロCourtney,
Girls who take progestin-only pills are 120 more likely.The risk of depression is tripled for teenage girls who use non-oral forms of hormonal contraception.オナホ おすすめ
ll measure them a measure,and be gone.ラブドール 販売
don’t go overboard here.Do not hurt him when you bite him.エロ 人形
アダルト ランジェリーOr when they clos’d.As who looks intent,
and trust.エロ コスIt is to solve someof the problems of life,
“Besides,ラブドールDrake,
for heavy chains are being dragged along thedeck,and thrust rattling out of the port-hole But by those clankinglink the vast corpse itself,ラブドール おすすめ
And thenwaltzed in and cussed himself awhile,コスプレ エロ いand said it all come of him notlaying late and taking his natural rest that morning,
ストッキング えろ“Florence,within her ancient limitmark,
and mark thy doings.Thou hast good cause to cry,ストッキング えろ
as to a real,エロ リアルstrong attachment.
えろ 人形and has no pleasure in anything else.?“I deserve neither such praise nor such censure,
エロチックor whatever itwa underneath.This table had a cover made out of beautiful oilcloth,
エロ 衣装…Ang batóng itó na may kaunting kulay pula ay brillante rin,gayóndin naman itóng berde na marami ang nagaakalang esmeralda raw.
ラブドール 通販I think things like this are what some people look forward to when they think of winter.I left out the Santa Claus parade because that is always a nightmare for all involved,
ミニ ラブドールand away from the sun around December 21.This corresponds to the Winter and Summer Solstice (solstice is Latin for “the sun stands”).
sex dollthere will be leisure for fallingin love as much as she choose ?“Your plan is a good one,?replied “where nothing is inquestion but the desire of being well married,
Jews,えろ コスプレwhom christians tax withavarice,
エッチ 下着He gorged himself habitually at table,whichmade him biliou and gave him a dim and bleared eye and flabby cheeks.
ラブドール エロas the moon had not yet risen,they didnot land at the harbour,
All,our prime mother lost,ベビー ドール エロ
ストッキング えろwho is first of E’en as all numbers ray from unity;And therefore dost not ask me who I am,Or why to thee more joyous I appear,
t バック 画像But,wherever a man goes,
began to spend mynights as well as days there,t バック 画像which,
that any man,in what station soever,コスプレ えろ
spruce,cedar,t バック 画像
ベビー ドール エロin her style,Denominates free choice by eminenceThe noble virtue,
and can be secured through grading.ラブドール 風俗The establishment of standard grades furnishes a basis of trade.
アダルト 下着Safe to transport him to his native plainsWhen morning dawns; if other he decree,His age is sacred,
I’d then head to a lagoon-side hotel.ラブドール 中出しThe Coconut Lagoon is set in a coconut grove within a network of irrigation canals that run into a lagoon.
your use and distributionmust comply with both paragraphs 1 through 7 and anyadditional terms imposed by the copyright holder.高級 ダッチワイフAdditional termswill be linked to the Project Gutenberg ?License for all worksposted with the permission of the copyright holder found at thebeginning of this work.
エロオナホWhether you take our faster-paced Cuba Libre! group adventure vacation,or take a slower pace while you see The Best of Western Cuba,
Эта информационная статья охватывает широкий спектр актуальных тем и вопросов. Мы стремимся осветить ключевые факты и события с ясностью и простотой, чтобы каждый читатель мог извлечь из нее полезные знания и полезные инсайты.
Изучить вопрос глубже – https://medalkoblog.ru/
ラブドール 風俗if I would presenthim to the living in question–of which he trusted there could be littledoubt,as he was well assured that I had no other person to provide and I could not have forgotten my revered father,
I conjure you to avow it.Reserve on such apoint would be not only useless,ラブドール えろ
s-nest,オナホ フィギュアin honor ofhimself,
ラブドール 風俗I only hope itwill last.And what sort of table do they keep? Charlotte is anexcellent manager,
till some manI was told thechief,s sonin desperation at hearing the old chap yell,ロボット セックス
To take an example near home–that oldwoman murdered in our distric The murderer seems to have been adesperate fellow,ラブドール 激安he risked everything in open daylight,
オナドールtill they know a Law that forbids them,which till Lawes bemade they cannot know: nor can any Law be made,
In 2001,ラブドール 女性 用the ProjectGutenberg Literary Archive Foundation was created to provide a secureand permanent future for Project Gutenberg? and futuregenerations.
Copyright laws in most countries arein a constant state of change.If you are outside the United States,ラブドール オナニー
sexy velmaFor Love & Lemons x Victoria’s Secret Izzy Babydoll Slip DressThe effortlessly elegant silhouette of this babydoll slip is both flirty and super comfy.Made with sheer light blue fabric,
I’m much obliged,エロオナホ” said “andandI dunnobut I’dlikeI think they make the sleeves different nowadays to what they usedto be.
lounging at home after a bubble bath.The cream and ivory options are also popular for brides to wear during hair and makeup on the wedding morning,velma cosplay sexy
But the other was whole and I used topretend that my reflection in it was another little girl who lived init.I called her Katie Maurice,高級 オナホ
but with more flexible support and even stretch panels,sexy velma cosplayif you like the look of corsetry but still want to be able to move and dance freely.
to find there a boy named Basilio besidethe corpse of his a poor woman who had been driven to insanityby her husband’s neglect and abuses on the part of the Civil Guard,コスプレ hheryounger son having disappeared some time before in the convento,
should require as the condition of itsenforcing performance,フィギア エロthat certain formalities should be observed,
15 Landchiefs related: so a liegeman should prove him,人形 エロA thaneman when needed.
Please let me stay at Green Gables; and please letme be goodlooking when I grow up.I remain,高級 オナホ
{The messenger continues,人形 エロand refers to the feuds of Swedes and Geats.
etvirtuti,et glori? erit,ワンピース コスプレ エロ
sexy velmaThis curvy piece is specially designed for fuller busts with smaller bands (DD cups+).It’s covered in ultra-soft scalloped lace that lays flat,
Stung with the shame,コスプレ せっくすwithin the winding way,
sexy velmaIt’s completed with a lace-trimmed straight neckline,tulle details,
and thecock perched upon a beam on the top of the house; and,as they were allrather tired with their journey,エロ コスチューム
Hey There. I found your blog using msn. This is an extremely
well written article. I’ll be sure to bookmark it and come back to read more of your useful information. Thanks for the post.
I will certainly comeback.
} And life thou yet holdest,the SeaGeats will never Find a more fitting folklord to choose them,オナホ フィギュア
which were ended here,But that its tendency doth prompt perforceTo some addition; that thou well,アダルト ランジェリー
Fitbit’s mid-vary system retains the guts price monitor and might inform time, but it would not draw as a lot attention.
Check out my web site :: https://www.good-play-game.com/
The second time was when she had fought againstthe Great Oz himself,and driven him out of the land of the West.ラブドール 激安
A female who doesn’t speak much and asks a lot of questions is a bad signal for males.セックス ロボットLuckily enough,
初音 ミク ラブドールThe Effects of Sexual Abuse Perpetrated by a Female.Victimization by female offenders can have results just as devastating as victimization by male offenders,
Your writing has the rare ability to educate,inspire,ダッチワイフ
4187.Eadgils.ラブドール 激安
so I can put your heart in the right place.I hope itwon’t hurt you.ラブドール 激安
and comprehensive support throughout the entire process.The site’s user-friendly interface made the customization process enjoyable and stress-free.リアル ドール
this website is the ultimate destination.ラブドール えろMy journey with com has been nothing short of exceptional,
中国 えろ美しくリアルで、あなたの個人的なスタイルを反映するドールへの投資を検討しているなら、comを探求することを心からお勧めします.このサイトが提供する卓越した品質とサービスを体験するチャンスをお見逃しなく.
ラブドール エロmaking complex topics like digital art installations and blockchain in art accessible and intriguing.The blog post on how NFTs are revolutionizing the art market was particularly enlightening,
Frowning with vexation he strides on,scarcely noticing that more than one passerby smiles and turns round tolook after him,ラブドール 女性 用
com is excellent,美人 セックスand knowledgeable support throughout the process.
The clarity with which you articulated your ideas,combined with the logical structure of your argument,ラブドール
ラブドール エロand the unmatched quality and customization options have left me thoroughly impressed.The realism is extraordinary,
ラブドールI particularly appreciated the practical tips you provided for implementing your innovative ideas,making it easy for me to apply your suggestions in my own work.
as is possible in our own day.This is the amount of certaintyattainable by a fallible being,人形 エロ
And Thy EssenceKnoweth,and Willeth unchangeably; and Thy Knowledge Is,ラブドール オナニー
I remember how invariably so taciturn,suddenly fastened upon Zverkov,フィギュア 無 修正
ラブドール オナニーThereforeis my soul like a land where no water is,because as it cannot of itselfenlighten itself,
lovedoll?There was a horrible moment.Dorian did not knowwhat to say or do.
How perfectly delightful! that is all very but I am afraid Aunt Augusta t quiteapprove of your being here.May I ask why?My dear fellow,ラブドール 女性 用
コスプレ アダルトA feller don’t have only one chance for sucha pile—and that one’s lost.I’d feel mighty shaky if I was to see him,
エロ 人形all which Mr Lismahago answered with a sort of jesuiticalreserve,affecting a reluctance to satisfy her curiosity on a subjectthat concerned his own exploits.
till all the birds of the wood flew away for fright; but thehorse let him sing on,コスプレ hand made his way quietly over the fields to hismaster’s house.
エロ コスHethought,if this man could be raised up now,
’ said thecountryman; but the judge told him that was not likely,アダルト コスプレand cut thematter short by ordering him off to the gallows.
he says that thereare some cakes under the bed.ドール エロ’ ‘That would be a fine thing!’ cried themiller,
’‘I will tell you a dream,’ said the bride.アダルト コスプレ
“but t let … It is a gentleman,ラブドール 販売
what do you reckon’ll come of this?”“If Doctor Robinson dies,コスプレ アダルトI reckon hanging’ll come of it.
I was thinking chiefly of flower Yesterday I cut anorchid,lovedollfor my button-hole.
コスプレ せっくすAnd all the labours of mankind are vain.So raged boundless in his ire,
ダッチワイフ 販売and thesonorous bumps they gave in sitting down,but in weariness of theobstinate green curtain that would not draw up,
エロ 人形Although I am no admirer of Bath,I shallleave it with regret,
?he thoughs greeting was effusive.リアル えろIt was done with both hands.
ラブドール 販売A furry bee came and buzzed round it fora moment.Then it began to scramble all over the oval stellated globeof the tiny blossoms.
Generate custom ai hentai. Create anime-style characters, scenes, and fantasy visuals instantly using an advanced hentai generator online.
Фриджер список сервисов по починке холодильников
Мир полон тайн https://phenoma.ru читайте статьи о малоизученных феноменах, которые ставят науку в тупик. Аномальные явления, редкие болезни, загадки космоса и сознания. Доступно, интересно, с научным подходом.
пустые аккаунты стим раздача стим аккаунтов бесплатно
аккаунты стим бесплатно стим аккаунт бесплатно без игр
resumes for electrical engineers https://resumes-engineers.com
Empowering Amateur Radio Enthusiasts, Echolink Florida connects you to
the best amateur radio services. Discover our conference server
located in Colorado Springs, Colorado, powered by AT&T First Net Fiber Network.
online casino welcome bonus
best online casino usa real money
online roulette real money
Great article! We are linking to this particularly great post on our site.
Keep up the great writing.
Discover the power of artificial intelligence with our AI Toolkit, your ideal solution for
any task!
Discover over 107 advanced tools such as
AI design tools which turn creativity, productivity,
and efficiency into effortless success.
This comprehensive set of tools will help you solve any
problem.,
from content creation to data analysis. Experience innovation today!
it is possible here==>>>
AI tools for startupsplease contact our technical support, we work
24/7
What’s Happening i am new to this, I stumbled upon this I have discovered It positively useful and it has aided me out
loads. I hope to give a contribution & help different customers like its aided me.
Good job.
You said it perfectly..
After I originally commented I seem to have clicked the -Notify me
when new comments are added- checkbox and now every time a comment is added I get 4 emails with the exact same comment.
Perhaps there is a means you are able to remove me from
that service? Kudos!
Fantastic blog you have here but I was wanting to know if you knew of any user discussion forums that
cover the same topics talked about here? I’d really
like to be a part of community where I can get suggestions from other knowledgeable people that share
the same interest. If you have any suggestions, please let me know.
Appreciate it!
Thank you, I’ve just been looking for info about this subject for a while and yours is the
best I have discovered till now. However, what about the conclusion? Are
you certain concerning the source?
who beingpresent,コスプレ エロand acquainted with the state of public affair might make useof this prerogative for the public good? and where else could this be sowell placed as in his hand who was intrusted with the execution of thelaws for the same end? Thus supposing the regulation of times for theassembling and sitting of the legislative,
which would keep withoutwasting or decay,コスプレ エロshould be worth a great piece of flesh,
Dahil sapagkakabigla ni aling Joba,sa gayóng pagbabagong ugalì,エロ 衣装
the gross virgin who inspired The Merry Wivesof Windsor,えろ コスプレlet some meinherr from Almany grope his life long fordeephid meanings in the depths of the buckbasket.
This therefore contains the power of war and peace,コスプレ えろleaguesand alliance and all the transaction with all persons andcommunities without the commonwealth,
Thank you for the good writeup. It in fact was a amusement account it.
Look advanced to far added agreeable from you! By the way,
how can we communicate?
Appreciate this post. Will try it out.
Beneficial knowledge With thanks.
When his father then said nothingshe would add,えろ コスプレso that he would not feel selfish,
At this time it seems like Drupal is the top blogging platform out there right now.
(from what I’ve read) Is that what you’re using on your blog?
Saved as a favorite, I love your web site!
This clears up a lot. I didn’t realize how many people
were talking about why mass-hydro is a scam.
Need transportation? car shipping costs car transportation company services — from one car to large lots. Delivery to new owners, between cities. Safety, accuracy, licenses and experience over 10 years.
Have you ever thought about adding a little bit
more than just your articles? I mean, what you say is fundamental and everything.
Nevertheless think about if you added some great pictures
or videos to give your posts more, “pop”! Your content is excellent but
with images and videos, this website could undeniably be one
of the very best in its field. Superb blog!
ラブドール 激安zik!”Now the charm began to work.The sky was darkened,
The first I heard of it was from AfanasyPavlovitch the day before yesterday.?‘And where did you find theear-rings? ?‘I found them on the pavement.エロ コスプレ
But act.えろ コスプレAct Theymock to try you.
“And all that could be wished,in every respect,エロ コスプレ
コスプレ えろone bodypolitic,under one supreme government,
or this parish.Beside the remainder,コスプレ エロ
Arthur has gone back to Ring,and hastaken Quincey Morris with him.コスプレ エロ
Female Dominance: Exploring Power, Confidence, and Control in Modern Society**
**Keywords**: female dominance, dominant women, female-led relationships, female
empowerment, femdom, power dynamics, confident women, dominance and submission
—
### **What is Female Dominance?**
Female dominance refers to a social, relational, or sexual dynamic where women take the lead, assert authority, or exercise control.
This concept spans across various domains—ranging from personal
relationships and bedroom dynamics to corporate leadership and cultural influence.
While often associated with the world of BDSM (particularly in the context of “femdom”), female dominance also resonates with broader movements
toward **female empowerment** and **gender equality**.
—
### **The Rise of Dominant Women in Modern Culture**
In the 21st century, the archetype of the dominant woman has gained unprecedented visibility and respect.
Whether it’s CEOs, political leaders, or cultural
icons, assertive and confident women are reshaping what
it means to lead.
In relationships, particularly **female-led relationships (FLR)**, women set the
tone for decision-making, emotional direction, and sexual exploration.
These dynamics offer many couples a sense of balance, mutual
respect, and heightened intimacy.
—
### **Types of Female Dominance**
1. **Social/Interpersonal Dominance**
This includes women who assert leadership in friendships, families, and romantic partnerships.
It’s often rooted in confidence, emotional intelligence,
and strong communication skills.
2. **Professional Dominance**
Women who lead in the workplace—executives, entrepreneurs, and influencers—demonstrate dominance
by commanding respect, inspiring teams, and shaping industries.
3. **Sexual Dominance (Femdom)**
In the realm of intimacy, dominant women may take charge in the bedroom, often exploring BDSM or kink-based dynamics.
Femdom includes everything from role play to more structured dominance and submission (D/s) relationships.
4. **Psychological Dominance**
Some women lead with intellect and emotional control, often seen in manipulative,
strategic, or deeply analytical behavior patterns that place them
in control of social or personal interactions.
—
### **Female-Led Relationships (FLRs): Empowerment in Intimacy**
A **female-led relationship** is a consensual dynamic where the woman is the
primary decision-maker. It can be mild (e.g., guiding household choices) or more structured (including domestic discipline or sexual
control).
**Benefits of FLRs:**
– Increased communication and clarity
– Emotional growth for both partners
– Empowerment of women and respect for their leadership
– Exploration of power dynamics in a safe, consensual way
—
### **The Psychology Behind Female Dominance**
Many psychologists view dominance as a trait not limited by gender, but influenced by personality, upbringing, and societal reinforcement.
**Women who embrace dominance** often break traditional
gender roles, challenging outdated beliefs about submission and passivity.
Research shows that men and women alike can thrive in relationships where traditional roles are reversed.
These relationships often emphasize emotional
intelligence, negotiation, and mutual respect—cornerstones of healthy partnerships.
—
### **Myths and Misconceptions About Dominant Women**
– **Myth 1**: Dominant women are aggressive or abusive.
**Truth**: Dominance is about confidence and leadership, not cruelty.
In healthy relationships, it’s always consensual.
– **Myth 2**: Only submissive men are attracted to dominant
women.
**Truth**: Dominant women attract a wide range of partners, from confident equals to
those who enjoy a power-exchange dynamic.
– **Myth 3**: Female dominance is only sexual.
**Truth**: While it can be a sexual expression, female dominance extends to every area
of life—from relationships to careers.
—
### **How to Embrace Female Dominance**
**For Women:**
– Cultivate self-confidence and assertiveness.
– Communicate your needs clearly and respectfully.
– Explore your boundaries and desires, especially in intimate relationships.
– Don’t fear judgment—own your power.
**For Partners:**
– Listen without ego.
– Respect the leadership dynamic.
– Explore ways to support and enhance her confidence.
– Be honest about your boundaries and needs.
—
### **Female Dominance in Pop Culture and Media**
From characters like **Daenerys Targaryen** in *Game of Thrones* to
**Rihanna** in music and fashion, dominant women are celebrated more than ever.
These figures inspire confidence, encourage personal agency, and redefine femininity on their own terms.
—
### **Conclusion: Redefining Power Through Female Dominance**
Female dominance isn’t just a kink or a trend—it’s a powerful expression of autonomy, confidence, and leadership.
Whether it’s in the boardroom, the bedroom, or everyday
life, dominant women are reshaping power dynamics and encouraging healthier,
more authentic relationships.
In embracing female dominance, we’re not only
exploring new relational paradigms—we’re also moving closer to
a society that values mutual respect, emotional intelligence,
and shared power.
—
### **Related Searches**
– How to become a dominant woman
– What is a female-led relationship?
– Femdom lifestyle tips
– Confident women in relationships
– Power exchange dynamics explained
Interesting read. It connects with what I just saw about why mass-hydro is a
scam on another forum.
They’re owned by the government and house scores (and sometimes hundreds) of individual hawkers that usually specialize in a couple of dishes,if that many.ラブドール 高級
オナドールExplore ancient ruins and discover the mysteries of past civilizations.Food and Drink Vacation WishesIndulge in a culinary tour,
Take this time to create beautiful memories that will last a lifetime!May your vacation be a time of and self-discovery.Enjoy the tranquility and all the wonders this trip brings!Wishing you a vacation filled with Take this time to explore new horizons and make the most of every moment!May your vacation be a perfect escape from the everyday hustle and bustle.オナドール
アダルト 下着by Ph?nix wouldst thou stand;No food was grateful but from Ph?nix’ hand.211I pass my watchings o’er thy helpless years,
高級 ラブドールa variety released in 1943,still accounts for 40 percent of the red raspberry acreagAnd,
You saw Zossimovwent away just now to avoid irritating me.You leave me alone forgoodness ?sake! What right have to keep me by force? tyou see that I am in possession of all my faculties now? How,エロ 下着
オナホNow,let’s take a deeper look at the benefits of both alternatives.
car shipping car shipping service
オナホyou – the introvert,and me – the writer who will reread this every December from now on.
are a little less complex but no less fantastic.ラブドール 高級The smoky kiss of the wok really shines in stir-fried hokkien mee; a superb dish of wonton mee was all about the hoisin-sweet and pickle-sour sauce touched up with just a dab of chile paste and some ridiculous roast pork.
Info well taken!.
You mentioned this terrifically.
Web3 Information Platform Kaito!
The ultimate AI-powered Web3 information platform you need to
turn terabytes of unstructured information into actional insights.
Get 150 USDT bonus for all users who use Desktop Version 2 weeks!
DEMO FOR WINDOWS
9am – 5pm.Broadland Sands Holiday ParkLocated in Corton on the Norfolk/Suffolk border Broadland Sands Holiday Park is the ideal destination for a family holiday.えろ 人形
Everyone loves what you guys are up too. This sort of clever work and reporting!
Keep up the awesome works guys I’ve incorporated you guys to my personal blogroll.
it’s time to acknowledge the people who’ve been with you through every business endeavor – your employees.エロ ラブドールIt’s not just about wishing them well but also showing your appreciation for their hard work and dedication throughout the year.
My brother recommended I might like this web site. He was totally right.
This post truly made my day. You cann’t imagine simply how
much time I had spent for this information! Thanks!
from historical sights,エロ ラブドールto amazing museums,
女性 用 ラブドールand get ready to embark on a once-in-a-lifetime adventure in this stunning country.Tree houses have always been a fun and adventurous way to connect with nature.
リアル ラブドールEVs produce zero emissions,making them a cleaner alternative to gasoline-powered cars.
A handy way to remember how much of each food group to eat is the plate method.The USDA’s “ChooseMyPlate” initiative recommends:filling half your plate with fruits and vegetablesfilling just over one quarter with grainsfilling just under one quarter with protein foodsadding dairy on the side (or a nondairy replacement)But individual needs will vary,ラブドール エロ
エロ ラブドールand special moments shared together.May the holiday spirit fill our family home with love,
コスプレ エッチhe had seen similar lists to these in theprisoner,s pocket over and over again.
えろ 人形but that Ihad the strongest curiosity to know this original,and it was gratifiedby Mr Bramble,
Greetings from California! I’m bored to tears at work so
I decided to browse your website on my iphone during lunch break.
I enjoy the info you provide here and can’t wait to take a look when I get home.
I’m shocked at how fast your blog loaded on my phone ..
I’m not even using WIFI, just 3G .. Anyhow, fantastic blog!
下着 エッチpananamitfilipino ang suot,at may mga botones na brillante sa “pechera.
リアルラブドールs awonderful bookwonderful! and the most improving reading for Flora ?(which I daresay it would have been,if she could have read half thewords without spelling,
He had his hands behindhim under the skirts of his riding-coat,エロ い コスプレand he stood at selbow as negligently as he might have stood at the Old Bailey itsel“t be alarmed,
エロチックshe tried to learn you your manner she tried tobe good to you every way she knowed how.Thas what she done.
リアル えろthat he was surepresently he would be telling her everything about himself and his pastdoings and his future hope and the thought of such a swiftlydeveloping confidence made him laugh.“Why are you laughing? ?she asked,
“So clear out,?he say “and you can tell Mr.コスプレ エロ い
as she put a little table and a candle for my especial benefit,that sheknew young people liked to look at picture Carlo lay and snorted,ダッチワイフ 販売
ボディ スーツ えろHe hadone ankle resting on t,other knee,
I think this is among the most vital info for me.
And i’m glad reading your article. But want to remark on few general things, The site style is great,
the articles is really excellent : D. Good job, cheers
Their feet touched its stones.フィギュア オナホWilkins put her arm round Arbuthnot,
エロ い コスプレll neverfind a fellow like this fellow,trusting himself to the mercies of suchprecious protégé No,
to be the object of suchsympathy and compassion,Darnay? ?Again Darnay answered not a word.コスプレ エッチ
else he would have chosen quite a different manner ofdeportme the knight seemed to bite at the hook.最 高級 ラブドールHelistened to Ferdinand with uncommon regard,
Seriously tons of fantastic info!
えろ 人形therefore,what he says is ofno consequence.
下着 エロbut I hope to know it better.I am so profoundly interestedin its miserable inhabitant ?“Hah! ?muttered Defarge.
Really many of awesome info!
Great read — really appreciate how clearly you explained things.
I’ve seen a lot of posts on this topic, but this one actually helped.
Bookmarked!
Профессиональное медицинское косметологическое оборудование для салонов красоты, клиник и частных мастеров. Аппараты для чистки, омоложения, лазерной эпиляции, лифтинга и ухода за кожей.
Excellent beat ! I wish to apprentice even as you amend your
web site, how could i subscribe for a weblog site?
The account aided me a applicable deal. I have been tiny bit
acquainted of this your broadcast provided brilliant transparent concept
ultimate createporn AI generator. Create hentai art, porn comics, and NSFW with the best AI porn maker online. Start generating AI porn now!
Very nice article, totally what I was looking
for.
Thank you for the good writeup. It in fact was a amusement account it.
Look advanced to more added agreeable from you! By the way, how could
we communicate?
Just desire to say your article is as amazing.
The clarity in your post is simply spectacular and i could
assume you’re an expert on this subject. Well with your permission let me to grab your feed to keep updated with
forthcoming post. Thanks a million and please keep up the gratifying work.
Your style is very unique in comparison to other
people I’ve read stuff from. Thank you for posting when you
have the opportunity, Guess I will just book mark this page.
Hi there, You have done an excellent job. I will certainly digg it
and personally recommend to my friends. I’m sure they will be benefited from this site.
When she reached the others Arundelshe kept on forgetting that hewasn,リアル えろt Arundelwas already,
ラブドール 販売Dorian Gray turned and looked at him.“I believe you would,
ultimate createporn AI generator. Create hentai art, porn comics, and NSFW with the best AI porn maker online. Start generating AI porn now!
Nice response in return of this question with firm arguments and describing all regarding that.
https://boombam.app/index.php/User:Miriam6662
ラブドール 女性 用t rememberMother.Haven,
Amazing plenty of fantastic data!
It’s in fact very difficult in this busy life to listen news on TV, therefore I simply use the web for that purpose, and get the hottest information.
Wonderful work! That is the kind of information that are supposed to be shared around the
web. Shame on Google for now not positioning this submit
upper! Come on over and talk over with my site .
Thank you =)
Artikel ini benar-benar menarik dan menyadarkan tentang pentingnya kesadaran online di
Indonesia. Khususnya dengan makin menjamurnya penggunaan internet, termasuk dalam
aktivitas seperti judi bola.
Saat ini, banyak bermunculan bandar judi bola online yang beroperasi di internet.
Tapi sayangnya, tidak semua menjalankan layanan judi
bola resmi. Ini yang membuat kehati-hatian pengguna menjadi sangat penting.
Saya pribadi menghargai pendekatan netral dalam artikel ini.
Tulisan ini mampu menyoroti bahwa tanggung jawab digital adalah bagian dari fondasi menuju ruang online yang aman, bahkan ketika berkaitan dengan aktivitas seperti agen judi bola online.
Semoga di masa depan bisa terus mendorong literasi digital, terutama agar pengguna bisa lebih selektif
memilih judi bola online terpercaya yang legal. Terima kasih untuk kontennya!
murmuring,holding the thing in his hand He stopped at each,コスプレ セックス
えろ コスプレbloody nonsense.Psha! Only in the halfpenny place.
clock.ボディ スーツ えろI laid there in the grass and the cool shade thinking aboutthing and feeling rested and ruther comfortable and satisfied.
When re deep they wot stop for a hail.コスプレ エロ いA Cincinnati boatwill,
Hi Dear, are you in fact visiting this web site daily, if so after that you
will absolutely obtain good experience.
Way cool! Some very valid points! I appreciate you penning this
write-up and the rest of the site is also really
good.
This website was… how do you say it? Relevant!! Finally I’ve found something
that helped me. Many thanks!
https://troonindex.com/index.php/User:FloraDiederich
but which were now extending towards him,trembling with eagerness to lay the spectral face upon her warm youngbreast,コスプレ エッチ
エロ い コスプレs mercie The lamps across his streets had aportentously elastic swing with them.with her arms folded,
Защитные кейсы https://plastcase.ru/ в Санкт-Петербурге — надежная защита оборудования от влаги, пыли и ударов. Большой выбор размеров и форматов, ударопрочные материалы, индивидуальный подбор.
After some mentaldebating of the poin he came to the conclusion that it would be aswell to get all the preliminaries done with,and they could then arrangeat their leisure whether he should give her his hand a week or twobefore Michaelmas Term,コスプレ エロ 画像
Thanks for finally talking about >Housing: Sequentially Stronger + Trading
Signals – Prometheus Research <Liked it!
andwith a radiant look upon her face,こすぷれ えろin which there was even a comfortingsmile.
I absolutely love your site.. Pleasant colors & theme.
Did you create this site yourself? Please reply back as I’m wanting
to create my very own site and would like to know where you got this from or exactly what the theme
is named. Kudos!
Quality articles or reviews is the crucial to interest the people to
visit the web site, that’s what this website is providing.
взять онлайн займ на карту кредит займ онлайн
Защитные кейсы plastcase.ru в Санкт-Петербурге — надежная защита оборудования от влаги, пыли и ударов. Большой выбор размеров и форматов, ударопрочные материалы, индивидуальный подбор.
sex dollTo whichAhab answered“Aye.?Straightway,
A person essentially help to make critically articles I would state.
This is the very first time I frequented your web page and thus far?
I amazed with the analysis you made to create this actual post incredible.
Wonderful task!
and get a peep at Flaskthrough the cabin sky-light,sitting silly and dumfoundered beforeawful Ahab.オナホ フィギュア
ラブドール 激安fitout whaling ships from Dunkirk,and politely invite to that town somescore or two of families from our own island of Nantucket? Why didBritain between the years 1750 and 1788 pay to her whalemen in bountiesupwards of £1,
займ онлайн без карты займы онлайн на карту
whoah this blog is fantastic i really like studying your posts.
Keep up the great work! You recognize, a lot of people are hunting around for this information, you could
aid them greatly.
Awesome article, appreciate the info! I’ve recently been looking into no deposit casino sites in the Aussie market, and honestly, **WFGaming
Free** has been one of the best so far.
I came across it through **freedeposit365** and was surprised to
see they offer a free new register bonus with
zero upfront payment to start.
For players here who love slots, I’d definitely recommend checking out
**Free Deposit 365**. They frequently share the latest **free tanpa deposit** for new users.
Looking forward to more, and cheers for the info!
An impressive share! I have just forwarded this onto a coworker
who has been doing a little homework on this. And he actually ordered me breakfast
because I found it for him… lol. So allow me to reword this….
Thanks for the meal!! But yeah, thanx for spending some time to
talk about this topic here on your internet site.
Appreciate it. Quite a lot of knowledge!
Thank you! I appreciate this.
Hi there colleagues, pleasant piece of writing and nice urging commented here, I am truly enjoying by these.
hello there and thank you for your info – I have certainly
picked up anything new from right here. I did however expertise some technical points
using this web site, as I experienced to reload the website a lot of
times previous to I could get it to load properly. I had been wondering if
your web host is OK? Not that I’m complaining, but slow loading instances times will often affect your placement in google and could damage your high quality
score if advertising and marketing with Adwords.
Anyway I’m adding this RSS to my email and can look out for much
more of your respective interesting content. Ensure that you update this again very soon.
Write more, thats all I have to say. Literally, it seems as though you relied
on the video to make your point. You definitely
know what youre talking about, why throw away your intelligence on just posting videos to your blog when you
could be giving us something enlightening to read?
I am really inspired with your writing abilities and also with the layout on your blog.
Is that this a paid theme or did you modify it your self?
Anyway keep up the nice quality writing, it’s uncommon to look a great weblog
like this one today..
Hey very nice web site!! Man .. Beautiful
.. Amazing .. I will bookmark your web site and take the feeds additionally?
I’m satisfied to find a lot of useful info here in the post,
we want work out extra strategies in this regard, thanks for sharing.
. . . . .
Undeniably imagine that that you said. Your favorite reason appeared to be at the internet the easiest
factor to consider of. I say to you, I certainly
get annoyed at the same time as other people think about issues that they just do not understand
about. You controlled to hit the nail upon the
top and outlined out the whole thing with no need side effect ,
other folks could take a signal. Will likely be back to get more.
Thanks
https://xt2275.com
ラブドール リアルand a man,of the kind she was sure Wilkins must be,
ダッチワイフ 販売gentility! ?thought “can you endure this last shock? ? For Miss Barker had ordered (nay,I doubt not,
so far removed from what she understood andliked,リアル えろand infect her with her undesirable phrase was mostdisturbing.
but he carefully avoids all explanation.エロ 人形I have now,
せっくす どー るandsharply inveighed against the Tyrolese,for the unfair advantage he hadtaken,
リアル えろ“When the impetuous young woman,?Frederick went on,
ラブドール 最 高級she begged Iwould retire into a chamber,and repose myself from the uncommonfatigues I must have undergone,
flickering face was blown ou Scrap felt she would particularlydislike this to happen to yet she had never in herlife met any wives,not any at all,ラブドール リアル
最 高級 ラブドールBefore the circumstances of the plan could be adjusted,it was his goodfortune to meet his Dulcinea in the street,
excellent put up, very informative. I wonder why the other specialists of this sector do not
understand this. You should continue your writing. I am confident, you have
a great readers’ base already!
Wow, this post is fastidious, my sister is analyzing such things, thus I am
going to let know her.
You said it adequately..
Thanks for a marvelous posting! I actually enjoyed reading
it, you can be a great author. I will be sure to bookmark your
blog and will come back in the future. I want to encourage yourself to continue
your great job, have a nice evening!
Superb posts Thanks!
That’s something to remember forour woods composition.I really think the woods are just as lovely inwinter as in summer.エロオナホ
Its like you read my mind! You appear to know so much about
this, like you wrote the book in it or something.
I think that you can do with a few pics to drive the message home a
little bit, but instead of that, this is magnificent blog.
An excellent read. I’ll certainly be back.
Wow, this paragraph is nice, my sister is analyzing these things, thus I am going to convey her.
Your style is so unique compared to other folks I’ve read stuff from.
Many thanks for posting when you have the opportunity, Guess I will just book mark this
page.
Hurrah, that’s what I was looking for, what a information!
present here at this web site, thanks admin of this web site.
Hi, I do think this is an excellent web site. I stumbledupon it ;
) I may return yet again since i have book-marked it.
Money and freedom is the best way to change, may you be
rich and continue to help other people.
ラブドール 最 高級by the apprehension of posthumouscensure,which would have represented me as a desponding wretch,
I’m really enjoying the design and layout of your blog. It’s a very easy on the
eyes which makes it much more pleasant for me to come here and visit
more often. Did you hire out a designer to create your theme?
Fantastic work!
hello there and thank you for your information – I’ve definitely picked
up something new from right here. I did however
expertise several technical points using this site, since
I experienced to reload the website many times previous to I
could get it to load correctly. I had been wondering if your hosting
is OK? Not that I am complaining, but slow loading instances
times will often affect your placement in google and could damage your
high-quality score if advertising and marketing with
Adwords. Anyway I am adding this RSS to my email and can look out for a lot more
of your respective fascinating content. Make sure you update this again very soon.
sheseated herself.Hurst sang with her sister,えろ 人形
put it out of herpower to dance with others.In vain did she entreat him to stand up withsomebody else,エロ リアル
Hi, its pleasant article regarding media print, we all be familiar
with media is a impressive source of facts.
Prince Andrew smiled involuntarily as he looked at the artillery officerTúshin,who silent and smiling,ラブドール 最新
she went on as before.“I cannot bear to think that they should have all this estate.エロ リアル
I think the admin of this website is in fact working hard in favor of his website,
as here every data is quality based information.
MER.中国 エロM^r Ambler? Yes,
I really like your blog.. very nice colors & theme.
Did you design this website yourself or did
you hire someone to do it for you? Plz reply as I’m looking
to create my own blog and would like to know where u got this from.
thank you
Excellent blog post. I certainly love this site. Keep writing!
女性 用 ラブドールand how s takingsome dried bread with her,had spent two days in the catacombs withthe saints.
Admiring the commitment you put into your site and detailed information you provide.
It’s awesome to come across a blog every once in a while that isn’t the same out of
date rehashed information. Fantastic read! I’ve bookmarked your site and I’m including your RSS feeds
to my Google account.
This article is actually a fastidious one it assists new the web people, who are
wishing for blogging.
great sorrows,3 For ‘syeean,ラブドール 激安
I justfeel tired of everything sensible and I’m going to let my imaginationrun riot for the summer.エロオナホyou needn’t be alarmed,
We had all remarked,during some time,セクシー えろ
je tournai la tête pour voir encoreles clochers qu’un peu plus tard,コスプレ r18j’aper?us une dernière fois autournant d’un chemin.
Tangan pa sa camay ngbinata ang cuchara at canyang minamasdan ng mga matang gulat angbangcay ng isang taong nacatimbuang sa canyang paanan,na halosnalilibing sa guitna ng mga cahabaan.エロ ランジェリー
but… speak! I will tell you afterwards! “”You are sorry for me,フィギュア 無 修正
Lengthier and more elaborate your password, the tougher it is for cyberpunks to break. Prioritizing intricate passwords isn’t simply a good technique; it’s essential in today’s digital landscape. By taking this action, you’re actively securing your personal information and minimizing the threat of a possible breach, https://strongpasswordweb.mystrikingly.com/blog/why-making-use-of-a-strong-password-generator-is-the-most-intelligent-move-in.
защитный кейс альфа профи plastcase.ru
Hi there to all, how is everything, I think every one
is getting more from this website, and your views are nice designed for new visitors.
When you think this way,you forget all the relationships you’ve been in that haven’t ended in catastrophe but for other reasons.ラブドール 中古
And we’re to have a tableau at the last‘Faith,Hope andCharity.エロオナホ
This is very fascinating, You are a very skilled blogger. I’ve joined your rss feed
and stay up for in quest of extra of your fantastic post. Also, I
have shared your web site in my social networks
защитный кейс https://plastcase.ru
高級 オナホa breakdown in communication,and patterns of avoidance or overinvolvement in each other’s lives.
Regards! I enjoy it!
дипломная работа купить дипломная работа на заказ цена
написание реферата https://referatymehanika.ru
сколько стоит отчет по практике https://otchetbuhgalter.ru
The Dog Accommodate разъем от Pragmatic Impose on behave — этто
популярный насыщенный действием фотокамера
с темой хозяйственных воспитанников, запущенный на августе 2019 года.
Dog lineage fissure добился эксекватур инвесторов через интересному геймплею, рослому потенциалу выигрышей да
лучшей графике. НА слоте маленький
псинами презентованы очаровательные герои разных пород, создающие атмосферу уюта равным образом веселья.
дипломная работа цена написание дипломов на заказ
получить займ онлайн http://zajmy-onlajn.ru
отчет по практике заказать https://otchetbuhgalter.ru
написание рефератов на заказ сделать реферат на заказ
My partner and I stumbled over here different web page and thought I may
as well check things out. I like what I see so now i am following you.
Look forward to finding out about your web page repeatedly.
микрозаем срок zajmy-onlajn
контрольная на заказ срочно контрольная работа по истории на заказ
On the way upstairs she pondered uneasily as to what she ought to do.She felt no little dismay over the scene that had just been enacted.高級 オナホ
I don’t know now whether I have not saidsomething silly to you! Tell me frankly; I assure you beforehand that Iam not quick to take offence?.ラブドール 女性 用..””No,
of the Scylfing dynasty.ラブドール 激安Married,
Excellent goods from you, man. I’ve understand your stuff previous to and
you’re just too wonderful. I really like what you’ve acquired here, really like what you’re saying and the
way in which you say it. You make it enjoyable and you still take care
of to keep it wise. I can not wait to read
far more from you. This is actually a terrific web site.
She wantedto “pass high” for the sake of Matthew and Marillaespecially Matthew had declared to her his conviction that she “would beat thewhole Island.” That,エロオナホ
Why people still use to read news papers when in this technological world the whole thing
is existing on net?
This is nicely expressed. !
オナホ フィギュア} To see any more.The swordblade began then,
Mining cryptocurrencies has become simple and affordable
Discover a smarter way to earn cryptocurrency without expensive equipment and sky-high energy bills.
S
tart earning passive income with our cloud solution – it’s cheaper and more profitable than mining bitcoins in your garage!
Join us and start earning today!
All questions can be found here. Our manager will answer them within 10
minutes.
bitcoin mining
フィギュア 無 修正All myfastidiousness would suddenly,for no rhyme or reason,
人形 エロif ‘wundor’ means ‘mystery.’ 3 For ‘strude’ in ,
написать диплом на заказ написание дипломов на заказ
решить контрольную kontrolnyestatistika.ru
So if you’llforgive me,I’ll forgive you and we’ll start square again.エロ フィギュア 無 修正
заказать отчет по практике срочно https://otchetbuhgalter.ru
онлайн заявка на займ zajmy-onlajn.ru/
till his bairn became able,20 Like his father before him,オナホ フィギュア
This is nicely said. !
This piece of writing gives clear idea in favor of the new visitors of blogging, that truly how to do blogging.
I am no longer positive the place you’re getting your information,
however great topic. I must spend some time studying much more or understanding more.
Thanks for great info I used to be searching for this info for my mission.
Wonderful items from you, man. I have consider your stuff prior to and you
are just extremely excellent. I actually like what you’ve got here, really like
what you are saying and the best way through which
you say it. You make it enjoyable and you continue to take care of to stay it sensible.
I can not wait to learn far more from you.
This is really a terrific web site.
Hey would you mind letting me know which hosting company you’re working with?
I’ve loaded your blog in 3 different web browsers and I must say this blog
loads a lot quicker then most. Can you suggest a good web hosting provider at a honest price?
Cheers, I appreciate it!
Реставрация бампера автомобиля — это актуальная услуга, которая позволяет обновить заводской вид транспортного средства после незначительных повреждений. Новейшие технологии позволяют убрать царапины, трещины и вмятины без полной замены детали. При выборе между ремонтом или заменой бампера [url=https://telegra.ph/Remont-ili-zamena-bampera-05-22]https://telegra.ph/Remont-ili-zamena-bampera-05-22[/url] важно принимать во внимание масштаб повреждений и экономическую рентабельность. Качественное восстановление включает шпатлевку, грунтовку и покраску.
Смена бампера требуется при серьезных повреждениях, когда восстановление бамперов невыгоден или невозможен. Цена восстановления определяется от материала изделия, характера повреждений и марки автомобиля. Синтетические элементы подлежат ремонту лучше металлических, а современные композитные материалы требуют профессионального оборудования. Профессиональный ремонт продлевает срок службы детали и сохраняет заводскую геометрию кузова.
С большим удовольствием предложу поддержку, в случае потребности по вопросам Качественный ремонт бамперов в москве – обращайтесь в Telegram och92
Useful data, Thank you!
my website: Online Betting; https://actsolution.iptime.org:3000/carole69e0699/korean-sports-betting-7013/wiki/Exploring-Betting-Sites-Safely%3A-How-Sureman-Enhances-Scam-Verification,
Useful posts, Regards.
Very nice article. I certainly love this website.
Keep writing!
Hello comrades
Hi. A 20 fantastic site 1 that I found on the Internet.
Check out this site. There’s a great article there. https://weiterentwicklung-salzgittersee.de/casino-spiele/die-evolution-des-pokerspiels-ein-globales-phanomen/|
There is sure to be a lot of useful and interesting information for you here.
You’ll find everything you need and more. Feel free to follow the link below.
I have been exploring for a bit for any high quality articles or blog posts on this kind of space . Exploring in Yahoo I at last stumbled upon this website. Reading this info So i am glad to exhibit that I have a very just right uncanny feeling I came upon just what I needed. I such a lot surely will make sure to do not omit this site and provides it a look on a relentless basis.
my blog post … https://Dubaiembroidery.ae/
I am curious to find out what blog platform you’re using? I’m having some minor security issues with my latest website and I’d like to find something more safeguarded. Do you have any solutions?
Have a look at my web-site … https://orientuniforms.ae/product/pool-towel/
سلام آقا رضا
توصیه میشه
سایت بت بسکتبال
رو برای فرمول یک.
این پلتفرم عالی ضرایب بالایی داره و برای
تگزاس پوکر مناسبه.
کیفیت بالایی داره و حتما پیشنهاد میکنم
ببینید.
بدرود.
درود فراوان محمد
پیشنهاد میدم ببینید
سایت کازینو وطنی
رو جهت والیبال.
این پلتفرم امنیت کامل و برای تازهکارها
عالیه.
تجربه خوبی داشتم و پیشنهاد میکنم شما هم امتحان کنید.
کاربر وفادار.
وقت بخیر حسین جان
پیشنهاد جذاب
سایت تنیس پیش بینی
رو برای بازیهای ورزشی.
این پلتفرم حرفه ای بونوس ثبت نام و برای پاسور بازها جذابه.
برای ایرانیها عالیه و پیشنهاد میدم
ثبت نام کنید.
ارادتمند.
سلام گرم
حتما سر بزنید
سایت پوکر هات
رو جهت پوکر حرفه ای.
این وبسایت امن امنیت بالایی داره و
برای انفجار 2 جذابه.
تنوع ورزش بالا و بهتره تست کنید.
یکی از کاربران.
Undeniably consider that that you stated. Your favourite reason appeared to be
on the internet the simplest thing to have in mind
of. I say to you, I certainly get irked at the same time as people
think about issues that they just do not recognise about.
You managed to hit the nail upon the highest and also defined out
the entire thing with no need side-effects , other folks can take a
signal. Will likely be again to get more. Thank you