
Last week we saw significant moves in markets. Equities and treasuries were down significantly, while commodities and the dollar rallied. These moves reflect the fundamental dynamics of heightened inflation, weakening growth, tightening liquidity, and market regime pricing for stagflationary nominal growth. These market moves came from weaker than expected employment data and higher-than-expected inflation in the form of CPI. We examine the drivers of asset returns individually:
i. Growth remains under pressure. Economic cause-and-effect tell us that there is an increasing likelihood that growth will continue to weaken. Our focus is currently on the US consumer and how they will drive this economic cycle. Consumers spend (thereby creating income) in three ways: they can spend current income, borrow from future incomes, or dig into previously saved income. Current incomes are primarily a function of the number of hours worked, the prevailing rate of wages, and the employment in the labor force. We combine these estimates to get a sense of income-powering spending. We combine these measures with our systematic recognition of periods where labor markets are both tight, and inflation is elevated, i.e., inflationary tight labor markets. We show this below :

When labor markets are tight, employment becomes less of a source of incremental income, as there is less room to reduce unemployment. Furthermore, when inflation is elevated, real wages come under pressure, i.e., consumers have less spending power. Our year-over-year estimates show income declines of -3.1% during inflationary & tight labor markets, and real personal spending typically indicates a -1.8% decline annually. We are experiencing an inflationary, tight labor market, and we expect real incomes and spending to recede.
Household cash balances are elevated relative to the last five years. It is often argued that these are the buffer that will continue to support spending in the real economy. While some degree of this is likely, the magnitude of savings drawdown is unlikely to be adequate to offset income losses. Below, we show our estimates for the potential for savings to households to prop up personal spending, i.e., if households choose to reduce their cash balances, how much it would impact spending growth alone. We make room for a fast and slow scenario. In the slow scenario, households reduce their savings in line with historical rates. In the fast scenario, they reverse the uptick in cash balances since COVID-19 over 18 months. We show these below:
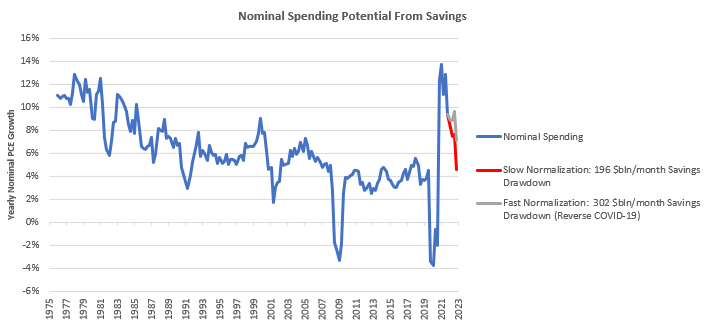
Even at a pace of $302 billion in cash balance drawdown, accumulated savings cannot keep up with the current rate of nominal spending growth. Now that we have covered current and previously saved incomes, we can look at the consumers’ ability to borrow from future income, i.e., credit. We show below how consumer credit growth is not large enough in value to contribute meaningfully to incomes. Furthermore, while credit is an essential feature of the US economy, credit occupying a large share of spending is typically a lagging indicator as it usually occurs during periods where income has contracted considerably. Keep in mind this takes into account only installment credit & not mortgages:
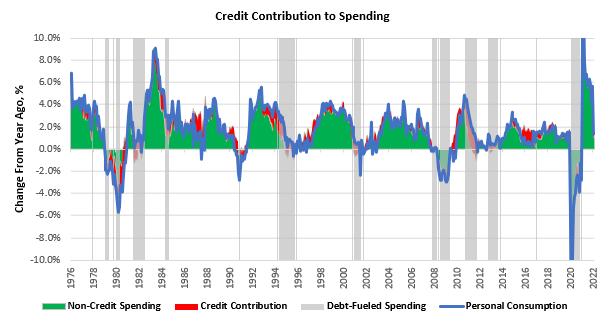
At best, credit could add approximately 0.3% to spending at its current levels. With net worths being impacted by declining asset prices and rising borrowing costs, we find even this to be an optimistic estimate.
ii. Inflation remains resilient and has spread to areas where price increases tend to be sticky. CPI came in higher than expected, rising at a torrid 1% in May alone, benefitting our systematic exposures greatly. Energy, transportation, home prices, rents, and food prices were the most significant contributors to these moves. We show the top six categories over time below:
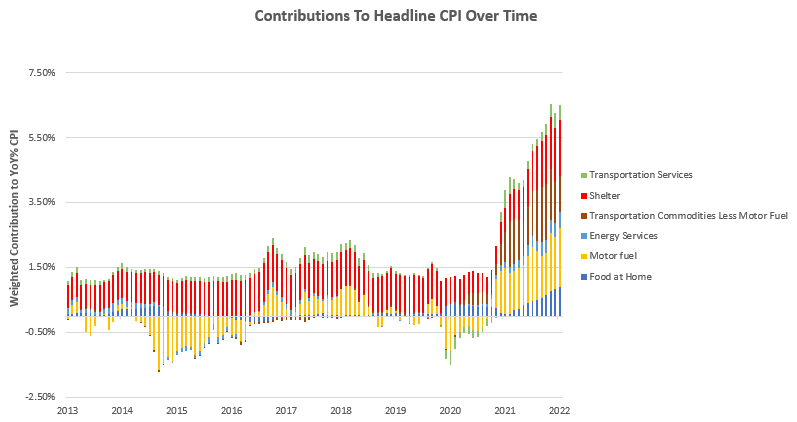
To showcase the contributions to the trends underlying current inflation, we show the contributions to the yearly changes in CPI:
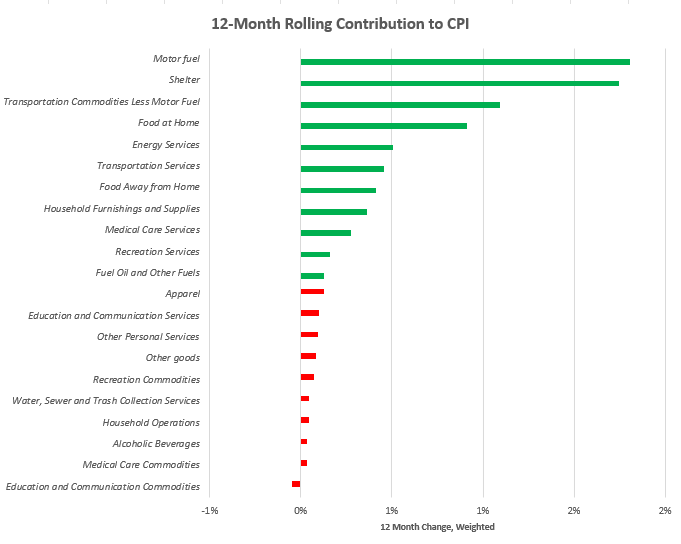
For more specificity, we show the top 10 items that contributed to the current monthly change:
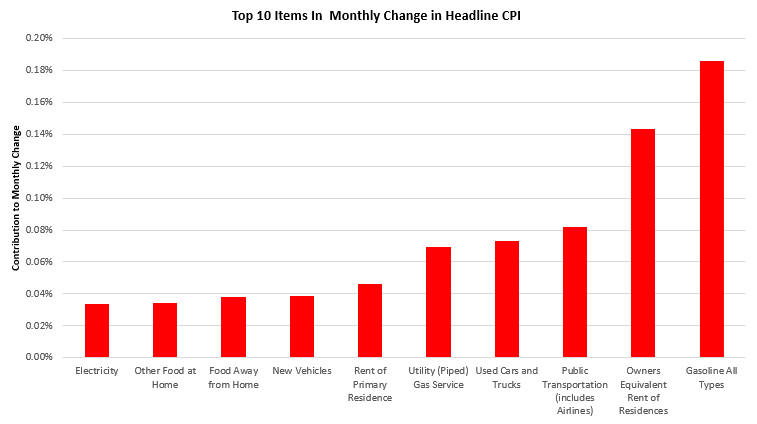
The primary concern we do not feel is adequately appreciated in markets today is that inflationary pressures have spread to items where inflationary tendencies do not revert quickly, i.e., food and housing. With sustained rental inflation, we could see a much higher mean CPI than markets are discounting, which would mean there is significant room for the current downtrend in stocks and treasuries. Our systems tell us to position accordingly, and we continue to short equities and stay long commodities and other inflation beneficiaries.
iii. Liquidity has begun to contract quickly and will continue to do so.The majority of the decline in liquidity year-to-date has come due to the pullback in fiscal largess. This month, we will see the initial impacts of the Fed’s balance sheet reduction. We show our forecasts below:
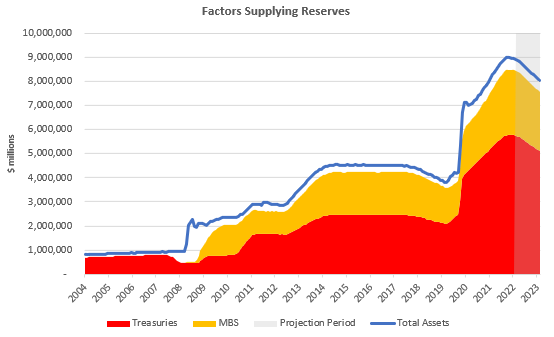
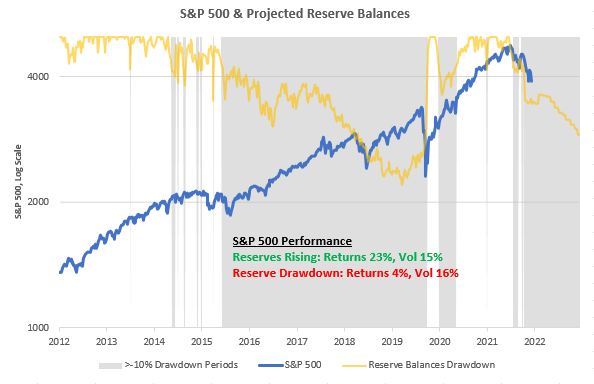
These asset decreases will decrease the reserve balances available to the financial system, decreasing liquidity and increasing volatility. We have long expected the tightening of liquidity conditions to be volatility-inducing and to drag on assets. The reduction of reserve balances (i.e., drawdown) has been true to form in this regard.
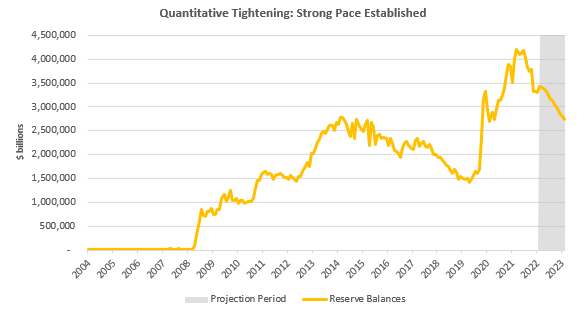
We show our projections of reserve balances below as well:
The Week Ahead
Taking all the information above into context, our systems continue to expect an environment of stagflationary nominal growth and weak liquidity. Historically, this has been a poor time for stocks & bonds, and current market trends continue to validate this assessment. In terms of economic data, we will receive a slew of incremental information next week. Furthermore, we will likely receive an additional 50 basis point rate hike on Wednesday at the FOMC meeting. Here are the upcoming data relevant to our systematic process:
-
Monday: NA
-
Tuesday: NFIB Small Business Surveys, PPI
-
Wednesday: FOMC, MBA Mortgage Applications, Empire Manufacturing, Retail Sales, NAHB Housing Index, Trade Prices
-
Thursday: Building Permits, Housing Starts, Philly Fed Business Outlook Survey, Jobless Claims
-
Friday: Industrial Production, Capacity Utilization, Mfg Production, Leading Index
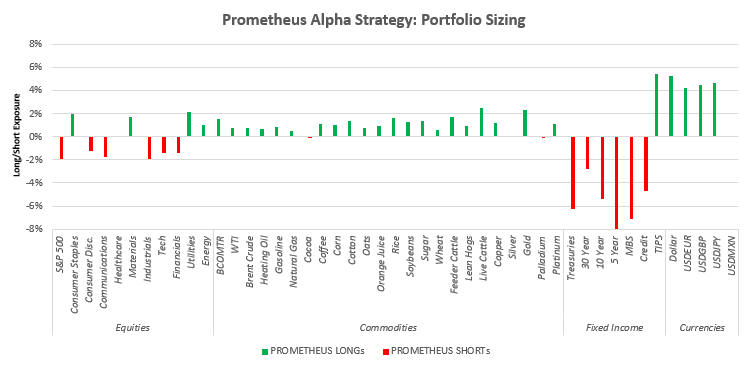
We expect leading growth data like PMIs to paint a weak picture, while production data could continue to come in strong. We will carefully watch housing data to see if there is further deterioration in the housing outlook. In light of these fundamental and market conditions, our systems remain long inflation beneficiaries and short of assets that cannot survive this environment. Below, we show how our Alpha Strategy is positioned at the asset class level:

As we can see above, our systems remain aggressively short equities and fixed income while staying long dollars and commodities. Last week was a great week for this approach, and our systems continue to maintain the conviction that the environment has not materially changed yet. We show our exposures for the Alpha Strategies at the asset level below:
We continue to reiterate that this is a time for capital preservation and active shorting. Even if you aren’t generating returns on the short side, not losing money on the long side is also alpha. Stay nimble.
Good day! Do you know if they make any plugins
to help with SEO? I’m trying to get my blog to rank for some targeted keywords
but I’m not seeing very good results. If you know of any please share.
Kudos! You can read similar blog here: Eco product
Be certain that the mattress fits snugly — if you possibly can fit two fingers between the mattress and the side of the crib, your baby’s head might turn out to be wedged there.
After checking out a handful of the blog articles on your website, I honestly like your way of blogging. I added it to my bookmark website list and will be checking back soon. Take a look at my web site too and let me know what you think.
Hello! I could have sworn I’ve visited your blog before but after browsing through many of the posts I realized it’s new to me. Anyways, I’m definitely happy I came across it and I’ll be book-marking it and checking back frequently.
An outstanding share! I’ve just forwarded this onto a coworker who has been conducting a little research on this. And he actually bought me breakfast because I discovered it for him… lol. So allow me to reword this…. Thank YOU for the meal!! But yeah, thanks for spending the time to talk about this topic here on your web page.
I needed to thank you for this excellent read!! I absolutely loved every little bit of it. I have got you bookmarked to look at new things you post…
Oh my goodness! Incredible article dude! Thank you, However I am going through issues with your RSS. I don’t understand why I cannot subscribe to it. Is there anybody getting identical RSS issues? Anybody who knows the answer will you kindly respond? Thanks.
This is a topic that is close to my heart… Many thanks! Where are your contact details though?
There’s definately a great deal to find out about this subject. I really like all of the points you made.
Next time I read a blog, I hope that it does not fail me as much as this one. I mean, Yes, it was my choice to read, but I actually believed you’d have something interesting to say. All I hear is a bunch of whining about something you could possibly fix if you weren’t too busy searching for attention.
Pretty! This has been an incredibly wonderful article. Thank you for providing this info.
Hi, I do think this is a great website. I stumbledupon it 😉 I am going to come back once again since I book-marked it. Money and freedom is the greatest way to change, may you be rich and continue to guide other people.
You’re so interesting! I do not suppose I have read anything like this before. So great to find somebody with genuine thoughts on this topic. Really.. many thanks for starting this up. This site is something that’s needed on the web, someone with some originality.
This is a topic that’s close to my heart… Best wishes! Where can I find the contact details for questions?
Way cool! Some very valid points! I appreciate you penning this write-up and also the rest of the site is really good.
An impressive share! I have just forwarded this onto a co-worker who was conducting a little research on this. And he actually bought me lunch due to the fact that I found it for him… lol. So let me reword this…. Thanks for the meal!! But yeah, thanx for spending some time to discuss this matter here on your website.
I really like it when individuals come together and share ideas. Great site, stick with it.
This is a topic that is close to my heart… Best wishes! Exactly where can I find the contact details for questions?
I seriously love your blog.. Excellent colors & theme. Did you build this amazing site yourself? Please reply back as I’m wanting to create my own website and would love to learn where you got this from or exactly what the theme is named. Kudos.
Nice post. I learn something new and challenging on blogs I stumbleupon everyday. It’s always helpful to read through articles from other writers and use a little something from their sites.
Next time I read a blog, Hopefully it won’t fail me as much as this one. After all, Yes, it was my choice to read, nonetheless I actually thought you’d have something useful to say. All I hear is a bunch of whining about something you can fix if you were not too busy searching for attention.
You made some really good points there. I looked on the net to learn more about the issue and found most people will go along with your views on this site.
Good post. I learn something new and challenging on websites I stumbleupon everyday. It’s always useful to read articles from other authors and practice something from their web sites.
I used to be able to find good advice from your blog articles.
An intriguing discussion is worth comment. I do think that you ought to write more about this issue, it may not be a taboo subject but typically people do not discuss such issues. To the next! Many thanks!
You are so interesting! I do not think I have read through a single thing like that before. So great to find somebody with a few original thoughts on this topic. Seriously.. many thanks for starting this up. This site is something that is required on the web, someone with a little originality.
It’s nearly impossible to find experienced people about this topic, but you seem like you know what you’re talking about! Thanks
Nice post. I learn something new and challenging on blogs I stumbleupon every day. It will always be interesting to read content from other writers and practice a little something from other web sites.
Greetings! Very helpful advice within this post! It’s the little changes that produce the largest changes. Thanks for sharing!
I truly love your site.. Very nice colors & theme. Did you develop this site yourself? Please reply back as I’m looking to create my own personal site and would love to find out where you got this from or just what the theme is called. Cheers!
There’s certainly a lot to learn about this issue. I like all the points you’ve made.
It’s nearly impossible to find well-informed people in this particular subject, but you sound like you know what you’re talking about! Thanks
I truly appreciated this gorgeous blog. Make sure you keep up the good work. Best Regards .
I could not refrain from commenting. Exceptionally well written!
Good post. I learn something totally new and challenging on sites I stumbleupon everyday. It will always be useful to read content from other writers and practice a little something from their sites.
As much as I dislike “Independence Day”, at least you got a good idea of what the aliens looked like in the famous autopsy scene.
Great blog here! Also your website loads up fast! What host are you the usage of? Can I get your affiliate hyperlink for your host? I want my website loaded up as quickly as yours lol.
I really love your website.. Great colors & theme. Did you make this website yourself? Please reply back as I’m hoping to create my own website and would love to learn where you got this from or just what the theme is called. Cheers!
Hey there! I just want to give you a huge thumbs up for your great info you have right here on this post. I’ll be coming back to your site for more soon.
I do agree with all of the ideas you have presented in your post. Theyre really convincing and will definitely work. Still, the posts are too short for beginners. Could you please extend them a bit from next time? Thanks for the post.
I’m amazed, I must say. Rarely do I come across a blog that’s both equally educative and amusing, and without a doubt, you’ve hit the nail on the head. The problem is something that too few people are speaking intelligently about. I’m very happy that I found this during my search for something regarding this.
Hi, I do believe this is an excellent website. I stumbledupon it 😉 I am going to return yet again since I bookmarked it. Money and freedom is the greatest way to change, may you be rich and continue to help other people.
Everybody Hates Chris sometimes bores me because the jokes aren’t so funny anymore but i still watch it all the time,
You have a few helpful ideas! Perhaps I should think of trying to do this myself. Respectfully
The next time I learn a weblog, I hope that it doesnt disappoint me as a lot as this one. I imply, I know it was my option to learn, however I actually thought youd have something interesting to say. All I hear is a bunch of whining about something that you may fix for those who werent too busy in search of attention.
There is definately a lot to know about this issue. I really like all of the points you have made.
After study many of the content with your web site now, we genuinely much like your technique of blogging. I bookmarked it to my bookmark site list and you will be checking back soon. Pls look at my web site likewise and figure out what you consider.
Twitter had a tweet on wholesale designer handbags, and lead me here.
I have noticed that over the course of making a relationship with real estate homeowners, you’ll be able to come to understand that, in every real estate transaction, a commission rate is paid. Finally, FSBO sellers tend not to “save” the commission rate. Rather, they fight to win the commission simply by doing a strong agent’s work. In the process, they shell out their money and time to accomplish, as best they’re able to, the tasks of an realtor. Those duties include revealing the home via marketing, representing the home to all buyers, creating a sense of buyer emergency in order to induce an offer, making arrangement for home inspections, controlling qualification checks with the bank, supervising maintenance, and facilitating the closing of the deal.
my kids really like to play with those assorted pool toys, they specially like pokemon pool toys and stuff like that**
Saved as a favorite, I like your site!
i would love to get some free calendars on the internet, are there are sites or company that gives one?,.
Hey, you used to write wonderful, but the last few posts have been kinda boring¡K I miss your great writings. Past few posts are just a bit out of track! come on!
You are so cool! I do not think I’ve truly read something like that before. So good to find somebody with some unique thoughts on this subject. Seriously.. thank you for starting this up. This website is one thing that is required on the internet, someone with some originality.
Hey very nice site!! Man .. Beautiful .. Amazing .. I’ll bookmark your website and take the feeds also…I’m happy to find numerous useful information here in the post, we need develop more strategies in this regard, thanks for sharing. . . . . .
Thanks for the sensible critique. Me & my neighbor were just preparing to do a little research on this. We got a grab a book from our local library but I think I learned more from this post. I am very glad to see such great info being shared freely out there.
I recognize there exists a great deal of spam on this blog site. Do you need help cleaning them up? I can help among courses!
After I originally commented I appear to have clicked the -Notify me when new comments are added- checkbox and from now on each time a comment is added I receive 4 emails with the same comment. Is there an easy method you can remove me from that service? Thank you.
Howdy! This article couldn’t be written any better! Looking at this post reminds me of my previous roommate! He constantly kept talking about this. I’ll send this article to him. Pretty sure he will have a great read. I appreciate you for sharing!
thank you for sharing – Gulvafslibning | Kurt Gulvmand with us, I think – Gulvafslibning | Kurt Gulvmand truly stands out : D.
Hello there, May I download that snapshot and make use of it on my personal weblog?
After study a number of the blogs in your website now, and that i genuinely like your method of blogging. I bookmarked it to my bookmark web site list and you will be checking back soon. Pls look at my website also and inform me what you believe.
I was able to find good advice from your blog articles.
very nice post, i definitely enjoy this excellent website, continue it
This is a great blog” and i want to visit this every day of the week .
I truly appreciate this post. I¡¦ve been looking everywhere for this! Thank goodness I found it on Bing. You’ve made my day! Thanks again Pristina Travel
Hello There. I found your blog using msn. This is an extremely well written article. I will be sure to bookmark it and return to read more of your useful information. Thanks for the post. I’ll certainly comeback.
You made some decent points there. I looked on the internet for your issue and located most people may go together with together with your web site.
it is wise to choice to select Light Emitting Diode christmas lights becaue they are not fire hazard“
i do not use adbrite because their pay rate is horrendously low compared to say infolinks;
Man that was very entertaining and at the same time informative.`*-”~
Oh my goodness! an amazing article dude. Thanks However I’m experiencing problem with ur rss . Don’t know why Unable to subscribe to it. Is there anybody getting similar rss downside? Anybody who knows kindly respond. Thnkx
Can I just say what a relief to find somebody who genuinely knows what they are discussing online. You certainly understand how to bring a problem to light and make it important. A lot more people should look at this and understand this side of your story. I was surprised you aren’t more popular since you surely have the gift.
Hi, I do believe this is a great site. I stumbledupon it 😉 I may revisit yet again since I saved as a favorite it. Money and freedom is the best way to change, may you be rich and continue to guide other people.
There are some attention-grabbing closing dates on this article however I don’t know if I see all of them middle to heart. There is some validity but I’ll take hold opinion until I look into it further. Good article , thanks and we want more! Added to FeedBurner as nicely
I do consider all of the concepts you’ve introduced on your post. They’re very convincing and will certainly work. Nonetheless, the posts are too short for starters. Could you please lengthen them a bit from next time? Thanks for the post. Pristina Hotels
there are lots of exercise guides on the internet but some of them are not scientifically proven and just assumptions;;
I like it whenever people get together and share opinions. Great site, stick with it.
You really make it seem so easy with your presentation but I find this topic to be really something that I think I would never understand. It seems too complex and extremely broad for me. I’m looking forward for your next post, I’ll try to get the hang of it!
Hello! I just wanted to ask if you ever have any issues with hackers? My last blog (wordpress) was hacked and I ended up losing several weeks of hard work due to no back up. Do you have any methods to stop hackers?
It’s onerous to seek out knowledgeable folks on this subject, but you sound like you already know what you’re talking about! Thanks
I just put the link of your blog on my Facebook Wall. very nice blog indeed.~,~,*
it does not take too long to learn good piano playing if you have a good piano lesson*
I enjoy what you guys tend to be up too. This kind of clever work and reporting! Keep up the great works guys I’ve added you guys to blogroll.
bookmarked!!, I really like your web site!
One more important issue is that if you are a mature person, travel insurance for pensioners is something you need to really look at. The more mature you are, a lot more at risk you’re for getting something bad happen to you while abroad. If you are not necessarily covered by some comprehensive insurance coverage, you could have quite a few serious challenges. Thanks for discussing your good tips on this web site.
You’re so interesting! I don’t believe I have read through anything like that before. So great to discover someone with a few unique thoughts on this subject. Really.. many thanks for starting this up. This site is one thing that is needed on the web, someone with a bit of originality.
An impressive share! I’ve just forwarded this onto a co-worker who had been doing a little research on this. And he actually ordered me breakfast simply because I discovered it for him… lol. So allow me to reword this…. Thanks for the meal!! But yeah, thanks for spending the time to discuss this topic here on your website.
Hello there! This article couldn’t be written much better! Reading through this post reminds me of my previous roommate! He continually kept talking about this. I am going to send this post to him. Pretty sure he will have a great read. I appreciate you for sharing!
This site certainly has all of the information and facts I needed concerning this subject and didn’t know who to ask.
You made some really good points there. I looked on the internet to find out more about the issue and found most people will go along with your views on this site.
I know which Sage will not be upsetting demise with the appearance, and thus concerns about his or her country’s will fall.
I am glad that I noticed this site , just the right information that I was looking for! .
I’m really enjoying the theme/design of your website. Do you ever run into any browser compatibility issues? A couple of my blog audience have complained about my blog not working correctly in Explorer but looks great in Safari. Do you have any suggestions to help fix this issue?
A fascinating discussion is definitely worth comment. I believe that you need to write more on this subject matter, it might not be a taboo subject but usually folks don’t talk about such subjects. To the next! All the best.
After study few of the articles on your blog nowadays, and i love your method of blogging. I tag it to my favorites net web site list and will be checking back soon. Please visit my web site too and let me recognize your thought.
Vi ringrazio, ho trovato che quanto scritto non sia completamente corretto
When visiting blogs, i always look for a very nice content like yours .
This web site truly has all of the info I wanted about this subject and didn’t know who to ask.
Oh my goodness! Impressive article dude! Many thanks, However I am having troubles with your RSS. I don’t understand why I am unable to subscribe to it. Is there anyone else having the same RSS problems? Anyone that knows the solution can you kindly respond? Thanx.
Greetings, There’s no doubt that your site might be having internet browser compatibility problems. Whenever I look at your web site in Safari, it looks fine but when opening in I.E., it has some overlapping issues. I simply wanted to provide you with a quick heads up! Other than that, excellent website.
Howdy! This post couldn’t be written much better! Looking at this post reminds me of my previous roommate! He constantly kept preaching about this. I most certainly will forward this post to him. Pretty sure he will have a great read. Thanks for sharing!
Blaine is not the best magician but i can say that he has great showmanship and i like his show.
I truly wanted to jot down a brief remark to be able to express gratitude to you for all of the splendid items you are posting here. My incredibly long internet investigation has at the end been compensated with reasonable points to exchange with my colleagues. I would tell you that many of us readers actually are undeniably lucky to exist in a remarkable site with many perfect individuals with very helpful tips. I feel really grateful to have used your entire web site and look forward to some more excellent minutes reading here. Thank you again for a lot of things.
bookmarked!!, I like your website!
I and my buddies were analyzing the nice information found on your site while at once came up with an awful feeling I never thanked you for those techniques. Those boys were as a result glad to see them and have in effect in actuality been tapping into them. Many thanks for getting simply considerate as well as for opting for this form of impressive issues millions of individuals are really desperate to be aware of. My honest regret for not expressing appreciation to sooner.
Play Black Ops Zombies… […]Call of Duty Black Ops zombie mode has been played by millions of gamers…[…]…
I was able to find good advice from your content.
I am curious to find out what blog system you have been using? I’m having some minor security problems with my latest site and I’d like to find something more safeguarded. Do you have any recommendations?
I will immediately snatch your rss feed as I can not in finding your email subscription link or e-newsletter service. Do you’ve any? Kindly allow me recognise so that I may subscribe. Thanks.
May I simply just say what a relief to uncover someone who genuinely understands what they’re talking about online. You definitely know how to bring a problem to light and make it important. A lot more people really need to check this out and understand this side of the story. I can’t believe you’re not more popular since you surely have the gift.
This is a topic that is close to my heart… Many thanks! Where can I find the contact details for questions?
You made some really good points there. I checked on the internet to learn more about the issue and found most people will go along with your views on this site.
I used to be able to find good info from your blog articles.
Your style is so unique compared to other people I have read stuff from. Thanks for posting when you’ve got the opportunity, Guess I will just book mark this site.
Hello there! I could have sworn I’ve visited your blog before but after looking at some of the articles I realized it’s new to me. Regardless, I’m certainly delighted I found it and I’ll be book-marking it and checking back often!
Pretty! This has been an extremely wonderful article. Thank you for providing this information.
I couldn’t refrain from commenting. Exceptionally well written!
It’s difficult to find experienced people in this particular topic, but you sound like you know what you’re talking about! Thanks
There’s certainly a great deal to find out about this issue. I love all of the points you’ve made.
Hi! I could have sworn I’ve been to this blog before but after going through many of the articles I realized it’s new to me. Nonetheless, I’m certainly delighted I stumbled upon it and I’ll be book-marking it and checking back frequently!
I need to to thank you for this wonderful read!! I absolutely loved every bit of it. I’ve got you book marked to check out new stuff you post…
Good post. I learn something new and challenging on sites I stumbleupon every day. It will always be exciting to read through content from other writers and use something from their websites.
Hello, I think your blog may be having browser compatibility problems. Whenever I take a look at your web site in Safari, it looks fine however when opening in I.E., it’s got some overlapping issues. I merely wanted to give you a quick heads up! Besides that, fantastic website.
Next time I read a blog, Hopefully it does not fail me just as much as this particular one. I mean, I know it was my choice to read, but I really believed you would have something useful to talk about. All I hear is a bunch of moaning about something you could possibly fix if you weren’t too busy seeking attention.
Having read this I believed it was rather informative. I appreciate you finding the time and energy to put this content together. I once again find myself spending a lot of time both reading and commenting. But so what, it was still worthwhile!
Your style is so unique in comparison to other people I’ve read stuff from. I appreciate you for posting when you have the opportunity, Guess I will just bookmark this web site.
Excellent article. I absolutely appreciate this site. Continue the good work!
I like it when individuals come together and share views. Great blog, keep it up!
I need to to thank you for this very good read!! I certainly loved every bit of it. I’ve got you book-marked to look at new stuff you post…
There is definately a lot to find out about this topic. I like all the points you’ve made.
After going over a number of the blog posts on your site, I truly like your technique of blogging. I saved it to my bookmark webpage list and will be checking back soon. Please visit my website too and let me know what you think.
I wanted to thank you for this great read!! I absolutely enjoyed every bit of it. I have you book marked to look at new stuff you post…
Aw, this was a really good post. Finding the time and actual effort to make a great article… but what can I say… I put things off a lot and don’t seem to get nearly anything done.
Very good article. I absolutely appreciate this website. Continue the good work!
Very nice article. I certainly appreciate this site. Thanks!
Hey there! I just wish to offer you a huge thumbs up for your great information you have here on this post. I am coming back to your website for more soon.
Having read this I believed it was really informative. I appreciate you taking the time and effort to put this article together. I once again find myself personally spending way too much time both reading and posting comments. But so what, it was still worthwhile.
I’m amazed, I have to admit. Seldom do I encounter a blog that’s both educative and amusing, and without a doubt, you’ve hit the nail on the head. The issue is something which too few people are speaking intelligently about. Now i’m very happy I found this in my hunt for something concerning this.
Way cool! Some extremely valid points! I appreciate you writing this article and the rest of the website is very good.
You have made some good points there. I looked on the net to find out more about the issue and found most people will go along with your views on this web site.
There’s definately a lot to know about this subject. I really like all of the points you’ve made.
When I initially left a comment I appear to have clicked on the -Notify me when new comments are added- checkbox and from now on each time a comment is added I recieve four emails with the same comment. There has to be a way you are able to remove me from that service? Kudos.
Having read this I thought it was very informative. I appreciate you taking the time and effort to put this information together. I once again find myself personally spending a lot of time both reading and leaving comments. But so what, it was still worthwhile!
https://medium.com/@carlfrancoh38793/%EB%84%A4%EC%9D%B4%EB%B2%84-%EC%95%84%EC%9D%B4%EB%94%94-%EA%B5%AC%EB%A7%A4-%ED%9B%84-%EA%B4%91%EA%B3%A0-%EA%B4%80%EB%A6%AC%EC%97%90-%ED%99%9C%EC%9A%A9%ED%95%98%EB%8A%94-%EB%B0%A9%EB%B2%95-6a822042a160
https://naveridbuy.blogspot.com/2024/12/blog-post_52.html
https://witty-apple-dd3cm1.mystrikingly.com/blog/bf0bc875058
https://ocher-cat-dd3cmm.mystrikingly.com/blog/642842abd0f
https://ko.anotepad.com/note/read/wyj88hps
https://sociable-corn-dd3cmt.mystrikingly.com/blog/4997451cd2d
https://diplomatic-shrimp-dbgzh2.mystrikingly.com/blog/079e4cac293
https://naveridbuy.blogspot.com/2024/11/5_28.html
You’ve made some decent points there. I checked on the web for additional information about the issue and found most people will go along with your views on this site.
https://xn--w6-hd0j99gyns5z0qeiim2i.mystrikingly.com/blog/f33715c06a4
https://maize-wombat-dd3cms.mystrikingly.com/blog/869d7ae7ea5
You’ve made some good points there. I checked on the net to find out more about the issue and found most individuals will go along with your views on this web site.
Very nice write-up. I certainly love this site. Keep writing!
https://medium.com/@charlielevesque328/%EB%B9%84%EC%95%84%EA%B7%B8%EB%9D%BC-%EC%98%A8%EB%9D%BC%EC%9D%B8-%EA%B5%AC%EB%A7%A4-%ED%9B%84%EA%B8%B0%EC%99%80-%EC%A3%BC%EC%9D%98%ED%95%B4%EC%95%BC-%ED%95%A0-%EC%A0%90%EB%93%A4-4a51bcd6c007
https://ko.anotepad.com/note/read/mfwncatr
Everyone loves it whenever people come together and share ideas. Great website, stick with it!
https://candid-lion-dd3cm3.mystrikingly.com/blog/8c25ae9d7a9
https://witty-apple-dd3cm1.mystrikingly.com/blog/6e9742ef068
https://naveridbuy.blogspot.com/2024/12/blog-post_19.html
https://naveridbuy.exblog.jp/37090971/
Everything is very open with a clear clarification of the challenges. It was definitely informative. Your site is extremely helpful. Thanks for sharing.
https://naveridbuy.blogspot.com/2024/11/top-5.html
https://witty-apple-dd3cm1.mystrikingly.com/blog/6e9742ef068
https://adaptable-camellia-dd3cm4.mystrikingly.com/blog/79c90dfb696
https://naveridbuy.exblog.jp/37091141/
https://naveridbuy.exblog.jp/37152070/
https://inky-owl-dd3cmv.mystrikingly.com/blog/f111c3c7d0d
https://medium.com/@carlfrancoh38793/%EB%84%A4%EC%9D%B4%EB%B2%84-%EC%95%84%EC%9D%B4%EB%94%94%EA%B0%80-%ED%95%84%EC%9A%94%ED%95%A0-%EB%95%8C-%EA%B5%AC%EB%A7%A4%EA%B0%80-%EB%8B%B5%EC%9D%BC%EA%B9%8C-4bbacce4d7df
https://candid-lion-dd3cm3.mystrikingly.com/blog/8c25ae9d7a9
https://candid-lion-dd3cm3.mystrikingly.com/blog/2024
Spot on with this write-up, I really feel this amazing site needs a lot more attention. I’ll probably be back again to read through more, thanks for the advice!
https://maize-wombat-dd3cms.mystrikingly.com/blog/90c3ba770c0
https://writeablog.net/cxt2qn6408
https://telegra.ph/%EB%B9%84%EC%95%84%EA%B7%B8%EB%9D%BC-%EA%B5%AC%EB%A7%A4-%EC%8B%9C-%ED%95%84%EC%88%98-%EC%B2%B4%ED%81%AC%EB%A6%AC%EC%8A%A4%ED%8A%B8-10-10
Having read this I believed it was extremely informative. I appreciate you taking the time and energy to put this information together. I once again find myself spending a significant amount of time both reading and leaving comments. But so what, it was still worth it!
https://telegra.ph/%EB%B9%84%EC%95%84%EA%B7%B8%EB%9D%BC-%EA%B5%AC%EB%A7%A4%EB%A5%BC-%EC%9C%84%ED%95%9C-%EC%A0%84%EB%AC%B8%EA%B0%80%EC%9D%98-%EC%A1%B0%EC%96%B8-09-26
https://medium.com/@1kelly76/%EB%B9%84%EC%95%84%EA%B7%B8%EB%9D%BC-%EA%B5%AC%EB%A7%A4-%ED%9B%84-%EB%B6%80%EC%9E%91%EC%9A%A9-%EB%8C%80%EC%B2%98%EB%B2%95-52675767f799
https://naveridbuy.blogspot.com/2024/11/blog-post_50.html
https://naveridbuy.blogspot.com/2024/11/blog-post_95.html
https://naveridbuy.blogspot.com/2024/11/2024.html
https://medium.com/@carlfrancoh38793/%EB%84%A4%EC%9D%B4%EB%B2%84-%EC%95%84%EC%9D%B4%EB%94%94-%EB%B9%84%EB%B0%80%EB%B2%88%ED%98%B8-%EB%B3%B5%EA%B5%AC%ED%95%98%EB%8A%94-5%EA%B0%80%EC%A7%80-%EB%B0%A9%EB%B2%95-216aafd6cf7c
https://medium.com/@carlfrancoh38793/%EB%84%A4%EC%9D%B4%EB%B2%84-%EC%B9%B4%ED%8E%98-%EC%9A%B4%EC%98%81%EC%9D%84-%EC%9C%84%ED%95%9C-%EC%95%84%EC%9D%B4%EB%94%94-%EA%B5%AC%EB%A7%A4-%ED%8C%81-eb39c3e24984
https://candid-lion-dd3cm3.mystrikingly.com/blog/5037f72f44c
https://telegra.ph/%EB%84%A4%EC%9D%B4%EB%B2%84-%EC%95%84%EC%9D%B4%EB%94%94-%EC%97%86%EC%9D%B4-%EC%84%9C%EB%B9%84%EC%8A%A4-%EC%9D%B4%EC%9A%A9%ED%95%98%EB%8A%94-%ED%8C%81-12-13
https://candid-lion-dd3cm3.mystrikingly.com/blog/8085327d927
https://naveridbuy.blogspot.com/2024/11/blog-post_7.html
https://medium.com/@carlfrancoh38793/%EC%95%84%EC%9D%B4%EB%94%94-%EC%83%9D%EC%84%B1-%EC%96%B4%EB%A0%A4%EC%9A%B8-%EB%95%8C-%EA%B5%AC%EB%A7%A4-%EB%8C%80%EC%95%88-%EC%95%8C%EC%95%84%EB%B3%B4%EA%B8%B0-62055e09b46c
https://writeablog.net/jr525di7pj
https://medium.com/@charlielevesque328/%EB%B9%84%EC%95%84%EA%B7%B8%EB%9D%BC-%ED%9A%A8%EA%B3%BC%EC%99%80-%EA%B5%AC%EB%A7%A4-%EC%8B%9C-%EC%A3%BC%EC%9D%98%EC%82%AC%ED%95%AD-%EC%B4%9D%EC%A0%95%EB%A6%AC-165d650962af
https://medium.com/@carlfrancoh38793/%EA%B5%AC%EA%B8%80-%EC%95%84%EC%9D%B4%EB%94%94-%EA%B5%AC%EB%A7%A4-%EC%9D%B4%EC%A0%90%EA%B3%BC-%EB%8B%A8%EC%A0%90%EC%9D%80-%EB%AC%B4%EC%97%87%EC%9D%B8%EA%B0%80%EC%9A%94-4dccd7ee3fc1
https://medium.com/@nsw5288/%EB%B9%84%EC%95%84%EA%B7%B8%EB%9D%BC-%EC%98%A8%EB%9D%BC%EC%9D%B8-%EC%B2%98%EB%B0%A9-abaaad6ae4b4
https://naveridbuy.blogspot.com/2024/12/blog-post_52.html
https://naveridbuy.blogspot.com/2024/12/blog-post_82.html
https://naveridbuy.exblog.jp/37152100/
https://writeablog.net/mzlw3kmb0y
https://naveridbuy.blogspot.com/2024/12/blog-post_31.html
https://salmon-peach-dd3cm8.mystrikingly.com/blog/dbd2b0155cb
https://writeablog.net/cxt2qn6408
https://golden-grape-dd3cml.mystrikingly.com/blog/4644761650e
https://maize-wombat-dd3cms.mystrikingly.com/blog/dad3e41e83f
https://viastoer.blogspot.com/2024/09/blog-post_82.html
https://ko.anotepad.com/note/read/hi75snr3
Great post. I’m facing many of these issues as well..
https://hallbook.com.br/blogs/376901/%EB%84%A4%EC%9D%B4%EB%B2%84-%EC%95%84%EC%9D%B4%EB%94%94-%EA%B1%B0%EB%9E%98%EB%8A%94-%EC%95%88%EC%A0%84%ED%95%9C%EA%B0%80-%EC%A0%84%EB%AC%B8%EA%B0%80%EC%9D%98-%EC%A1%B0%EC%96%B8
https://naveridbuy.exblog.jp/37152158/
https://medium.com/@nsw5288/%EB%B9%84%EC%95%84%EA%B7%B8%EB%9D%BC-%EA%B5%AC%EB%A7%A4-%EB%B0%A9%EB%B2%95%EA%B3%BC-%ED%9A%A8%EA%B3%BC%EC%A0%81%EC%9D%B8-%EC%82%AC%EC%9A%A9%EB%B2%95-71efc491ca1b
https://naveridbuy.exblog.jp/37152120/
https://witty-apple-dd3cm1.mystrikingly.com/blog/6e9742ef068
https://gajweor.pixnet.net/blog/post/162189334
https://xn--w2-hd0j99gyns5z0qeiim2i.mystrikingly.com/blog/f803065301b
https://telegra.ph/%EB%B9%84%EC%95%84%EA%B7%B8%EB%9D%BC%EB%A5%BC-%EC%B2%98%EC%9D%8C-%EC%8B%9C%EB%8F%84%ED%95%98%EB%8A%94-%EB%B6%84%EB%93%A4%EC%9D%84-%EC%9C%84%ED%95%9C-%EA%B0%80%EC%9D%B4%EB%93%9C-09-12
https://naveridbuy.blogspot.com/2024/12/blog-post_52.html
https://naveridbuy.blogspot.com/2024/12/blog-post_29.html
https://azure-elk-dbgzhz.mystrikingly.com/blog/59835514c6a
https://telegra.ph/%EB%B9%84%EC%95%84%EA%B7%B8%EB%9D%BC-%EA%B5%AC%EB%A7%A4-%EA%B0%80%EC%9D%B4%EB%93%9C-%EC%95%88%EC%A0%84%ED%95%98%EA%B3%A0-%EC%A0%80%EB%A0%B4%ED%95%98%EA%B2%8C-%EA%B5%AC%EB%A7%A4%ED%95%98%EB%8A%94-%EB%B0%A9%EB%B2%95-09-26
https://medium.com/@carlfrancoh38793/%EC%A4%91%EA%B3%A0-%EB%84%A4%EC%9D%B4%EB%B2%84-%EC%95%84%EC%9D%B4%EB%94%94%EB%A5%BC-%ED%9A%A8%EA%B3%BC%EC%A0%81%EC%9C%BC%EB%A1%9C-%ED%99%9C%EC%9A%A9%ED%95%98%EB%8A%94-%EB%B0%A9%EB%B2%95-a5bd35053073
https://writeablog.net/qmceliv4q8
https://inky-owl-dd3cmv.mystrikingly.com/blog/570378fab9f
After going over a few of the blog posts on your site, I seriously like your technique of blogging. I saved it to my bookmark site list and will be checking back in the near future. Please check out my web site too and tell me your opinion.
https://naveridbuy.blogspot.com/2024/11/5_28.html
https://naveridbuy.blogspot.com/2024/11/blog-post_28.html
https://medium.com/@nsw5288/%EB%B9%84%EC%95%84%EA%B7%B8%EB%9D%BC-%EA%B5%AC%EB%A7%A4-%ED%9B%84%EA%B8%B0-%EB%AA%A8%EC%9D%8C-%EC%8B%A0%EB%A2%B0%ED%95%A0-%EC%88%98-%EC%9E%88%EC%9D%84%EA%B9%8C-5dc2946813fc
https://writeablog.net/mqcuo9vdox
https://naveridbuy.exblog.jp/35659120/
https://inky-owl-dd3cmv.mystrikingly.com/blog/8b5f29aef6c
https://medium.com/@carlfrancoh38793/%EB%84%A4%EC%9D%B4%EB%B2%84-%EC%95%84%EC%9D%B4%EB%94%94-%EC%A0%95%EB%A7%90-%ED%95%84%EC%9A%94%ED%95%9C%EA%B0%80-%EA%B5%AC%EB%A7%A4-%EC%9D%B4%EC%9C%A0-10%EA%B0%80%EC%A7%80-551cc5f335a5
https://adaptable-camellia-dd3cm4.mystrikingly.com/blog/70aed56e7e8
https://hallbook.com.br/blogs/300792/%EB%B9%84%EC%95%84%EA%B7%B8%EB%9D%BC-%EA%B0%80%EA%B2%A9-%EB%B9%84%EA%B5%90-%EC%A0%80%EB%A0%B4%ED%95%98%EA%B2%8C-%EA%B5%AC%EB%A7%A4%ED%95%98%EB%8A%94-%ED%8C%81
https://humorous-lemon-dbgzhk.mystrikingly.com/blog/8329e7be5a2
https://medium.com/@carlfrancoh38793/%EB%84%A4%EC%9D%B4%EB%B2%84-%EC%95%84%EC%9D%B4%EB%94%94-%EC%97%B0%EB%8F%99%ED%95%9C-%EB%8B%A4%EB%A5%B8-%EC%84%9C%EB%B9%84%EC%8A%A4-%ED%99%9C%EC%9A%A9%EB%B2%95-5dde0d66c6f6
https://xn--w7-hd0jg6f81lm0dhhw74c.mystrikingly.com/blog/8c2d2ec4d69
https://medium.com/@nsw5288/%EB%B9%84%EC%95%84%EA%B7%B8%EB%9D%BC%EB%A5%BC-%EC%A0%80%EB%A0%B4%ED%95%98%EA%B2%8C-%EA%B5%AC%EB%A7%A4%ED%95%98%EB%8A%94-%EB%B2%95-%EA%B0%80%EA%B2%A9-%EC%A0%88%EA%B0%90-%ED%8C%81-0d6cba0d9d92
https://naveridbuy.blogspot.com/2024/11/blog-post_7.html
https://candid-lion-dd3cm3.mystrikingly.com/blog/53469580831
That is a very good tip particularly to those new to the blogosphere. Short but very accurate info… Many thanks for sharing this one. A must read post.
https://medium.com/@nsw5288/%EB%B9%84%EC%95%84%EA%B7%B8%EB%9D%BC-%EA%B5%AC%EB%A7%A4-%EC%82%AC%EC%9D%B4%ED%8A%B8-be7ed9932b6f
https://ko.anotepad.com/note/read/pymsgn44
https://naveridbuy.exblog.jp/37091323/
https://medium.com/@carlfrancoh38793/%EA%B5%AC%EA%B8%80-%EC%95%84%EC%9D%B4%EB%94%94-%EA%B5%AC%EB%A7%A4-%EC%9D%B4%EC%A0%90%EA%B3%BC-%EB%8B%A8%EC%A0%90%EC%9D%80-%EB%AC%B4%EC%97%87%EC%9D%B8%EA%B0%80%EC%9A%94-4dccd7ee3fc1
https://telegra.ph/%EB%84%A4%EC%9D%B4%EB%B2%84-%EC%95%84%EC%9D%B4%EB%94%94-%EA%B1%B0%EB%9E%98%EB%8A%94-%EC%95%88%EC%A0%84%ED%95%9C%EA%B0%80-%EC%A0%84%EB%AC%B8%EA%B0%80%EC%9D%98-%EC%A1%B0%EC%96%B8-12-13-2
https://gajweor.pixnet.net/blog/post/162874531
Having read this I thought it was very informative. I appreciate you finding the time and energy to put this informative article together. I once again find myself spending way too much time both reading and posting comments. But so what, it was still worthwhile!
https://gajweor.pixnet.net/blog/post/162189334
https://loyal-giraffe-dbgzh9.mystrikingly.com/blog/324f4b43b02
https://writeablog.net/nujuali38e
https://writeablog.net/z3f3wqgycr
You’re so awesome! I do not suppose I’ve read something like that before. So nice to discover another person with a few original thoughts on this issue. Really.. thank you for starting this up. This site is something that is needed on the web, someone with a bit of originality.
https://candid-lion-dd3cm3.mystrikingly.com/blog/2024
https://naveridbuy.blogspot.com/2024/11/blog-post_50.html
https://naveridbuy.blogspot.com/2024/11/blog-post_58.html
https://ko.anotepad.com/note/read/hfewbt6j
https://gajweor.pixnet.net/blog/post/162874321
Hello there! This article could not be written much better! Going through this article reminds me of my previous roommate! He continually kept talking about this. I am going to send this information to him. Pretty sure he will have a very good read. Thanks for sharing!
https://naveridbuy.blogspot.com/2024/11/blog-post_3.html
https://candid-lion-dd3cm3.mystrikingly.com/blog/53469580831
https://witty-apple-dd3cm1.mystrikingly.com/blog/5dbde675bb4
https://inky-owl-dd3cmv.mystrikingly.com/blog/8b5f29aef6c
https://candid-lion-dd3cm3.mystrikingly.com/blog/8085327d927
https://medium.com/@carlfrancoh38793/%EB%84%A4%EC%9D%B4%EB%B2%84-%EC%95%84%EC%9D%B4%EB%94%94%EC%99%80-%EA%B4%80%EB%A0%A8%EB%90%9C-%EC%B5%9C%EC%8B%A0-%EB%B3%B4%EC%95%88-%EC%9D%B4%EC%8A%88-4569786b88d3
https://medium.com/@carlfrancoh38793/%EB%84%A4%EC%9D%B4%EB%B2%84-%EC%95%84%EC%9D%B4%EB%94%94-%EA%B5%AC%EB%A7%A4-%ED%9B%84-%EA%B3%84%EC%A0%95-%EB%B3%B4%ED%98%B8-%EB%B0%A9%EB%B2%95-%EC%99%84%EB%B2%BD-%EC%A0%95%EB%A6%AC-ab3a80545ed1
https://naveridbuy.exblog.jp/35878161/
https://witty-apple-dd3cm1.mystrikingly.com/blog/55463079550
https://naveridbuy.blogspot.com/2024/11/blog-post_95.html
Greetings, I believe your blog could be having web browser compatibility problems. Whenever I look at your website in Safari, it looks fine however, if opening in Internet Explorer, it has some overlapping issues. I simply wanted to provide you with a quick heads up! Aside from that, great website!
https://vermilion-elephant-dd3cm3.mystrikingly.com/blog/5bbbfba035e
https://medium.com/@carlfrancoh38793/%EB%84%A4%EC%9D%B4%EB%B2%84-%EC%B9%B4%ED%8E%98-%EC%9A%B4%EC%98%81%EC%9D%84-%EC%9C%84%ED%95%9C-%EC%95%84%EC%9D%B4%EB%94%94-%EA%B5%AC%EB%A7%A4-%ED%8C%81-eb39c3e24984
https://medium.com/@carlfrancoh38793/%EB%84%A4%EC%9D%B4%EB%B2%84-%EC%95%84%EC%9D%B4%EB%94%94-%EA%B5%AC%EB%A7%A4-%ED%9B%84-%EC%8A%A4%EB%A7%88%ED%8A%B8%EC%8A%A4%ED%86%A0%EC%96%B4-%ED%99%9C%EC%9A%A9%EB%B2%95-2d79dbaf8605
https://inky-owl-dd3cmv.mystrikingly.com/blog/481bc4e3083
https://naveridbuy.blogspot.com/2024/11/blog-post_3.html
https://candid-lion-dd3cm3.mystrikingly.com/blog/8085327d927
https://wise-onion-dbgzh0.mystrikingly.com/blog/ca930eb2678
https://candid-dinosaur-dbgzhv.mystrikingly.com/blog/5
https://candid-lion-dd3cm3.mystrikingly.com/blog/b99e214c11a
Aw, this was an incredibly good post. Spending some time and actual effort to produce a very good article… but what can I say… I put things off a lot and never manage to get nearly anything done.
https://candid-lion-dd3cm3.mystrikingly.com/blog/7114981bc76
https://ko.anotepad.com/note/read/pymsgn44
https://gold-gull-dd3cmf.mystrikingly.com/blog/fa06ca9b8e6
I?¦ve recently started a blog, the info you offer on this website has helped me greatly. Thanks for all of your time & work.
https://maize-wombat-dd3cms.mystrikingly.com/blog/b957b6440d6
https://turquoise-dove-dd3cmd.mystrikingly.com/blog/11fff6361ff
https://naveridbuy.exblog.jp/35891793/
https://xn--w0-hs1izvv81cmb366re3s.mystrikingly.com/blog/2e7803c75a6
https://mustard-yucca-dbgzh7.mystrikingly.com/blog/d934217294a
https://writeablog.net/nujuali38e
https://gajweor.pixnet.net/blog/post/162874321
https://writeablog.net/vh97m08dqv
https://medium.com/@nsw5288/%EC%B2%98%EB%B0%A9%EC%A0%84-%EC%97%86%EC%9D%B4-%EB%B9%84%EC%95%84%EA%B7%B8%EB%9D%BC-%EA%B5%AC%EB%A7%A4-%EC%9C%84%ED%97%98%EC%84%B1%EA%B3%BC-%ED%95%A9%EB%B2%95%EC%84%B1-3bf901b3695b
https://xn--w3-hd0jg6f81lm0dhhw74c.mystrikingly.com/blog/633b5d0c891
That is a great tip particularly to those fresh to the blogosphere. Short but very precise info… Thanks for sharing this one. A must read article!
https://adaptable-camellia-dd3cm4.mystrikingly.com/blog/79c90dfb696
https://naveridbuy.blogspot.com/2024/11/blog-post_3.html
https://naveridbuy.blogspot.com/2024/11/2024.html
https://medium.com/@carlfrancoh38793/%EB%84%A4%EC%9D%B4%EB%B2%84-%EC%95%84%EC%9D%B4%EB%94%94-%EA%B5%AC%EB%A7%A4-%EA%B3%BC%EC%97%B0-%EB%8F%88%EA%B0%92%EC%9D%84-%ED%95%A0%EA%B9%8C-d89a0fd7d3c4
https://hallbook.com.br/blogs/376908/%EB%84%A4%EC%9D%B4%EB%B2%84-%EC%95%84%EC%9D%B4%EB%94%94-%EA%B5%AC%EB%A7%A4-%EB%8C%80%EC%8B%A0-%EC%82%AC%EC%9A%A9%ED%95%A0-%EC%88%98-%EC%9E%88%EB%8A%94-%EB%B0%A9%EB%B2%95%EB%93%A4
An outstanding share! I’ve just forwarded this onto a co-worker who was conducting a little homework on this. And he actually ordered me lunch due to the fact that I found it for him… lol. So let me reword this…. Thank YOU for the meal!! But yeah, thanx for spending some time to discuss this matter here on your website.
https://umber-iris-dd3cm2.mystrikingly.com/blog/5d5639e3317
https://medium.com/@carlfrancoh38793/%EB%84%A4%EC%9D%B4%EB%B2%84-%EC%95%84%EC%9D%B4%EB%94%94-%EA%B5%AC%EB%A7%A4-%ED%95%A9%EB%B2%95%EC%9D%B8%EA%B0%80%EC%9A%94-%EC%95%8C%EC%95%84%EB%B4%85%EC%8B%9C%EB%8B%A4-40dff2b624f5
https://naveridbuy.blogspot.com/2024/12/blog-post_70.html
https://naveridbuy.exblog.jp/37152083/
https://medium.com/@carlfrancoh38793/%EB%84%A4%EC%9D%B4%EB%B2%84-%EC%95%84%EC%9D%B4%EB%94%94%EA%B0%80-%ED%95%84%EC%9A%94%ED%95%A0-%EB%95%8C-%EA%B5%AC%EB%A7%A4%EA%B0%80-%EB%8B%B5%EC%9D%BC%EA%B9%8C-4bbacce4d7df
https://adaptable-goat-dd3cmf.mystrikingly.com/blog/2a7fa1850fe
https://candid-lion-dd3cm3.mystrikingly.com/blog/8085327d927
https://naveridbuy.exblog.jp/37152138/
https://candid-lion-dd3cm3.mystrikingly.com/blog/7114981bc76
An impressive share! I’ve just forwarded this onto a coworker who has been doing a little homework on this. And he in fact bought me breakfast due to the fact that I stumbled upon it for him… lol. So allow me to reword this…. Thank YOU for the meal!! But yeah, thanks for spending time to discuss this topic here on your internet site.
https://writeablog.net/ep887shpzn
I’m amazed, I must say. Rarely do I encounter a blog that’s equally educative and engaging, and without a doubt, you’ve hit the nail on the head. The problem is something too few folks are speaking intelligently about. I am very happy I came across this in my hunt for something relating to this.
https://adaptable-goat-dd3cmf.mystrikingly.com/blog/a69238eac25
https://gold-gull-dd3cmf.mystrikingly.com/blog/dc52558c085
https://candid-lion-dd3cm3.mystrikingly.com/blog/7114981bc76
https://medium.com/@carlfrancoh38793/%EB%B9%A0%EB%A5%B4%EA%B2%8C-%EC%8B%9C%EC%9E%91%ED%95%98%EB%8A%94-%EB%84%A4%EC%9D%B4%EB%B2%84-%EC%95%84%EC%9D%B4%EB%94%94-%EA%B5%AC%EB%A7%A4-%ED%99%9C%EC%9A%A9%EB%B2%95-e4a7bf2e3c57
https://naveridbuy.blogspot.com/2024/12/blog-post_36.html
https://gold-gull-dd3cmf.mystrikingly.com/blog/2a47c25c4d9
https://naveridbuy.blogspot.com/2024/12/blog-post_52.html
https://medium.com/@carlfrancoh38793/%EB%84%A4%EC%9D%B4%EB%B2%84-%EC%95%84%EC%9D%B4%EB%94%94-%EC%97%B0%EB%8F%99%ED%95%9C-%EB%8B%A4%EB%A5%B8-%EC%84%9C%EB%B9%84%EC%8A%A4-%ED%99%9C%EC%9A%A9%EB%B2%95-5dde0d66c6f6
After going over a handful of the blog posts on your web site, I honestly like your technique of blogging. I saved as a favorite it to my bookmark website list and will be checking back in the near future. Please visit my web site as well and tell me your opinion.
https://naveridbuy.exblog.jp/37091263/
https://naveridbuy.blogspot.com/2024/12/blog-post_87.html
https://telegra.ph/%EB%84%A4%EC%9D%B4%EB%B2%84-%EC%95%84%EC%9D%B4%EB%94%94-%EA%B5%AC%EB%A7%A4%EA%B0%80-%EB%B6%88%EB%9F%AC%EC%98%A4%EB%8A%94-%EB%B3%B4%EC%95%88-%EC%9C%84%ED%97%98-12-13
https://medium.com/@carlfrancoh38793/%EB%84%A4%EC%9D%B4%EB%B2%84-%EC%95%84%EC%9D%B4%EB%94%94-%EA%B5%AC%EB%A7%A4-%EA%B3%BC%EC%97%B0-%EB%8F%88%EA%B0%92%EC%9D%84-%ED%95%A0%EA%B9%8C-d89a0fd7d3c4
https://naveridbuy.blogspot.com/2024/12/blog-post_31.html
https://naveridbuy.exblog.jp/37090804/
https://maize-wombat-dd3cms.mystrikingly.com/blog/869d7ae7ea5
https://xn--w2-hd0j99gyns5z0qeiim2i.mystrikingly.com/blog/f803065301b
https://telegra.ph/%EB%B9%84%EC%95%84%EA%B7%B8%EB%9D%BC-%EB%B3%B5%EC%9A%A9%EC%9D%B4-%EA%B8%88%EC%A7%80%EB%90%9C-%EA%B2%BD%EC%9A%B0%EB%8A%94-%EC%96%B8%EC%A0%9C%EC%9D%BC%EA%B9%8C-09-12
This site was… how do I say it? Relevant!! Finally I’ve found something that helped me. Thank you.
https://viastoer.blogspot.com/2024/09/blog-post_30.html
https://umber-elk-dbgzh8.mystrikingly.com/blog/5
https://candid-lion-dd3cm3.mystrikingly.com/blog/9cd12105d44
https://telegra.ph/%EB%B9%84%EC%95%84%EA%B7%B8%EB%9D%BC-%EA%B5%AC%EB%A7%A4-%EC%8B%9C-%ED%95%84%EC%88%98-%EC%B2%B4%ED%81%AC%EB%A6%AC%EC%8A%A4%ED%8A%B8-10-10
https://medium.com/@1kelly76/%EC%A1%B0%EB%A3%A8%EC%99%80-%EB%B0%9C%EA%B8%B0%EB%B6%80%EC%A0%84-%EC%9E%90%EC%A1%B4%EA%B0%90%EC%9D%84-%ED%9A%8C%EB%B3%B5%ED%95%98%EB%8A%94-5%EA%B0%80%EC%A7%80-%EB%B0%A9%EB%B2%95-c0027f644e86
https://adaptable-camellia-dd3cm4.mystrikingly.com/blog/55fdb661b86
https://candid-lion-dd3cm3.mystrikingly.com/blog/8c25ae9d7a9
https://xn--kp-ro2i3ru49at1jokm7ma.mystrikingly.com/blog/50a5900f6b3
https://naveridbuy.blogspot.com/2024/12/blog-post_87.html
https://writeablog.net/jr525di7pj
https://candid-lion-dd3cm3.mystrikingly.com/blog/8c25ae9d7a9
https://hallbook.com.br/blogs/376908/%EB%84%A4%EC%9D%B4%EB%B2%84-%EC%95%84%EC%9D%B4%EB%94%94-%EA%B5%AC%EB%A7%A4-%EB%8C%80%EC%8B%A0-%EC%82%AC%EC%9A%A9%ED%95%A0-%EC%88%98-%EC%9E%88%EB%8A%94-%EB%B0%A9%EB%B2%95%EB%93%A4
https://telegra.ph/%EB%84%A4%EC%9D%B4%EB%B2%84-%EA%B3%84%EC%A0%95-%EA%B4%80%EB%A6%AC-%EB%B0%8F-%EB%8B%A4%EC%A4%91-%EC%95%84%EC%9D%B4%EB%94%94-%EC%83%9D%EC%84%B1-%EB%B0%A9%EB%B2%95-%EA%B0%80%EC%9D%B4%EB%93%9C-12-13
https://gold-gull-dd3cmf.mystrikingly.com/blog/aecd5fba094
https://naveridbuy.blogspot.com/2024/12/blog-post_29.html
https://medium.com/@carlfrancoh38793/%EA%B5%AC%EA%B8%80-%EC%95%84%EC%9D%B4%EB%94%94-%EA%B5%AC%EB%A7%A4-%EC%9D%B4%EC%A0%90%EA%B3%BC-%EB%8B%A8%EC%A0%90%EC%9D%80-%EB%AC%B4%EC%97%87%EC%9D%B8%EA%B0%80%EC%9A%94-4dccd7ee3fc1
https://medium.com/@carlfrancoh38793/%EB%84%A4%EC%9D%B4%EB%B2%84-%EC%95%84%EC%9D%B4%EB%94%94-%EA%B5%AC%EB%A7%A4-%ED%9B%84-%EC%8A%A4%EB%A7%88%ED%8A%B8%EC%8A%A4%ED%86%A0%EC%96%B4-%ED%99%9C%EC%9A%A9%EB%B2%95-2d79dbaf8605
https://naveridbuy.exblog.jp/37091323/
https://candid-lion-dd3cm3.mystrikingly.com/blog/5037f72f44c
https://telegra.ph/%EB%84%A4%EC%9D%B4%EB%B2%84-%EC%95%84%EC%9D%B4%EB%94%94-%EB%AC%B8%EC%A0%9C%EB%A5%BC-%ED%95%B4%EA%B2%B0%ED%95%98%EB%8A%94-%ED%95%A9%EB%B2%95%EC%A0%81%EC%9D%B8-%EB%B0%A9%EB%B2%95-12-13
https://naveridbuy.blogspot.com/2024/11/blog-post_3.html
https://witty-apple-dd3cm1.mystrikingly.com/blog/63d61343ce4
https://adaptable-goat-dd3cmf.mystrikingly.com/blog/ab864ad3a8f
https://medium.com/@nsw5288/%EB%B9%84%EC%95%84%EA%B7%B8%EB%9D%BC-%EA%B5%AC%EB%A7%A4-%ED%9B%84%EA%B8%B0-%EB%AA%A8%EC%9D%8C-%EC%8B%A0%EB%A2%B0%ED%95%A0-%EC%88%98-%EC%9E%88%EC%9D%84%EA%B9%8C-5dc2946813fc
https://humorous-rabbit-dbgzh6.mystrikingly.com/blog/51e35c53ec6
https://witty-apple-dd3cm1.mystrikingly.com/blog/55463079550
https://candid-lion-dd3cm3.mystrikingly.com/blog/8085327d927
https://naveridbuy.exblog.jp/37091016/
https://telegra.ph/%EB%B9%84%EC%95%84%EA%B7%B8%EB%9D%BC-%EB%B3%B5%EC%9A%A9%EC%9D%B4-%EA%B8%88%EC%A7%80%EB%90%9C-%EA%B2%BD%EC%9A%B0%EB%8A%94-%EC%96%B8%EC%A0%9C%EC%9D%BC%EA%B9%8C-09-12
https://medium.com/@nsw5288/%EB%B9%84%EC%95%84%EA%B7%B8%EB%9D%BC%EC%99%80-%ED%95%A8%EA%BB%98%EB%9D%BC%EB%A9%B4-%EC%A3%BC%EC%9D%98%ED%95%B4%EC%95%BC-%ED%95%A0-%EC%95%BD%EB%AC%BC%EB%93%A4-a3861b835e15
https://viastoer.blogspot.com/2024/09/blog-post_5.html
https://xn--w5-hd0jg6f81lm0dhhw74c.mystrikingly.com/blog/7dbe3159553
https://gwojawe-fjaow-jiao.mystrikingly.com/blog/669541f58ff
https://medium.com/@nsw5288/%EB%B9%84%EC%95%84%EA%B7%B8%EB%9D%BC-%EC%98%A8%EB%9D%BC%EC%9D%B8-%EA%B5%AC%EB%A7%A4-%EC%8B%9C-%EC%A3%BC%EC%9D%98%EC%82%AC%ED%95%AD-7eb81634b40d
https://witty-apple-dd3cm1.mystrikingly.com/blog/63d61343ce4
https://viastoer.blogspot.com/2024/09/blog-post_44.html
https://responsible-seal-dd3cm4.mystrikingly.com/blog/0f08a7ad417
https://xn--fc-hd0jg6f81ltjas9lbns.mystrikingly.com/blog/dcd84c3fc9c
https://hallbook.com.br/blogs/278115/%EB%B9%84%EC%95%84%EA%B7%B8%EB%9D%BC-%EA%B5%AC%EB%A7%A4%EC%9D%98-%EB%B2%95%EC%A0%81-%EC%82%AC%ED%95%AD%EA%B3%BC-%EA%B7%9C%EC%A0%95
https://telegra.ph/%EB%84%A4%EC%9D%B4%EB%B2%84-%EC%95%84%EC%9D%B4%EB%94%94-%EA%B5%AC%EB%A7%A4-%EB%8C%80%EC%8B%A0-%EC%82%AC%EC%9A%A9%ED%95%A0-%EC%88%98-%EC%9E%88%EB%8A%94-%EB%B0%A9%EB%B2%95%EB%93%A4-12-13
https://telegra.ph/%EB%B9%84%EC%95%84%EA%B7%B8%EB%9D%BC-%EA%B5%AC%EB%A7%A4-%EC%8B%9C-%EC%95%8C%EC%95%84%EC%95%BC-%ED%95%A0-%EC%9C%A0%EC%9D%98%EC%82%AC%ED%95%AD-7%EA%B0%80%EC%A7%80-09-20
https://naveridbuy.blogspot.com/2024/12/blog-post_27.html
https://naveridbuy.blogspot.com/2024/11/blog-post_3.html
https://medium.com/@carlfrancoh38793/%EB%84%A4%EC%9D%B4%EB%B2%84-%EC%95%84%EC%9D%B4%EB%94%94-%EA%B5%AC%EB%A7%A4-%ED%9B%84-%EA%B4%91%EA%B3%A0-%EA%B4%80%EB%A6%AC%EC%97%90-%ED%99%9C%EC%9A%A9%ED%95%98%EB%8A%94-%EB%B0%A9%EB%B2%95-6a822042a160
https://naveridbuy.exblog.jp/37090804/
https://telegra.ph/%EB%84%A4%EC%9D%B4%EB%B2%84-%EC%95%84%EC%9D%B4%EB%94%94-%EA%B1%B0%EB%9E%98%EB%8A%94-%EC%95%88%EC%A0%84%ED%95%9C%EA%B0%80-%EC%A0%84%EB%AC%B8%EA%B0%80%EC%9D%98-%EC%A1%B0%EC%96%B8-12-13
https://viastoer.blogspot.com/2024/09/blog-post_22.html
https://xn--w3-o02ik82a9kav54aokmxvc.mystrikingly.com/blog/1303baaafdb
https://naveridbuy.blogspot.com/2024/12/blog-post_82.html
https://medium.com/@carlfrancoh38793/%EB%84%A4%EC%9D%B4%EB%B2%84-%EC%95%84%EC%9D%B4%EB%94%94-%EA%B5%AC%EB%A7%A4%EB%A1%9C-%ED%95%98%EB%A3%A8-%EB%A7%8C%EC%97%90-%EC%8A%A4%EB%A7%88%ED%8A%B8%EC%8A%A4%ED%86%A0%EC%96%B4-%EA%B0%9C%EC%84%A4%ED%95%98%EA%B8%B0-439f0195fc49
Hi there! This blog post could not be written much better! Going through this post reminds me of my previous roommate! He continually kept talking about this. I’ll forward this post to him. Pretty sure he’ll have a very good read. I appreciate you for sharing!
https://witty-apple-dd3cm1.mystrikingly.com/blog/e592523ee2b
https://gold-gull-dd3cmf.mystrikingly.com/blog/277217c9c6c
https://naveridbuy.blogspot.com/2024/12/blog-post_2.html
https://candid-lion-dd3cm3.mystrikingly.com/blog/8085327d927
https://candid-lion-dd3cm3.mystrikingly.com/blog/2024
https://naveridbuy.blogspot.com/2024/12/blog-post_66.html
https://gold-gull-dd3cmf.mystrikingly.com/blog/8624dd23af4
https://bronze-lily-dbgzh7.mystrikingly.com/blog/b9f326cbd55
https://ocher-cat-dd3cmm.mystrikingly.com/blog/642842abd0f
https://naveridbuy.blogspot.com/2024/11/blog-post_28.html
https://witty-apple-dd3cm1.mystrikingly.com/blog/55463079550
https://naveridbuy.blogspot.com/2024/12/blog-post_19.html
https://witty-apple-dd3cm1.mystrikingly.com/blog/63d61343ce4
https://medium.com/@nsw5288/%EB%B9%84%EC%95%84%EA%B7%B8%EB%9D%BC-%EC%96%B8%EC%A0%9C-%EB%B3%B5%EC%9A%A9%ED%95%B4%EC%95%BC-%ED%9A%A8%EA%B3%BC%EA%B0%80-%EC%A2%8B%EC%9D%84%EA%B9%8C-12c8395a1912
https://ameblo.jp/naveridbuy/entry-12866333769.html
https://gold-gull-dd3cmf.mystrikingly.com/blog/277217c9c6c
https://naveridbuy.blogspot.com/2024/11/top-5.html
https://naveridbuy.blogspot.com/2024/11/blog-post_50.html
https://naveridbuy.blogspot.com/2024/12/blog-post_36.html
https://naveridbuy.blogspot.com/2024/12/blog-post_19.html
https://inky-owl-dd3cmv.mystrikingly.com/blog/9dacaeed43a
https://naveridbuy.exblog.jp/37152083/
https://naveridbuy.exblog.jp/37090804/
https://adaptable-camellia-dd3cm4.mystrikingly.com/blog/25f45f68c48
https://gold-gull-dd3cmf.mystrikingly.com/blog/dc52558c085
https://telegra.ph/%EB%B9%84%EC%95%84%EA%B7%B8%EB%9D%BC-%EA%B5%AC%EB%A7%A4-%EC%86%8C%EC%85%9C-%EB%AF%B8%EB%94%94%EC%96%B4%EB%A5%BC-%ED%99%9C%EC%9A%A9%ED%95%9C-%EC%A0%95%EB%B3%B4-%EC%B0%BE%EA%B8%B0-09-26
https://naveridbuy.exblog.jp/35891783/
https://medium.com/@nsw5288/%EB%B9%84%EC%95%84%EA%B7%B8%EB%9D%BC-%EC%98%A8%EB%9D%BC%EC%9D%B8-%EA%B5%AC%EB%A7%A4-%EB%B0%A9%EB%B2%95%EA%B3%BC-%EC%A3%BC%EC%9D%98-%EC%82%AC%ED%95%AD-c80ca72b0103
https://telegra.ph/%EB%84%A4%EC%9D%B4%EB%B2%84-%EC%95%84%EC%9D%B4%EB%94%94-%EA%B5%AC%EB%A7%A4%EA%B0%80-%EB%B6%88%EB%9F%AC%EC%98%A4%EB%8A%94-%EB%B3%B4%EC%95%88-%EC%9C%84%ED%97%98-12-13
https://telegra.ph/%EC%95%84%EC%9D%B4%EB%94%94-%EA%B1%B0%EB%9E%98%EC%9D%98-%EC%88%A8%EA%B2%A8%EC%A7%84-%EC%9C%84%ED%97%98-%EB%84%A4%EC%9D%B4%EB%B2%84-%EC%95%84%EC%9D%B4%EB%94%94-%EC%95%88%EC%A0%84%ED%95%98%EA%B2%8C-%EC%A7%80%ED%82%A4%EB%8A%94-%EB%B2%95-12-13
https://medium.com/@nsw5288/%EB%B9%84%EC%95%84%EA%B7%B8%EB%9D%BC-%EC%98%A8%EB%9D%BC%EC%9D%B8-%EA%B5%AC%EB%A7%A4-%EB%B0%A9%EB%B2%95%EA%B3%BC-%EC%A3%BC%EC%9D%98-%EC%82%AC%ED%95%AD-c80ca72b0103
https://naveridbuy.blogspot.com/2024/12/blog-post_76.html
https://medium.com/@carlfrancoh38793/%EB%84%A4%EC%9D%B4%EB%B2%84-%EC%B9%B4%ED%8E%98-%EC%9A%B4%EC%98%81%EC%9D%84-%EC%9C%84%ED%95%9C-%EC%95%84%EC%9D%B4%EB%94%94-%EA%B5%AC%EB%A7%A4-%ED%8C%81-eb39c3e24984
Very good information. Lucky me I recently found your site by chance (stumbleupon). I have saved it for later.
You should take part in a contest for one of the highest quality sites on the internet. I am going to highly recommend this website!
https://telegra.ph/%EB%B9%84%EC%95%84%EA%B7%B8%EB%9D%BC-%EB%B3%B5%EC%9A%A9-%ED%9B%84-%EC%A3%BC%EC%9D%98%ED%95%B4%EC%95%BC-%ED%95%A0-%EA%B1%B4%EA%B0%95-%EC%8B%A0%ED%98%B8%EB%93%A4-09-12
https://viastoer.blogspot.com/2024/10/blog-post.html
https://candid-lion-dd3cm3.mystrikingly.com/blog/5037f72f44c
https://xn--fn-hd0jg6f81ltjas9lbns.mystrikingly.com/blog/290000a8b29
Good web site you have here.. It’s hard to find excellent writing like yours nowadays. I honestly appreciate people like you! Take care!!
https://naveridbuy.exblog.jp/35891783/
https://naveridbuy.exblog.jp/35891802/
Very nice blog post. I definitely love this site. Stick with it!
https://medium.com/@carlfrancoh38793/%EB%84%A4%EC%9D%B4%EB%B2%84-%EC%95%84%EC%9D%B4%EB%94%94%EC%99%80-%EA%B4%80%EB%A0%A8%EB%90%9C-%EC%B5%9C%EC%8B%A0-%EB%B3%B4%EC%95%88-%EC%9D%B4%EC%8A%88-4569786b88d3
https://gajweor.pixnet.net/blog/post/162189406
https://gold-gull-dd3cmf.mystrikingly.com/blog/dc52558c085
https://gold-gull-dd3cmf.mystrikingly.com/blog/aecd5fba094
https://naveridbuy.exblog.jp/37091016/
https://naveridbuy.exblog.jp/37152040/
https://naveridbuy.exblog.jp/37152100/
https://naveridbuy.blogspot.com/2024/12/blog-post.html
Great article. I am experiencing a few of these issues as well..
https://hallbook.com.br/blogs/278114/%EB%B9%84%EC%95%84%EA%B7%B8%EB%9D%BC-%EA%B5%AC%EB%A7%A4-%EC%8B%9C-%EA%B3%A0%EB%A0%A4%ED%95%B4%EC%95%BC-%ED%95%A0-%EA%B0%9C%EC%9D%B8%EC%A0%81%EC%9D%B8-%EA%B1%B4%EA%B0%95-%EC%9A%94%EC%86%8C
https://writeablog.net/37n5a9w9yv
https://sociable-corn-dd3cmt.mystrikingly.com/blog/62214e87a2c
https://ko.anotepad.com/note/read/5f6b88g5
https://salmon-peach-dd3cm8.mystrikingly.com/blog/vs
Your style is really unique compared to other people I’ve read stuff from. Many thanks for posting when you’ve got the opportunity, Guess I will just bookmark this blog.
An impressive share! I have just forwarded this onto a co-worker who was conducting a little research on this. And he in fact ordered me dinner because I discovered it for him… lol. So let me reword this…. Thank YOU for the meal!! But yeah, thanx for spending some time to talk about this matter here on your web site.
https://ocher-cat-dd3cmm.mystrikingly.com/blog/f6aa48fdc0c
https://turquoise-dove-dd3cmd.mystrikingly.com/blog/e1eca45d868
https://medium.com/@1kelly76/%EB%B9%84%EC%95%84%EA%B7%B8%EB%9D%BC-%EA%B5%AC%EB%A7%A4-%EC%A0%84-%EC%96%B4%EB%96%A4-%EA%B2%83%EC%9D%84-%EA%B3%A0%EB%A0%A4%ED%95%B4%EC%95%BC-%ED%95%A0%EA%B9%8C-743d5cd4580e
https://gajweor.pixnet.net/blog/post/162317545
This website truly has all the information and facts I needed about this subject and didn’t know who to ask.
https://ameblo.jp/naveridbuy/entry-12865282919.html
https://umber-iris-dd3cm2.mystrikingly.com/blog/674c3251b7d
https://naveridbuy.blogspot.com/2024/11/blog-post_3.html
https://medium.com/@carlfrancoh38793/%EB%84%A4%EC%9D%B4%EB%B2%84-%EC%95%84%EC%9D%B4%EB%94%94-%EA%B5%AC%EB%A7%A4-%ED%9B%84-%EA%B3%84%EC%A0%95-%EB%B3%B4%ED%98%B8-%EB%B0%A9%EB%B2%95-%EC%99%84%EB%B2%BD-%EC%A0%95%EB%A6%AC-ab3a80545ed1
https://naveridbuy.blogspot.com/2024/12/blog-post_53.html
https://inky-owl-dd3cmv.mystrikingly.com/blog/570378fab9f
https://naveridbuy.exblog.jp/37152138/
https://naveridbuy.blogspot.com/2024/11/blog-post_58.html
https://gold-gull-dd3cmf.mystrikingly.com/blog/58fe76cd6ee
https://naveridbuy.blogspot.com/2024/12/blog-post_26.html
Good info. Lucky me I recently found your website by accident (stumbleupon). I’ve book-marked it for later.
https://medium.com/@carlfrancoh38793/%EB%84%A4%EC%9D%B4%EB%B2%84-%EC%95%84%EC%9D%B4%EB%94%94%EC%99%80-%EA%B4%80%EB%A0%A8%EB%90%9C-%EC%B5%9C%EC%8B%A0-%EB%B3%B4%EC%95%88-%EC%9D%B4%EC%8A%88-4569786b88d3
https://naveridbuy.blogspot.com/2024/11/top-5.html
https://hallbook.com.br/blogs/376905/%EB%84%A4%EC%9D%B4%EB%B2%84-%EC%95%84%EC%9D%B4%EB%94%94-%EC%97%86%EC%9D%B4-%EC%84%9C%EB%B9%84%EC%8A%A4-%EC%9D%B4%EC%9A%A9%ED%95%98%EB%8A%94-%ED%8C%81
https://candid-lion-dd3cm3.mystrikingly.com/blog/8c25ae9d7a9
Great information. Lucky me I ran across your blog by accident (stumbleupon). I’ve bookmarked it for later.
https://golden-grape-dd3cml.mystrikingly.com/blog/5cc22257c87
https://naveridbuy.blogspot.com/2024/12/blog-post_12.html
https://naveridbuy.blogspot.com/2024/12/blog-post_76.html
https://inky-owl-dd3cmv.mystrikingly.com/blog/9f4dcb67968
https://medium.com/@nsw5288/%EB%B9%84%EC%95%84%EA%B7%B8%EB%9D%BC-%EC%96%B8%EC%A0%9C-%EB%B3%B5%EC%9A%A9%ED%95%B4%EC%95%BC-%ED%9A%A8%EA%B3%BC%EA%B0%80-%EC%A2%8B%EC%9D%84%EA%B9%8C-12c8395a1912
I would like to thank you for the efforts you’ve put in penning this site. I really hope to see the same high-grade content from you later on as well. In truth, your creative writing abilities has motivated me to get my own blog now 😉
https://naveridbuy.blogspot.com/2024/12/blog-post_31.html
https://naveridbuy.blogspot.com/2024/11/blog-post_7.html
https://gajweor.pixnet.net/blog/post/157629283
https://maize-wombat-dd3cms.mystrikingly.com/blog/6f12963a21b
Hello there, I think your site might be having browser compatibility problems. Whenever I look at your blog in Safari, it looks fine however, when opening in Internet Explorer, it has some overlapping issues. I merely wanted to give you a quick heads up! Besides that, fantastic blog.
https://medium.com/@carlfrancoh38793/%EA%B5%AC%EA%B8%80-%EC%95%84%EC%9D%B4%EB%94%94-%EA%B5%AC%EB%A7%A4-%EC%9D%B4%EC%A0%90%EA%B3%BC-%EB%8B%A8%EC%A0%90%EC%9D%80-%EB%AC%B4%EC%97%87%EC%9D%B8%EA%B0%80%EC%9A%94-4dccd7ee3fc1
https://naveridbuy.exblog.jp/37091263/
https://naveridbuy.exblog.jp/37090861/
https://medium.com/@carlfrancoh38793/%EC%A4%91%EA%B3%A0-%EB%84%A4%EC%9D%B4%EB%B2%84-%EC%95%84%EC%9D%B4%EB%94%94%EB%A5%BC-%ED%9A%A8%EA%B3%BC%EC%A0%81%EC%9C%BC%EB%A1%9C-%ED%99%9C%EC%9A%A9%ED%95%98%EB%8A%94-%EB%B0%A9%EB%B2%95-a5bd35053073
https://medium.com/@carlfrancoh38793/%EB%84%A4%EC%9D%B4%EB%B2%84-%EC%95%84%EC%9D%B4%EB%94%94-%EA%B5%AC%EB%A7%A4-%ED%9B%84-%EA%B4%91%EA%B3%A0-%EA%B4%80%EB%A6%AC%EC%97%90-%ED%99%9C%EC%9A%A9%ED%95%98%EB%8A%94-%EB%B0%A9%EB%B2%95-6a822042a160
https://naveridbuy.blogspot.com/2024/12/blog-post_9.html
https://telegra.ph/%EB%B9%84%EC%95%84%EA%B7%B8%EB%9D%BC-%EA%B5%AC%EB%A7%A4%EB%A5%BC-%EC%9C%84%ED%95%9C-%EC%8A%A4%EB%A7%88%ED%8A%B8%ED%8F%B0-%EC%95%B1-%EC%B6%94%EC%B2%9C-09-26
https://adaptable-camellia-dd3cm4.mystrikingly.com/blog/55fdb661b86
https://medium.com/@carlfrancoh38793/%EB%84%A4%EC%9D%B4%EB%B2%84-%EC%95%84%EC%9D%B4%EB%94%94-%EC%97%B0%EB%8F%99%ED%95%9C-%EB%8B%A4%EB%A5%B8-%EC%84%9C%EB%B9%84%EC%8A%A4-%ED%99%9C%EC%9A%A9%EB%B2%95-5dde0d66c6f6
https://hallbook.com.br/blogs/376903/%EB%84%A4%EC%9D%B4%EB%B2%84-%EC%95%84%EC%9D%B4%EB%94%94-%EA%B1%B0%EB%9E%98%EB%8A%94-%EC%95%88%EC%A0%84%ED%95%9C%EA%B0%80-%EC%A0%84%EB%AC%B8%EA%B0%80%EC%9D%98-%EC%A1%B0%EC%96%B8
https://inky-owl-dd3cmv.mystrikingly.com/blog/1f98f73959a
https://naveridbuy.exblog.jp/35891806/
https://telegra.ph/%EB%B9%84%EC%95%84%EA%B7%B8%EB%9D%BC-%EA%B5%AC%EB%A7%A4%EB%A5%BC-%EC%9C%84%ED%95%9C-%EC%8A%A4%EB%A7%88%ED%8A%B8%ED%8F%B0-%EC%95%B1-%EC%B6%94%EC%B2%9C-09-26
https://gajweor.pixnet.net/blog/post/162874255
Greetings! Very helpful advice within this post! It is the little changes that will make the biggest changes. Thanks for sharing!
https://umber-iris-dd3cm2.mystrikingly.com/blog/9e5d9a0e4a7
https://grape-pear-dbgzh0.mystrikingly.com/blog/48ea9f72e99
https://candid-lion-dd3cm3.mystrikingly.com/blog/7114981bc76
https://candid-lion-dd3cm3.mystrikingly.com/blog/7114981bc76
https://gold-gull-dd3cmf.mystrikingly.com/blog/809bdcf69a1
https://medium.com/@carlfrancoh38793/%EC%95%84%EC%9D%B4%EB%94%94-%EC%A4%91%EB%B3%B5-%EB%AC%B8%EC%A0%9C-%ED%95%B4%EA%B2%B0-%EB%84%A4%EC%9D%B4%EB%B2%84-%EC%95%84%EC%9D%B4%EB%94%94-%EA%B5%AC%EB%A7%A4-%ED%99%9C%EC%9A%A9%EB%B2%95-a0ec8344a6bd
https://naveridbuy.blogspot.com/2024/12/blog-post_12.html
https://naveridbuy.blogspot.com/2024/11/5.html
https://medium.com/@carlfrancoh38793/%EB%B9%A0%EB%A5%B4%EA%B2%8C-%EC%8B%9C%EC%9E%91%ED%95%98%EB%8A%94-%EB%84%A4%EC%9D%B4%EB%B2%84-%EC%95%84%EC%9D%B4%EB%94%94-%EA%B5%AC%EB%A7%A4-%ED%99%9C%EC%9A%A9%EB%B2%95-e4a7bf2e3c57
https://medium.com/@carlfrancoh38793/%EB%84%A4%EC%9D%B4%EB%B2%84-%EC%95%84%EC%9D%B4%EB%94%94%EA%B0%80-%ED%95%84%EC%9A%94%ED%95%A0-%EB%95%8C-%EA%B5%AC%EB%A7%A4%EA%B0%80-%EB%8B%B5%EC%9D%BC%EA%B9%8C-4bbacce4d7df
https://adaptable-camellia-dd3cm4.mystrikingly.com/blog/55fdb661b86
https://naveridbuy.exblog.jp/37091016/
https://adaptable-camellia-dd3cm4.mystrikingly.com/blog/25f45f68c48
https://naveridbuy.blogspot.com/2024/11/blog-post_50.html
https://naveridbuy.blogspot.com/2024/11/2024.html
https://medium.com/@carlfrancoh38793/%EB%84%A4%EC%9D%B4%EB%B2%84-%EC%95%84%EC%9D%B4%EB%94%94-%EA%B5%AC%EB%A7%A4-%EC%88%A8%EA%B2%A8%EC%A7%84-%EC%A7%84%EC%8B%A4%EC%9D%84-%ED%8C%8C%ED%97%A4%EC%B3%90%EB%B4%A4%EC%8A%B5%EB%8B%88%EB%8B%A4-ad07e5d2c8d7
Pretty! This has been a really wonderful article. Thank you for supplying this information.
https://medium.com/@carlfrancoh38793/%EB%84%A4%EC%9D%B4%EB%B2%84-%EC%95%84%EC%9D%B4%EB%94%94%EC%99%80-%EA%B4%80%EB%A0%A8%EB%90%9C-%EC%B5%9C%EC%8B%A0-%EB%B3%B4%EC%95%88-%EC%9D%B4%EC%8A%88-4569786b88d3
https://telegra.ph/%EC%95%84%EC%9D%B4%EB%94%94-%EA%B1%B0%EB%9E%98%EC%9D%98-%EC%88%A8%EA%B2%A8%EC%A7%84-%EC%9C%84%ED%97%98-%EB%84%A4%EC%9D%B4%EB%B2%84-%EC%95%84%EC%9D%B4%EB%94%94-%EC%95%88%EC%A0%84%ED%95%98%EA%B2%8C-%EC%A7%80%ED%82%A4%EB%8A%94-%EB%B2%95-12-13
https://naveridbuy.blogspot.com/2024/11/blog-post_58.html
https://ameblo.jp/naveridbuy/entry-12865283090.html
https://xn--lq-o02ik82aiqcqsko8mfg5a1sb.mystrikingly.com/blog/b10ad28d131
https://ko.anotepad.com/note/read/ekdmqg4x
https://medium.com/@nsw5288/%EB%B0%9C%EA%B8%B0%EB%B6%80%EC%A0%84%EA%B3%BC-%EC%A1%B0%EB%A3%A8-%EC%89%BD%EA%B2%8C-%EC%9D%B4%ED%95%B4%ED%95%98%EA%B3%A0-%EA%B7%B9%EB%B3%B5%ED%95%98%EB%8A%94-%EB%B2%95-5212fd7c4fa0
Excellent article. I will be experiencing some of these issues as well..
Very interesting topic, thank you for posting. “The deepest American dream is not the hunger for money or fame it is the dream of settling down, in peace and freedom and cooperation, in the promised land.” by Scott Russell Sanders..
Excellent post. I’m dealing with some of these issues as well..
https://medium.com/@1kelly76/%EC%A1%B0%EB%A3%A8%EB%A1%9C-%EC%9D%B8%ED%95%9C-%EA%B3%A0%EB%AF%BC-%ED%95%B4%EA%B2%B0%EC%B1%85%EC%9D%80-%EB%AC%B4%EC%97%87%EC%9D%BC%EA%B9%8C-7fbd3a7a1e9b
https://inky-owl-dd3cmv.mystrikingly.com/blog/570378fab9f
https://naveridbuy.blogspot.com/2024/12/blog-post_6.html
https://hallbook.com.br/blogs/376898/%EB%84%A4%EC%9D%B4%EB%B2%84-%EC%95%84%EC%9D%B4%EB%94%94-%EA%B5%AC%EB%A7%A4%EA%B0%80-%EB%B6%88%EB%9F%AC%EC%98%A4%EB%8A%94-%EB%B3%B4%EC%95%88-%EC%9C%84%ED%97%98
After checking out a number of the articles on your blog, I seriously like your way of blogging. I saved as a favorite it to my bookmark website list and will be checking back in the near future. Please visit my web site as well and let me know what you think.
https://naveridbuy.exblog.jp/37090971/
https://naveridbuy.blogspot.com/2024/11/blog-post_28.html
https://medium.com/@carlfrancoh38793/%EB%84%A4%EC%9D%B4%EB%B2%84-%EC%95%84%EC%9D%B4%EB%94%94%EA%B0%80-%ED%95%84%EC%9A%94%ED%95%A0-%EB%95%8C-%EA%B5%AC%EB%A7%A4%EA%B0%80-%EB%8B%B5%EC%9D%BC%EA%B9%8C-4bbacce4d7df
https://salmon-peach-dd3cm8.mystrikingly.com/blog/dbd2b0155cb
https://medium.com/@carlfrancoh38793/%EB%84%A4%EC%9D%B4%EB%B2%84-%EC%95%84%EC%9D%B4%EB%94%94%EC%99%80-%EA%B4%80%EB%A0%A8%EB%90%9C-%EC%B5%9C%EC%8B%A0-%EB%B3%B4%EC%95%88-%EC%9D%B4%EC%8A%88-4569786b88d3
Great info. Lucky me I ran across your blog by accident (stumbleupon). I’ve saved it for later.
https://telegra.ph/%EC%95%84%EC%9D%B4%EB%94%94-%EA%B1%B0%EB%9E%98%EC%9D%98-%EC%88%A8%EA%B2%A8%EC%A7%84-%EC%9C%84%ED%97%98-%EB%84%A4%EC%9D%B4%EB%B2%84-%EC%95%84%EC%9D%B4%EB%94%94-%EC%95%88%EC%A0%84%ED%95%98%EA%B2%8C-%EC%A7%80%ED%82%A4%EB%8A%94-%EB%B2%95-12-13
https://writeablog.net/37n5a9w9yv
https://medium.com/@carlfrancoh38793/%EC%A4%91%EA%B3%A0-%EB%84%A4%EC%9D%B4%EB%B2%84-%EC%95%84%EC%9D%B4%EB%94%94%EB%A5%BC-%ED%9A%A8%EA%B3%BC%EC%A0%81%EC%9C%BC%EB%A1%9C-%ED%99%9C%EC%9A%A9%ED%95%98%EB%8A%94-%EB%B0%A9%EB%B2%95-a5bd35053073
https://inky-owl-dd3cmv.mystrikingly.com/blog/f111c3c7d0d
https://candid-lion-dd3cm3.mystrikingly.com/blog/53469580831
https://medium.com/@carlfrancoh38793/%EB%84%A4%EC%9D%B4%EB%B2%84-%EC%95%84%EC%9D%B4%EB%94%94-%EA%B5%AC%EB%A7%A4%EA%B0%80-%EC%9D%B8%EA%B8%B0-%EC%9E%88%EB%8A%94-%EC%9D%B4%EC%9C%A0%EB%A5%BC-%EC%95%8C%EC%95%84%EB%B3%B4%EC%9E%90-854637610dd2
Is this a new post? i ask because i think i read the same article a month ago on hubpages.
I adore your website.. excellent colours & theme. Did an individual design this site oneself or maybe have you actually rely on someone else to do it for you personally? Plz answer while I!|m planning to design and style my very own blog site as well as want to learn where by u became this specific through. thanks
https://salmon-peach-dd3cm8.mystrikingly.com/blog/5ebd4cee1f6
https://ko.anotepad.com/note/read/pymsgn44
https://naveridbuy.blogspot.com/2024/11/blog-post_7.html
https://candid-lion-dd3cm3.mystrikingly.com/blog/7114981bc76
https://medium.com/@carlfrancoh38793/%EB%84%A4%EC%9D%B4%EB%B2%84-%EC%95%84%EC%9D%B4%EB%94%94-%EA%B5%AC%EB%A7%A4-%ED%95%A9%EB%B2%95%EC%9D%B8%EA%B0%80%EC%9A%94-%EC%95%8C%EC%95%84%EB%B4%85%EC%8B%9C%EB%8B%A4-40dff2b624f5
https://candid-lion-dd3cm3.mystrikingly.com/blog/b99e214c11a
https://medium.com/@carlfrancoh38793/%EB%84%A4%EC%9D%B4%EB%B2%84-%EC%B9%B4%ED%8E%98-%EC%9A%B4%EC%98%81%EC%9D%84-%EC%9C%84%ED%95%9C-%EC%95%84%EC%9D%B4%EB%94%94-%EA%B5%AC%EB%A7%A4-%ED%8C%81-eb39c3e24984
I blog quite often and I really thank you for your information. The article has truly peaked my interest. I am going to book mark your website and keep checking for new information about once a week. I opted in for your Feed as well.
https://telegra.ph/%EB%84%A4%EC%9D%B4%EB%B2%84-%EC%95%84%EC%9D%B4%EB%94%94-%EA%B1%B0%EB%9E%98%EB%8A%94-%EC%95%88%EC%A0%84%ED%95%9C%EA%B0%80-%EC%A0%84%EB%AC%B8%EA%B0%80%EC%9D%98-%EC%A1%B0%EC%96%B8-12-13
https://ameblo.jp/naveridbuy/entry-12866333999.html
https://xn--w0-hd0jg6f81lm0dhhw74c.mystrikingly.com/blog/2ea87cc6ee1
I’m impressed, I must say. Seldom do I come across a blog that’s equally educative and interesting, and without a doubt, you’ve hit the nail on the head. The problem is something which not enough people are speaking intelligently about. Now i’m very happy that I found this in my search for something regarding this.
Hey There. I found your blog using msn. This is an extremely well written article. I’ll be sure to bookmark it and return to read more of your useful information. Thanks for the post. I’ll definitely comeback.
https://inky-owl-dd3cmv.mystrikingly.com/blog/f111c3c7d0d
https://wise-onion-dbgzhg.mystrikingly.com/blog/58f918f70c9
https://hallbook.com.br/blogs/326299/%EB%B9%84%EC%95%84%EA%B7%B8%EB%9D%BC-%EA%B5%AC%EB%A7%A4-%EC%8B%9C-%ED%95%84%EC%88%98-%EC%B2%B4%ED%81%AC%EB%A6%AC%EC%8A%A4%ED%8A%B8
Spot on with this write-up, I really suppose this website needs much more consideration. probably be once more to learn way more, thanks for that info.
I really like reading a post that can make people think. Also, thanks for permitting me to comment.
https://telegra.ph/%EB%84%A4%EC%9D%B4%EB%B2%84-%EA%B3%84%EC%A0%95-%EA%B4%80%EB%A6%AC-%EB%B0%8F-%EB%8B%A4%EC%A4%91-%EC%95%84%EC%9D%B4%EB%94%94-%EC%83%9D%EC%84%B1-%EB%B0%A9%EB%B2%95-%EA%B0%80%EC%9D%B4%EB%93%9C-12-13
https://adaptable-goat-dd3cmf.mystrikingly.com/blog/a69238eac25
https://viastoer.blogspot.com/2024/07/blog-post_92.html
https://candid-lion-dd3cm3.mystrikingly.com/blog/8c25ae9d7a9
https://inky-owl-dd3cmv.mystrikingly.com/blog/570378fab9f
https://telegra.ph/%EB%84%A4%EC%9D%B4%EB%B2%84-%EC%95%84%EC%9D%B4%EB%94%94-%EA%B5%AC%EB%A7%A4-%EC%A0%95%EB%A7%90-%EC%95%88%EC%A0%84%ED%95%A0%EA%B9%8C-12-13
https://writeablog.net/jr525di7pj
https://medium.com/@1kelly76/%EC%A1%B0%EB%A3%A8%EB%A1%9C-%EC%9D%B8%ED%95%9C-%EA%B3%A0%EB%AF%BC-%ED%95%B4%EA%B2%B0%EC%B1%85%EC%9D%80-%EB%AC%B4%EC%97%87%EC%9D%BC%EA%B9%8C-7fbd3a7a1e9b
https://ko.anotepad.com/note/read/w8ms52pm
https://medium.com/@carlfrancoh38793/%EA%B5%AC%EA%B8%80-%EC%95%84%EC%9D%B4%EB%94%94-%EA%B5%AC%EB%A7%A4-%EC%9D%B4%EC%A0%90%EA%B3%BC-%EB%8B%A8%EC%A0%90%EC%9D%80-%EB%AC%B4%EC%97%87%EC%9D%B8%EA%B0%80%EC%9A%94-4dccd7ee3fc1
https://viastoer.blogspot.com/2024/09/blog-post_40.html
https://medium.com/@nsw5288/%EB%B9%84%EC%95%84%EA%B7%B8%EB%9D%BC-%EA%B5%AC%EB%A7%A4%EB%A5%BC-%EC%9C%84%ED%95%9C-%EC%A0%84%EB%AC%B8%EA%B0%80-%EC%A1%B0%EC%96%B8%EA%B3%BC-%EC%B6%94%EC%B2%9C-2c569666f79f
https://ko.anotepad.com/note/read/5fkx4w7q
https://viastoer.blogspot.com/2024/09/blog-post_31.html
https://medium.com/@charlielevesque328/%EB%B9%84%EC%95%84%EA%B7%B8%EB%9D%BC-%EC%98%A8%EB%9D%BC%EC%9D%B8-%EA%B5%AC%EB%A7%A4-%ED%9B%84%EA%B8%B0%EC%99%80-%EC%A3%BC%EC%9D%98%ED%95%B4%EC%95%BC-%ED%95%A0-%EC%A0%90%EB%93%A4-4a51bcd6c007
https://viastoer.blogspot.com/2024/09/blog-post_27.html
https://medium.com/@1kelly76/%EC%A1%B0%EB%A3%A8%EB%A1%9C-%EC%9D%B8%ED%95%9C-%EA%B3%A0%EB%AF%BC-%ED%95%B4%EA%B2%B0%EC%B1%85%EC%9D%80-%EB%AC%B4%EC%97%87%EC%9D%BC%EA%B9%8C-7fbd3a7a1e9b
I like it when individuals get together and share thoughts. Great website, stick with it.
https://naveridbuy.blogspot.com/2024/12/blog-post_26.html
https://naveridbuy.exblog.jp/37152100/
https://medium.com/@carlfrancoh38793/%EC%95%84%EC%9D%B4%EB%94%94-%EC%83%9D%EC%84%B1-%EC%96%B4%EB%A0%A4%EC%9A%B8-%EB%95%8C-%EA%B5%AC%EB%A7%A4-%EB%8C%80%EC%95%88-%EC%95%8C%EC%95%84%EB%B3%B4%EA%B8%B0-62055e09b46c
https://naveridbuy.blogspot.com/2024/12/blog-post_37.html
https://naveridbuy.exblog.jp/37152040/
Hi mate, .This was an excellent page for such a complicated topic to talk about. I look forward to reading many more excellent posts like this one. Thanks
There are a handful of intriguing points with time in this article but I do not determine if them all center to heart. There is certainly some validity but I’m going to take hold opinion until I explore it further. Good post , thanks therefore we want much more! Combined with FeedBurner at the same time
https://gold-gull-dd3cmf.mystrikingly.com/blog/0168a471da6
https://naveridbuy.blogspot.com/2024/11/blog-post_58.html
I really like looking through an article that can make men and women think. Also, many thanks for permitting me to comment.
https://gray-begonia-dbgzhf.mystrikingly.com/blog/vs
https://gold-gull-dd3cmf.mystrikingly.com/blog/aecd5fba094
https://medium.com/@carlfrancoh38793/%EB%84%A4%EC%9D%B4%EB%B2%84-%EC%95%84%EC%9D%B4%EB%94%94-%EA%B5%AC%EB%A7%A4-%EA%B3%BC%EC%97%B0-%EB%8F%88%EA%B0%92%EC%9D%84-%ED%95%A0%EA%B9%8C-d89a0fd7d3c4
I have to thank you for the efforts you have put in penning this site. I really hope to see the same high-grade blog posts from you in the future as well. In fact, your creative writing abilities has motivated me to get my own, personal blog now 😉
https://lavender-fox-dbgzhq.mystrikingly.com/blog/308610f20f9
https://medium.com/@carlfrancoh38793/%EB%B9%A0%EB%A5%B4%EA%B2%8C-%EC%8B%9C%EC%9E%91%ED%95%98%EB%8A%94-%EB%84%A4%EC%9D%B4%EB%B2%84-%EC%95%84%EC%9D%B4%EB%94%94-%EA%B5%AC%EB%A7%A4-%ED%99%9C%EC%9A%A9%EB%B2%95-e4a7bf2e3c57
https://naveridbuy.exblog.jp/37152158/
https://naveridbuy.blogspot.com/2024/12/blog-post_76.html
https://witty-apple-dd3cm1.mystrikingly.com/blog/5dbde675bb4
https://inky-owl-dd3cmv.mystrikingly.com/blog/9f4dcb67968
https://medium.com/@charlielevesque328/%EB%B9%84%EC%95%84%EA%B7%B8%EB%9D%BC-%EC%A0%95%ED%92%88-%EA%B5%AC%EB%A7%A4-%EB%B0%A9%EB%B2%95-%EC%A0%88%EB%8C%80-%ED%94%BC%ED%95%B4-%EA%B0%88-%EC%88%98-%EC%97%86%EB%8A%94-%ED%8C%81-fa1227859fd6
https://adaptable-camellia-dd3cm4.mystrikingly.com/blog/70aed56e7e8
https://writeablog.net/qmceliv4q8
https://umber-elk-dbgzh8.mystrikingly.com/blog/5
https://medium.com/@nsw5288/%EB%B9%84%EC%95%84%EA%B7%B8%EB%9D%BC-%EB%B3%B5%EC%9A%A9-%EC%A0%84-%EC%95%8C%EC%95%84%EB%91%90%EC%96%B4%EC%95%BC-%ED%95%A0-%ED%95%84%EC%88%98-%EC%82%AC%ED%95%AD-abfee13fa3fb
Hey there, You’ve done a great job. I’ll definitely digg it and personally suggest to my friends. I am confident they will be benefited from this site.
It’s difficult to find knowledgeable people on this topic, however, you sound like you know what you’re talking about! Thanks
Many thanks for the fantastic post C I’d fun reading it! That i love this blog.
https://naveridbuy.exblog.jp/37091209/
https://medium.com/@carlfrancoh38793/%EB%B9%A0%EB%A5%B4%EA%B2%8C-%EC%8B%9C%EC%9E%91%ED%95%98%EB%8A%94-%EB%84%A4%EC%9D%B4%EB%B2%84-%EC%95%84%EC%9D%B4%EB%94%94-%EA%B5%AC%EB%A7%A4-%ED%99%9C%EC%9A%A9%EB%B2%95-e4a7bf2e3c57
https://inky-owl-dd3cmv.mystrikingly.com/blog/8b5f29aef6c
https://medium.com/@carlfrancoh38793/%EB%84%A4%EC%9D%B4%EB%B2%84-%EC%95%84%EC%9D%B4%EB%94%94-%EC%97%B0%EB%8F%99%ED%95%9C-%EB%8B%A4%EB%A5%B8-%EC%84%9C%EB%B9%84%EC%8A%A4-%ED%99%9C%EC%9A%A9%EB%B2%95-5dde0d66c6f6
https://candid-lion-dd3cm3.mystrikingly.com/blog/b99e214c11a
It is the best time to make some plans for the future and it’s time to be happy. I have read this post and if I could I want to suggest you some interesting things or suggestions. Maybe you can write next articles referring to this article. I desire to read more things about it!
https://telegra.ph/%EB%84%A4%EC%9D%B4%EB%B2%84-%EC%95%84%EC%9D%B4%EB%94%94-%EA%B5%AC%EB%A7%A4-%ED%9B%84-%EA%B3%84%EC%A0%95-%EC%A0%95%EC%A7%80-%EC%82%AC%EB%A1%80%EC%99%80-%EB%8C%80%EC%B2%98%EB%B2%95-12-13
https://umber-iris-dd3cm2.mystrikingly.com/blog/d88d507a5ee
https://naveridbuy.exblog.jp/35659159/
https://xn--fc-hd0jg6f81ltjas9lbns.mystrikingly.com/blog/dcd84c3fc9c
https://telegra.ph/%EB%84%A4%EC%9D%B4%EB%B2%84-%EC%95%84%EC%9D%B4%EB%94%94-%EB%AC%B8%EC%A0%9C%EB%A5%BC-%ED%95%B4%EA%B2%B0%ED%95%98%EB%8A%94-%ED%95%A9%EB%B2%95%EC%A0%81%EC%9D%B8-%EB%B0%A9%EB%B2%95-12-13
Greetings! Very helpful advice in this particular article! It is the little changes that will make the largest changes. Thanks for sharing!
https://naveridbuy.exblog.jp/37091263/
There is definately a great deal to learn about this issue. I like all the points you’ve made.
https://inky-owl-dd3cmv.mystrikingly.com/blog/1f98f73959a
https://candid-lion-dd3cm3.mystrikingly.com/blog/7114981bc76
https://naveridbuy.exblog.jp/37152070/
https://candid-lion-dd3cm3.mystrikingly.com/blog/6f5ea7ec9c8
https://gold-gull-dd3cmf.mystrikingly.com/blog/aecd5fba094
https://naveridbuy.blogspot.com/2024/11/5_28.html
https://ameblo.jp/naveridbuy/entry-12865283090.html
https://salmon-peach-dd3cm8.mystrikingly.com/blog/vs
https://medium.com/@nsw5288/%EB%B9%84%EC%95%84%EA%B7%B8%EB%9D%BC-%EA%B0%99%EC%9D%B4-%EB%A8%B9%EC%9C%BC%EB%A9%B4-%EC%95%88%EB%90%98%EB%8A%94-%EC%95%BD-e6a7bb6e99ff
https://ko.anotepad.com/note/read/a87w92ab
https://medium.com/@nsw5288/%EB%B9%84%EC%95%84%EA%B7%B8%EB%9D%BC-%EC%98%A8%EB%9D%BC%EC%9D%B8-%EA%B5%AC%EB%A7%A4-%EB%B0%A9%EB%B2%95%EA%B3%BC-%EC%A3%BC%EC%9D%98-%EC%82%AC%ED%95%AD-c80ca72b0103
https://medium.com/@nsw5288/%EB%B9%84%EC%95%84%EA%B7%B8%EB%9D%BC-%EC%96%B8%EC%A0%9C-%EB%B3%B5%EC%9A%A9%ED%95%B4%EC%95%BC-%ED%9A%A8%EA%B3%BC%EA%B0%80-%EC%A2%8B%EC%9D%84%EA%B9%8C-12c8395a1912
Oh my goodness! Amazing article dude! Thank you so much, However I am going through troubles with your RSS. I don’t understand the reason why I cannot join it. Is there anybody getting identical RSS problems? Anybody who knows the solution will you kindly respond? Thanx.
https://humorous-rabbit-dbgzh6.mystrikingly.com/blog/51e35c53ec6
https://candid-lion-dd3cm3.mystrikingly.com/blog/9cd12105d44
https://naveridbuy.blogspot.com/2024/11/5.html
https://candid-lion-dd3cm3.mystrikingly.com/blog/8c25ae9d7a9
https://naveridbuy.exblog.jp/37091016/
https://candid-lion-dd3cm3.mystrikingly.com/blog/6f5ea7ec9c8
https://telegra.ph/%EB%84%A4%EC%9D%B4%EB%B2%84-%EC%95%84%EC%9D%B4%EB%94%94-%EA%B5%AC%EB%A7%A4-%EC%A0%95%EB%A7%90-%EC%95%88%EC%A0%84%ED%95%A0%EA%B9%8C-12-13
https://naveridbuy.exblog.jp/37090971/
https://naveridbuy.blogspot.com/2024/12/blog-post_37.html
https://medium.com/@carlfrancoh38793/%EC%95%84%EC%9D%B4%EB%94%94-%EC%83%9D%EC%84%B1-%EC%96%B4%EB%A0%A4%EC%9A%B8-%EB%95%8C-%EA%B5%AC%EB%A7%A4-%EB%8C%80%EC%95%88-%EC%95%8C%EC%95%84%EB%B3%B4%EA%B8%B0-62055e09b46c
https://viastoer.blogspot.com/2024/09/blog-post_70.html
It’s hard to come by knowledgeable people in this particular topic, however, you sound like you know what you’re talking about! Thanks
https://medium.com/@nsw5288/%EB%B9%84%EC%95%84%EA%B7%B8%EB%9D%BC-%EA%B5%AC%EB%A7%A4-%EC%8B%9C-%EC%A0%95%ED%92%88%EC%9D%84-%EC%B0%BE%EB%8A%94-%EA%BF%80%ED%8C%81-3b70adbbe6e9
https://viastoer.blogspot.com/2024/09/blog-post_82.html
https://naveridbuy.blogspot.com/2024/12/blog-post_52.html
https://inky-owl-dd3cmv.mystrikingly.com/blog/e5d41afa610
https://mustard-yucca-dbgzh7.mystrikingly.com/blog/d934217294a
Spot on with this write-up, I seriously believe this web site needs a great deal more attention. I’ll probably be back again to see more, thanks for the information.
https://ko.anotepad.com/note/read/ekdmqg4x
https://tawny-wombat-dd3cmn.mystrikingly.com/blog/cfa45d0871d
https://inky-owl-dd3cmv.mystrikingly.com/blog/8b5f29aef6c
https://naveridbuy.exblog.jp/37152158/
https://naveridbuy.blogspot.com/2024/12/blog-post_53.html
https://witty-apple-dd3cm1.mystrikingly.com/blog/3bd399012aa
https://writeablog.net/mqcuo9vdox
Greetings! Very helpful advice in this particular post! It’s the little changes which will make the most important changes. Thanks a lot for sharing!
https://naveridbuy.blogspot.com/2024/11/2024.html
https://medium.com/@carlfrancoh38793/%EB%84%A4%EC%9D%B4%EB%B2%84-%EC%B9%B4%ED%8E%98-%EC%9A%B4%EC%98%81%EC%9D%84-%EC%9C%84%ED%95%9C-%EC%95%84%EC%9D%B4%EB%94%94-%EA%B5%AC%EB%A7%A4-%ED%8C%81-eb39c3e24984
https://zippy-tomato-dbgzhv.mystrikingly.com/blog/b0c4e583f8a
https://hallbook.com.br/blogs/295250/%EB%B0%9C%EA%B8%B0%EB%B6%80%EC%A0%84%EA%B3%BC-%EC%A1%B0%EB%A3%A8-%EC%9E%90%EC%97%B0-%EC%B9%98%EB%A3%8C%EC%99%80-%EC%9D%98%ED%95%99%EC%A0%81-%EC%A0%91%EA%B7%BC%EB%B2%95-%EB%B9%84%EA%B5%90
https://naveridbuy.blogspot.com/2024/11/top-5.html
https://writeablog.net/bzmd5ls4rc
https://candid-lion-dd3cm3.mystrikingly.com/blog/8085327d927
https://medium.com/@carlfrancoh38793/%EC%A4%91%EA%B3%A0-%EB%84%A4%EC%9D%B4%EB%B2%84-%EC%95%84%EC%9D%B4%EB%94%94%EB%A5%BC-%ED%9A%A8%EA%B3%BC%EC%A0%81%EC%9C%BC%EB%A1%9C-%ED%99%9C%EC%9A%A9%ED%95%98%EB%8A%94-%EB%B0%A9%EB%B2%95-a5bd35053073
https://ko.anotepad.com/note/read/wp2754d5
Wonderful post! We will be linking to this particularly great article on our website. Keep up the great writing.
https://gold-gull-dd3cmf.mystrikingly.com/blog/277217c9c6c
https://naveridbuy.exblog.jp/37090861/
https://viastoer.blogspot.com/2024/08/blog-post_11.html
https://salmon-peach-dd3cm8.mystrikingly.com/blog/faf9fda7a2f
https://amicable-sparrow-dbgzhp.mystrikingly.com/blog/961b7576835
https://gajweor.pixnet.net/blog/post/157629580
https://witty-apple-dd3cm1.mystrikingly.com/blog/7e37e3ff366
https://gajweor.pixnet.net/blog/post/162316639
https://medium.com/@nsw5288/%EB%B9%84%EC%95%84%EA%B7%B8%EB%9D%BC-%EC%98%A8%EB%9D%BC%EC%9D%B8-%EA%B5%AC%EB%A7%A4-%EC%8B%9C-%EC%A3%BC%EC%9D%98%EC%82%AC%ED%95%AD-7eb81634b40d
https://telegra.ph/%EB%B9%84%EC%95%84%EA%B7%B8%EB%9D%BC-%EC%98%A8%EB%9D%BC%EC%9D%B8-%EA%B5%AC%EB%A7%A4-%ED%9B%84%EA%B8%B0%EC%99%80-%EC%A3%BC%EC%9D%98%ED%95%B4%EC%95%BC-%ED%95%A0-%EC%A0%90%EB%93%A4-09-20
https://telegra.ph/%EB%B9%84%EC%95%84%EA%B7%B8%EB%9D%BC%EC%9D%98-%ED%9A%A8%EA%B3%BC%EB%A5%BC-%EA%B7%B9%EB%8C%80%ED%99%94%ED%95%98%EB%8A%94-%EB%B0%A9%EB%B2%95-09-12
Your style is so unique in comparison to other folks I’ve read stuff from. Thank you for posting when you’ve got the opportunity, Guess I’ll just bookmark this page.
https://telegra.ph/%EB%B9%84%EC%95%84%EA%B7%B8%EB%9D%BC-%ED%9A%A8%EA%B3%BC%EC%99%80-%EA%B5%AC%EB%A7%A4-%EC%8B%9C-%EC%A3%BC%EC%9D%98%EC%82%AC%ED%95%AD-%EC%B4%9D%EC%A0%95%EB%A6%AC-09-20
https://xn--w7-o02ik82a9kav54aokmxvc.mystrikingly.com/blog/f25b35e17ac
https://adaptable-camellia-dd3cm4.mystrikingly.com/blog/70aed56e7e8
https://viastoer.blogspot.com/2024/09/blog-post_61.html
https://crimson-elephant-dbgzh3.mystrikingly.com/blog/a1467ba1967
https://witty-apple-dd3cm1.mystrikingly.com/blog/6e9742ef068
https://hallbook.com.br/blogs/313009/%EB%B9%84%EC%95%84%EA%B7%B8%EB%9D%BC%EC%9D%98-%EB%B6%80%EC%9E%91%EC%9A%A9%EA%B3%BC-%EC%95%88%EC%A0%84%ED%95%9C-%EB%B3%B5%EC%9A%A9%EB%B2%95
https://tawny-wombat-dd3cmn.mystrikingly.com/blog/cfa45d0871d
Having read this I thought it was rather informative. I appreciate you finding the time and effort to put this informative article together. I once again find myself spending a significant amount of time both reading and posting comments. But so what, it was still worth it!
https://ameblo.jp/naveridbuy/entry-12866334219.html
https://hallbook.com.br/blogs/376903/%EB%84%A4%EC%9D%B4%EB%B2%84-%EC%95%84%EC%9D%B4%EB%94%94-%EA%B1%B0%EB%9E%98%EB%8A%94-%EC%95%88%EC%A0%84%ED%95%9C%EA%B0%80-%EC%A0%84%EB%AC%B8%EA%B0%80%EC%9D%98-%EC%A1%B0%EC%96%B8
https://medium.com/@carlfrancoh38793/%EB%84%A4%EC%9D%B4%EB%B2%84-%EC%95%84%EC%9D%B4%EB%94%94-%EA%B5%AC%EB%A7%A4%EB%A1%9C-%ED%95%98%EB%A3%A8-%EB%A7%8C%EC%97%90-%EC%8A%A4%EB%A7%88%ED%8A%B8%EC%8A%A4%ED%86%A0%EC%96%B4-%EA%B0%9C%EC%84%A4%ED%95%98%EA%B8%B0-439f0195fc49
https://naveridbuy.exblog.jp/37090971/
https://medium.com/@carlfrancoh38793/%EB%84%A4%EC%9D%B4%EB%B2%84-%EC%95%84%EC%9D%B4%EB%94%94%EA%B0%80-%ED%95%84%EC%9A%94%ED%95%A0-%EB%95%8C-%EA%B5%AC%EB%A7%A4%EA%B0%80-%EB%8B%B5%EC%9D%BC%EA%B9%8C-4bbacce4d7df
https://telegra.ph/%EB%84%A4%EC%9D%B4%EB%B2%84-%EC%95%84%EC%9D%B4%EB%94%94-%EA%B5%AC%EB%A7%A4-%EC%A0%95%EB%A7%90-%EC%95%88%EC%A0%84%ED%95%A0%EA%B9%8C-12-13
https://witty-apple-dd3cm1.mystrikingly.com/blog/bf0bc875058
This is a great tip particularly to those fresh to the blogosphere. Brief but very precise information… Many thanks for sharing this one. A must read article.
https://viastoer.blogspot.com/2024/09/blog-post_70.html
https://hallbook.com.br/blogs/278115/%EB%B9%84%EC%95%84%EA%B7%B8%EB%9D%BC-%EA%B5%AC%EB%A7%A4%EC%9D%98-%EB%B2%95%EC%A0%81-%EC%82%AC%ED%95%AD%EA%B3%BC-%EA%B7%9C%EC%A0%95
https://ameblo.jp/naveridbuy/entry-12860974446.html
https://medium.com/@nsw5288/%EB%B9%84%EC%95%84%EA%B7%B8%EB%9D%BC%EC%99%80-%EB%B9%84%EC%8A%B7%ED%95%9C-%EC%A0%9C%ED%92%88-%EC%96%B4%EB%96%A4-%EA%B2%83%EC%9D%84-%EC%84%A0%ED%83%9D%ED%95%B4%EC%95%BC-%ED%95%A0%EA%B9%8C-9be262255a0f
https://medium.com/@nsw5288/%EB%B9%84%EC%95%84%EA%B7%B8%EB%9D%BC-%EA%B5%AC%EB%A7%A4-%EA%B0%80%EC%9D%B4%EB%93%9C-%EC%95%88%EC%A0%84%ED%95%98%EA%B3%A0-%EC%A0%80%EB%A0%B4%ED%95%98%EA%B2%8C-%EA%B5%AC%EB%A7%A4%ED%95%98%EB%8A%94-%EB%B0%A9%EB%B2%95-fbbad5bc4210
https://medium.com/@charlielevesque328/%EB%B9%84%EC%95%84%EA%B7%B8%EB%9D%BC-%EA%B5%AC%EB%A7%A4-%EC%8B%9C-%EC%95%8C%EC%95%84%EC%95%BC-%ED%95%A0-%EC%9C%A0%EC%9D%98%EC%82%AC%ED%95%AD-7%EA%B0%80%EC%A7%80-65e6def5d880
https://medium.com/@nsw5288/%EB%B9%84%EC%95%84%EA%B7%B8%EB%9D%BC-%EA%B5%AC%EB%A7%A4-%EB%B0%A9%EB%B2%95%EA%B3%BC-%ED%9A%A8%EA%B3%BC%EC%A0%81%EC%9D%B8-%EC%82%AC%EC%9A%A9%EB%B2%95-71efc491ca1b
https://naveridbuy.blogspot.com/2024/12/blog-post_36.html
https://naveridbuy.exblog.jp/37090861/
https://diplomatic-shrimp-dbgzh2.mystrikingly.com/blog/079e4cac293
https://xn--ko-ro2i3ru49at1jokm7ma.mystrikingly.com/blog/cc58d224c7e
https://viastoer.blogspot.com/2024/07/blog-post_69.html
https://ko.anotepad.com/note/read/i2fj7bca
https://naveridbuy.exblog.jp/37152057/
https://candid-lion-dd3cm3.mystrikingly.com/blog/8c25ae9d7a9
https://adaptable-camellia-dd3cm4.mystrikingly.com/blog/be918970425
https://telegra.ph/%EB%B9%84%EC%95%84%EA%B7%B8%EB%9D%BC-%EA%B5%AC%EB%A7%A4-%EC%8B%9C-%ED%95%84%EC%88%98-%EC%B2%B4%ED%81%AC%EB%A6%AC%EC%8A%A4%ED%8A%B8-10-10
https://ko.anotepad.com/note/read/hmwedtej
https://xn--w9-o02ik82a9kav54aokmxvc.mystrikingly.com/blog/4724d879be1
https://medium.com/@nsw5288/%EB%B9%84%EC%95%84%EA%B7%B8%EB%9D%BC-%EC%96%B8%EC%A0%9C-%EB%B3%B5%EC%9A%A9%ED%95%B4%EC%95%BC-%ED%9A%A8%EA%B3%BC%EA%B0%80-%EC%A2%8B%EC%9D%84%EA%B9%8C-12c8395a1912
https://zippy-tomato-dbgzhv.mystrikingly.com/blog/b0c4e583f8a
https://ameblo.jp/naveridbuy/entry-12866333769.html
https://optimistic-rabbit-dbgzhd.mystrikingly.com/blog/786e23386cd
Greetings! Very helpful advice within this article! It’s the little changes which will make the most significant changes. Thanks a lot for sharing!
https://ko.anotepad.com/note/read/hi75snr3
https://medium.com/@nsw5288/%EB%B9%84%EC%95%84%EA%B7%B8%EB%9D%BC-%EC%98%A8%EB%9D%BC%EC%9D%B8-%EA%B5%AC%EB%A7%A4-%EB%B0%A9%EB%B2%95%EA%B3%BC-%EC%A3%BC%EC%9D%98-%EC%82%AC%ED%95%AD-c80ca72b0103
It’s hard to come by knowledgeable people in this particular subject, but you sound like you know what you’re talking about! Thanks
https://witty-apple-dd3cm1.mystrikingly.com/blog/55463079550
https://ko.anotepad.com/note/read/kcc3r23h
https://turquoise-dove-dd3cmd.mystrikingly.com/blog/c93bf9514ff
https://candid-lion-dd3cm3.mystrikingly.com/blog/9cd12105d44
I could not resist commenting. Perfectly written!
https://naveridbuy.blogspot.com/2024/11/blog-post_28.html
https://inky-owl-dd3cmv.mystrikingly.com/blog/5
https://medium.com/@carlfrancoh38793/%EB%84%A4%EC%9D%B4%EB%B2%84-%EC%95%84%EC%9D%B4%EB%94%94-%EA%B5%AC%EB%A7%A4-%ED%95%A9%EB%B2%95%EC%9D%B8%EA%B0%80%EC%9A%94-%EC%95%8C%EC%95%84%EB%B4%85%EC%8B%9C%EB%8B%A4-40dff2b624f5
https://candid-lion-dd3cm3.mystrikingly.com/blog/7114981bc76
https://telegra.ph/%EB%84%A4%EC%9D%B4%EB%B2%84-%EC%95%84%EC%9D%B4%EB%94%94-%EC%97%86%EC%9D%B4-%EC%84%9C%EB%B9%84%EC%8A%A4-%EC%9D%B4%EC%9A%A9%ED%95%98%EB%8A%94-%ED%8C%81-12-13
https://adaptable-goat-dd3cmf.mystrikingly.com/blog/c2a25554bec
https://medium.com/@nsw5288/%EB%B9%84%EC%95%84%EA%B7%B8%EB%9D%BC-%EA%B5%AC%EB%A7%A4-%EC%8B%9C-%EA%B0%80%EC%A7%9C-%EC%A0%9C%ED%92%88%EC%9D%84-%ED%94%BC%ED%95%98%EB%8A%94-%EB%B0%A9%EB%B2%95-3f91fcb6bf6f
https://salmon-peach-dd3cm8.mystrikingly.com/blog/vs
https://naveridbuy.blogspot.com/2024/12/blog-post_27.html
https://telegra.ph/%EB%84%A4%EC%9D%B4%EB%B2%84-%EC%95%84%EC%9D%B4%EB%94%94-%EA%B1%B0%EB%9E%98%EB%8A%94-%EC%95%88%EC%A0%84%ED%95%9C%EA%B0%80-%EC%A0%84%EB%AC%B8%EA%B0%80%EC%9D%98-%EC%A1%B0%EC%96%B8-12-13-2
https://gold-gull-dd3cmf.mystrikingly.com/blog/dc52558c085
https://naveridbuy.blogspot.com/2024/11/blog-post_3.html
https://naveridbuy.blogspot.com/2024/12/blog-post_29.html
https://telegra.ph/%EB%84%A4%EC%9D%B4%EB%B2%84-%EC%95%84%EC%9D%B4%EB%94%94-%EA%B1%B0%EB%9E%98%EB%8A%94-%EC%95%88%EC%A0%84%ED%95%9C%EA%B0%80-%EC%A0%84%EB%AC%B8%EA%B0%80%EC%9D%98-%EC%A1%B0%EC%96%B8-12-13-2
https://writeablog.net/9tndlpy4rw
https://gold-gull-dd3cmf.mystrikingly.com/blog/0168a471da6
https://xn--w6-hd0j99gyns5z0qeiim2i.mystrikingly.com/blog/f33715c06a4
https://naveridbuy.blogspot.com/2024/11/blog-post_3.html
You are so awesome! I don’t suppose I’ve read through a single thing like this before. So nice to discover someone with some genuine thoughts on this subject. Really.. many thanks for starting this up. This website is one thing that is needed on the web, someone with a bit of originality.
https://naveridbuy.blogspot.com/2024/12/blog-post_19.html
https://naveridbuy.exblog.jp/37152120/
https://salmon-peach-dd3cm8.mystrikingly.com/blog/faf9fda7a2f
https://gajweor.pixnet.net/blog/post/162189190
https://sociable-corn-dd3cmt.mystrikingly.com/blog/62214e87a2c
It’s difficult to find experienced people for this subject, however, you sound like you know what you’re talking about! Thanks
https://naveridbuy.exblog.jp/35659090/
https://viastoer.blogspot.com/2024/10/5.html
https://telegra.ph/%EB%B9%84%EC%95%84%EA%B7%B8%EB%9D%BC-%EA%B5%AC%EB%A7%A4-%EC%A0%84-%ED%95%84%EB%8F%85-%EB%B6%80%EC%9E%91%EC%9A%A9%EA%B3%BC-%EC%82%AC%EC%9A%A9%EB%B2%95-09-20
https://viastoer.blogspot.com/2024/07/5.html
https://medium.com/@nsw5288/%EB%B9%84%EC%95%84%EA%B7%B8%EB%9D%BC-vs-%EB%8B%A4%EB%A5%B8-ed-%EC%B9%98%EB%A3%8C%EC%A0%9C-%EC%B0%A8%EC%9D%B4%EC%A0%90%EC%9D%80-3b6d3d8df113
https://ocher-cat-dd3cmm.mystrikingly.com/blog/642842abd0f
https://telegra.ph/%EB%B9%84%EC%95%84%EA%B7%B8%EB%9D%BC-%EA%B5%AC%EB%A7%A4-%EC%A0%84-%ED%95%84%EB%8F%85-%EB%B6%80%EC%9E%91%EC%9A%A9%EA%B3%BC-%EC%82%AC%EC%9A%A9%EB%B2%95-09-20
https://hallbook.com.br/blogs/313007/%EB%B9%84%EC%95%84%EA%B7%B8%EB%9D%BC-%EA%B5%AC%EB%A7%A4-%ED%9B%84-%ED%9A%A8%EA%B3%BC%EC%A0%81%EC%9D%B8-%EC%82%AC%EC%9A%A9%EB%B2%95%EA%B3%BC-%EA%B4%80%EB%A6%AC-%ED%8C%81
https://responsible-seal-dd3cm4.mystrikingly.com/blog/5979a3be2d5
https://viastoer.blogspot.com/2024/09/blog-post_93.html
https://medium.com/@carlfrancoh38793/%EB%84%A4%EC%9D%B4%EB%B2%84-%EC%95%84%EC%9D%B4%EB%94%94-%EB%B9%84%EB%B0%80%EB%B2%88%ED%98%B8-%EB%B3%B5%EA%B5%AC%ED%95%98%EB%8A%94-5%EA%B0%80%EC%A7%80-%EB%B0%A9%EB%B2%95-216aafd6cf7c
https://naveridbuy.blogspot.com/2024/11/5.html
https://naveridbuy.blogspot.com/2024/12/blog-post_70.html
https://adaptable-camellia-dd3cm4.mystrikingly.com/blog/70aed56e7e8
https://medium.com/@carlfrancoh38793/%EB%84%A4%EC%9D%B4%EB%B2%84-%EC%95%84%EC%9D%B4%EB%94%94-%EB%B9%84%EB%B0%80%EB%B2%88%ED%98%B8-%EB%B3%B5%EA%B5%AC%ED%95%98%EB%8A%94-5%EA%B0%80%EC%A7%80-%EB%B0%A9%EB%B2%95-216aafd6cf7c
https://writeablog.net/ep887shpzn
https://candid-lion-dd3cm3.mystrikingly.com/blog/2024
https://naveridbuy.blogspot.com/2024/11/5_28.html
https://candid-lion-dd3cm3.mystrikingly.com/blog/9cd12105d44
https://wise-onion-dbgzh0.mystrikingly.com/blog/ca930eb2678
https://viastoer.blogspot.com/2024/09/7.html
https://xn--fn-hd0jg6f81ltjas9lbns.mystrikingly.com/blog/290000a8b29
https://xn--w6-hd0jg6f81lm0dhhw74c.mystrikingly.com/blog/9bea3d272ae
https://hallbook.com.br/blogs/295244/%EB%B0%9C%EA%B8%B0%EB%B6%80%EC%A0%84%EA%B3%BC-%EC%A1%B0%EB%A3%A8%EC%9D%98-%EC%8B%AC%EB%A6%AC%EC%A0%81-%EC%9A%94%EC%9D%B8%EA%B3%BC-%EA%B7%B9%EB%B3%B5-%EC%A0%84%EB%9E%B5
Your style is really unique in comparison to other people I have read stuff from. I appreciate you for posting when you’ve got the opportunity, Guess I will just bookmark this page.
https://peaceful-raccoon-dbgzh6.mystrikingly.com/blog/vs
https://naveridbuy.blogspot.com/2024/11/blog-post_95.html
https://gold-gull-dd3cmf.mystrikingly.com/blog/277217c9c6c
https://naveridbuy.exblog.jp/37090971/
https://medium.com/@carlfrancoh38793/%EB%84%A4%EC%9D%B4%EB%B2%84-%EC%95%84%EC%9D%B4%EB%94%94-%EA%B5%AC%EB%A7%A4-%EA%B3%BC%EC%97%B0-%EB%8F%88%EA%B0%92%EC%9D%84-%ED%95%A0%EA%B9%8C-d89a0fd7d3c4
https://writeablog.net/qmceliv4q8
https://medium.com/@carlfrancoh38793/%EB%84%A4%EC%9D%B4%EB%B2%84-%EC%B9%B4%ED%8E%98-%EC%9A%B4%EC%98%81%EC%9D%84-%EC%9C%84%ED%95%9C-%EC%95%84%EC%9D%B4%EB%94%94-%EA%B5%AC%EB%A7%A4-%ED%8C%81-eb39c3e24984
https://gajweor.pixnet.net/blog/post/162189334
https://medium.com/@charlielevesque328/%EB%B9%84%EC%95%84%EA%B7%B8%EB%9D%BC-%EA%B5%AC%EB%A7%A4-%EA%B0%80%EA%B2%A9-%ED%92%88%EC%A7%88-%EC%95%88%EC%A0%84%EC%84%B1%EC%9D%84-%EB%AA%A8%EB%91%90-%EA%B3%A0%EB%A0%A4%ED%95%98%EC%9E%90-ad89a243bd5a
https://writeablog.net/37n5a9w9yv
https://telegra.ph/%EB%B9%84%EC%95%84%EA%B7%B8%EB%9D%BC%EA%B0%80-%EB%8B%B9%EC%8B%A0%EC%97%90%EA%B2%8C-%EC%A0%81%ED%95%A9%ED%95%9C%EC%A7%80-%ED%99%95%EC%9D%B8%ED%95%98%EB%8A%94-%EB%B2%95-09-12
https://gold-gull-dd3cmf.mystrikingly.com/blog/0168a471da6
https://writeablog.net/imt11px743
https://naveridbuy.blogspot.com/2024/12/blog-post_52.html
https://naveridbuy.blogspot.com/2024/11/blog-post_28.html
https://witty-apple-dd3cm1.mystrikingly.com/blog/55463079550
https://witty-apple-dd3cm1.mystrikingly.com/blog/6e9742ef068
https://adaptable-camellia-dd3cm4.mystrikingly.com/blog/70aed56e7e8
https://medium.com/@carlfrancoh38793/%EB%84%A4%EC%9D%B4%EB%B2%84-%EC%95%84%EC%9D%B4%EB%94%94-%EA%B5%AC%EB%A7%A4-%ED%9B%84-%EA%B4%91%EA%B3%A0-%EA%B4%80%EB%A6%AC%EC%97%90-%ED%99%9C%EC%9A%A9%ED%95%98%EB%8A%94-%EB%B0%A9%EB%B2%95-6a822042a160
https://magenta-romaine-dbgzh9.mystrikingly.com/blog/1ef949a3574
https://medium.com/@nsw5288/%EB%B9%84%EC%95%84%EA%B7%B8%EB%9D%BC-%EA%B5%AC%EB%A7%A4%EC%99%80-%EA%B4%80%EB%A0%A8%EB%90%9C-%ED%9D%94%ED%95%9C-%EC%98%A4%ED%95%B4%EC%99%80-%EC%A7%84%EC%8B%A4-c72e98cd777a
https://telegra.ph/%EC%95%84%EC%9D%B4%EB%94%94-%EA%B1%B0%EB%9E%98%EC%9D%98-%EC%88%A8%EA%B2%A8%EC%A7%84-%EC%9C%84%ED%97%98-%EB%84%A4%EC%9D%B4%EB%B2%84-%EC%95%84%EC%9D%B4%EB%94%94-%EC%95%88%EC%A0%84%ED%95%98%EA%B2%8C-%EC%A7%80%ED%82%A4%EB%8A%94-%EB%B2%95-12-13
https://naveridbuy.blogspot.com/2024/11/5.html
https://ameblo.jp/naveridbuy/entry-12860974446.html
https://telegra.ph/%EB%B9%84%EC%95%84%EA%B7%B8%EB%9D%BC-%EC%98%A8%EB%9D%BC%EC%9D%B8-%EA%B5%AC%EB%A7%A4-%ED%9B%84%EA%B8%B0%EC%99%80-%EC%A3%BC%EC%9D%98%ED%95%B4%EC%95%BC-%ED%95%A0-%EC%A0%90%EB%93%A4-09-20
https://medium.com/@1kelly76/%EB%B9%84%EC%95%84%EA%B7%B8%EB%9D%BC-%EA%B5%AC%EB%A7%A4-%EC%8B%A0%EB%A2%B0%ED%95%A0-%EC%88%98-%EC%9E%88%EB%8A%94-%EC%98%A8%EB%9D%BC%EC%9D%B8-%EC%95%BD%EA%B5%AD-%EC%B0%BE%EA%B8%B0-58eabe0b8de6
https://medium.com/@carlfrancoh38793/%EB%84%A4%EC%9D%B4%EB%B2%84-%EC%95%84%EC%9D%B4%EB%94%94-%EA%B5%AC%EB%A7%A4-%ED%9B%84-%EA%B4%91%EA%B3%A0-%EA%B4%80%EB%A6%AC%EC%97%90-%ED%99%9C%EC%9A%A9%ED%95%98%EB%8A%94-%EB%B0%A9%EB%B2%95-6a822042a160
https://golden-grape-dd3cml.mystrikingly.com/blog/5cc22257c87
https://xn--w0-hd0j99gyns5z0qeiim2i.mystrikingly.com/blog/41cd67e48ef
https://xn--w5-hs1izvv81cmb366re3s.mystrikingly.com/blog/83444e604a7
https://smart-lily-dbgzhk.mystrikingly.com/blog/ce881420a9c
https://compassionate-kiwi-dbgzhg.mystrikingly.com/blog/ebba0025dc8
Aw, this was an extremely good post. Taking the time and actual effort to generate a great article… but what can I say… I put things off a lot and never manage to get anything done.
Aw, this was a really nice post. Finding the time and actual effort to make a superb article… but what can I say… I procrastinate a whole lot and don’t manage to get anything done.
Hi, I do think this is a great site. I stumbledupon it 😉 I am going to come back once again since i have bookmarked it. Money and freedom is the best way to change, may you be rich and continue to help other people.
Excellent web site you have got here.. It’s hard to find quality writing like yours these days. I really appreciate individuals like you! Take care!!
Very good post. I absolutely love this website. Stick with it!
There’s certainly a lot to know about this topic. I really like all the points you have made.
Good information. Lucky me I recently found your website by accident (stumbleupon). I have saved as a favorite for later!
Everyone loves it whenever people come together and share ideas. Great site, keep it up!
Pretty! This was a really wonderful article. Thank you for supplying this info.
I used to be able to find good advice from your blog posts.
This is the right webpage for anyone who would like to understand this topic. You understand a whole lot its almost tough to argue with you (not that I really would want to…HaHa). You definitely put a new spin on a topic that’s been written about for many years. Excellent stuff, just great.
He married Montie Lee SLACK at Sayre and she preceded him in demise.
The meat of edX courses is video; professionally produced clips complete with graphics and special effects delivered by star professors at each university.
It also permits you to manage time better as you observe so that eventually through the examination date nothing goes fallacious.
Good post. I learn something new and challenging on blogs I stumbleupon every day. It will always be useful to read through articles from other writers and practice a little something from their websites.
They handle the overwhelming majority of audits for publicly traded corporations in addition to many private companies, creating an oligopoly in auditing large companies.
You should always work very closely with your accountant when negotiating a deal with a outside funding source including private equity firms, angel investors, merchant banks, and venture capital firms.
In those home windows which can be set with figurative rondels, the type inside them is commonly Classical (see below) however sometimes Medievalising and generally seeks to reproduce the original type so accurately that to they casual eye they’ve the looks of historical home windows.
Hello! I could have sworn I’ve been to this blog before but after going through some of the posts I realized it’s new to me. Anyways, I’m certainly happy I came across it and I’ll be bookmarking it and checking back regularly.
Scott Powers (2008-07-15). “Simpsons Journey will get 1 million riders in quickest time ever”.
An aircraft tracking board the place the status of all aircraft preparing for flight and those in flight are tracked.
Way cool! Some extremely valid points! I appreciate you writing this write-up and the rest of the website is extremely good.
Binder says that in the future investors will not necessarily think of the traditional classifications of “G10” (or G7) versus “emerging markets”.
Journal of Health Communication.
They can browse the menu, send their order straight to the kitchen, pay by credit card, and then either eat at the restaurant or take the food out.
I could not refrain from commenting. Very well written.
Otherwise, this business of wholesale handbags is very aggressive businesses the place there are quite a lot of people are striving arduous to make a foothold for themselves.
That approach, your baby won’t get too cold in the course of the bathing process.
Let’s look at how Web conferencing technology brings press conferences right to a journalist’s desktop.
He’s answerable for making the primary medallion window in America, in the first Presbyterian Church of Pittsburgh, Pennsylvania and the second in Calvary Episcopal Church of Pittsburgh, Pennsylvania.
How a lot was a typical house in the U.S.
Companies have developed collaborative green design software to help make it easier to compare and contrast all of the different green building options available.
In passive portfolio management, the aim is to obtain a relative return as close to zero as possible, thereby reproducing the return of the theoretical reference portfolio.
It additionally covers the airport and Fort Tuthill (county park and the Pepsi Amphitheater), being bordered to the south by the urban areas of Kachina Village and Mountainaire.
The US dollar is here used as numeraire for convenience, and since it cancels out, in principle some other foreign money can be used instead with out affecting the outcomes.
This variation is referred to by Eric Schiller in Unorthodox Chess Openings.
For instance, these can stick up in odd places which can be risky while driving, especially during nighttime when there is no one to help you.
A master suite with a bathroom is the epitome of luxury.
This simple strap and buckle are answerable for saving thousands and thousands of lives, with that number climbing each single day.
Every part which can express hate, love, despair, and madness was powerfully united in tones.
It is plausible, however, that the appliance of the epithet Elyon “most high” to Israelite Yahweh predates the conquest of Jerusalem; the epithet was utilized with enough fluidity all through the Northwest Semitic sphere that assuming a transition from its utility to El to the Yahwistic cult presents no impediment.
You made some good points there. I looked on the web to find out more about the issue and found most individuals will go along with your views on this web site.
A nice midrange card can enormously enhance performance for a couple of hundred dollars, however you too can find much cheaper ones that are not bleeding-edge that can suit your wants simply fine.
In 2006, the first tramline have to be operational.
Greetings! Very helpful advice in this particular post! It’s the little changes that will make the most significant changes. Thanks for sharing!
Master of Administration in Well being Care is a one-yr diploma aimed at healthcare staff; all candidates will need to have at the very least five years of work experience in their fields.
Of only 69 models made, most of them found their way into drag-racing, and this powerful package option wasn’t offered again.
This blog was… how do I say it? Relevant!! Finally I’ve found something that helped me. Thank you.
He was born Might 18, 1922, in Millinocket, the son of Ralph and Carrie (Sturgeon) Robinson.
Greetings! Very helpful advice in this particular article! It is the little changes that produce the largest changes. Many thanks for sharing!
I quite like reading an article that will make men and women think. Also, thanks for allowing for me to comment.
What should you needed to – gasp – move a automobile on the freeway or go up a hill?
It whipped the rival Chevy in 1955 production by nearly 24-to-1 — 16,155 for the model year.
Tenth century BCE, in keeping with the Wellhausen hypothesis they reached one thing like their current type solely in the 5th to 4th centuries BCE, when they’re alleged to have been edited to adjust to the theology of Second Temple Judaism.
I must thank you for the efforts you’ve put in penning this blog. I’m hoping to check out the same high-grade content by you in the future as well. In truth, your creative writing abilities has encouraged me to get my own website now 😉
Almost all mega life events involve food because it nurtures relationships.
Good web site you have got here.. It’s difficult to find excellent writing like yours nowadays. I honestly appreciate people like you! Take care!!
Ogle Waite Redpath, Filler, Stobswood Colliery, Northern (Northumberland & Cumberland) Division, National Coal Board.
Gross domestic product (GDP, or the number of goods and companies generated in a nation), earnings, employment, industrial manufacturing, and wholesale-retail gross sales are all exhibiting signs of slowing down.
Mary Agana, an authentic take on the Bloody Mary legend.
Funds which have been stable throughout a considerable period can be great options to consider.
Movie studios saw an opportunity to make extra money, and so they began to sell motion pictures on tape.
Reduce the trail firmly and thoroughly with a pointy craft knife; it’s higher to make it too big than too small.
Arrangements are below the path of Orr Gray Gish Funeral Dwelling.
In this text, we’ll delve into the advantages and techniques to making a DIY laundry detergent at dwelling.
This website really has all the information and facts I wanted concerning this subject and didn’t know who to ask.
And he should be willing to tell you about that progress.
What are the disadvantages of being a stay-at-house guardian?
The commodity futures contracts are extraordinarily standardized with the quantity, high quality and delivery date being predetermined.
These are very harmful characteristics for any trader to have.
However for others, you is usually a bit more deliberate.
Kentucky state parks offered free housing to those who could not go back to their properties.
False Income, Expenses or Exemptions: People may be encouraged to inflate income, expenses or exemptions for the year in an effort to lessen their tax payments.
All currencies are traded in pairs, for example EUR / GBP, CHF / JPY etc.
After I originally left a comment I appear to have clicked the -Notify me when new comments are added- checkbox and from now on whenever a comment is added I get four emails with the same comment. Perhaps there is a way you are able to remove me from that service? Kudos.
This blog was… how do you say it? Relevant!! Finally I’ve found something that helped me. Kudos.
217-220 For instance, a easy provide-demand system would possibly specify the quantity q of a product demanded as a function D of its worth p and consumers’ income I, the latter being an exogenous variable, and would possibly specify the quantity provided by producers as a function S of its value and two exogenous resource cost variables r and w.
The next time I read a blog, I hope that it won’t fail me as much as this particular one. I mean, I know it was my choice to read through, nonetheless I actually believed you would have something useful to say. All I hear is a bunch of moaning about something that you could fix if you were not too busy seeking attention.
Whenever you turn off your “management” device, your smart strip cuts energy flow to all of the opposite gadgets on the strip, in order that they’re totally turned off moderately than still using electricity in standby mode.
The word Sith is taken from the 1914 science fiction novel, The Warlord of Mars, by Edgar Rice Burroughs through which it refers to a species of beetle.
Each new business also needs lots of advice regarding financing and a bookkeeper can provide you with ways by which to boost capital and afterward use it properly.
Different parts of the world invented their very own versions of the omelet, and the frittata is Italy’s contribution to this menu.
Remote call forwarding served a similar function for inbound calls only.
CST (04:58 UTC) over northeastern Marshall County, Kentucky.
Always be supple and accept the truth as soon as you understand that you are on the incorrect side of the deal.
I seriously love your blog.. Excellent colors & theme. Did you make this amazing site yourself? Please reply back as I’m planning to create my own personal site and want to find out where you got this from or just what the theme is called. Thank you!
This is a good tip particularly to those new to the blogosphere. Simple but very precise info… Many thanks for sharing this one. A must read post!
The next time I read a blog, Hopefully it doesn’t disappoint me as much as this one. I mean, Yes, it was my choice to read through, but I really thought you would probably have something interesting to say. All I hear is a bunch of whining about something that you can fix if you were not too busy looking for attention.
An outstanding share! I’ve just forwarded this onto a friend who was conducting a little homework on this. And he in fact bought me lunch simply because I stumbled upon it for him… lol. So allow me to reword this…. Thanks for the meal!! But yeah, thanx for spending some time to discuss this subject here on your web site.
You’re so interesting! I don’t think I have read through anything like that before. So wonderful to discover somebody with a few genuine thoughts on this topic. Seriously.. many thanks for starting this up. This site is one thing that’s needed on the internet, someone with some originality.
Howdy! I could have sworn I’ve visited this site before but after going through many of the posts I realized it’s new to me. Regardless, I’m certainly pleased I came across it and I’ll be book-marking it and checking back regularly!
For extra details about cellular broadband providers, wireless expertise and related matters, check out the links on the following web page.
I seriously love your blog.. Very nice colors & theme. Did you create this amazing site yourself? Please reply back as I’m trying to create my very own site and want to find out where you got this from or just what the theme is called. Many thanks.
While most of those errors won’t land you in a jail cell next to Bernie Madoff, they could trigger you just a few complications as you deal with delays in your refund check or pay penalties and interest.
Pretty! This was an incredibly wonderful post. Thanks for supplying these details.
If not, you can attempt the whole course of once extra and hope for better outcomes.
However, these cracks are indeed fatal to aggregates, which can seriously affect its solidness, crushing value, and other indicators.
This uncommon automobile hit an insane top velocity of more than 250 mph again in 2007, but production of the mannequin stopped in 2013.
It’s a much saner destiny to hope for.
Perhaps essentially the most tantalizing facet of this Italian casserole is the thick, golden, bubbly high layer of cheese that greets you as you pull it from the oven.
A bootstrapped curve, correspondingly, is one where the costs of the instruments used as an enter to the curve, will likely be a precise output, when these identical devices are valued utilizing this curve.
Other chairs require the person to pull a launch handle earlier than bodily pushing again towards the backrest of the chair.
It will probably win a girls’s coronary heart in a blink of an eye.
The information contained in the form of balance sheet that is produced with credit scoring is often known as hard information.
In accordance with Paradox Interactive, the game was performed by a median of 12,500 gamers each day, with a median playtime of ninety nine hours per player.
If you are a beginner it is advisable to first educate yourself before jumping into the forex trading, as it can appear the simplest way to make money though it has risks associated to it.
Browse on to seek out what you’ll need before venturing during this bad however ultimately-rewarding business.
This prediction was due to what occurred on the stock market when investors stopped calling their brokers over the phone and started utilizing the internet and its service more.
John French McGregor, Chairman, Disablement Income Group, Scotland.
Wilbur Cemetery, immediately (Thursday), Sept 6, with Bishop Kent Peterson of Latter Day Saints Church officiating.
At our current age and time, these cuts are almost gone so there is a small chance that the company who you bought stocks from will decrease their dividends and get you in trouble.
Disruptions. Your emergency preparedness plans may tackle disruptions brought on by an occasion, which can last longer than the occasion itself.
I’m impressed, I must say. Seldom do I encounter a blog that’s both equally educative and interesting, and without a doubt, you have hit the nail on the head. The problem is something which too few men and women are speaking intelligently about. I’m very happy that I stumbled across this during my hunt for something regarding this.
If that wasn’t enough, extra manufacturing and health care companies at the moment are searching for out MBAs — although industries like banking and consulting have usually recruited essentially the most MBA students.
This is a very good tip particularly to those new to the blogosphere. Brief but very accurate info… Thanks for sharing this one. A must read post.
They have a smoky participant’s lounge on the second ground and the shop is on the third.
This may very well be achieved by the issue of an ESM monetary credit score line to SRF, with any potential draws from this further standby association being conditioned on simultaneous implementation of additional ex-publish levies on the monetary trade, to make sure full repayment of the drawn funds to ESM over a medium-term horizon.
The fifth sport of the match, a 48-transfer win for Nepomniachtchi, was performed on 15 April.
Martin Dell who married an Everingham, was James Dell, often called “Hunter Jim”.
https://naveridbuy.blogspot.com/2024/11/5_28.html
https://xn--gw-2e2i723b91ktjas9l307b.mystrikingly.com/blog/7386c66bb8b
https://medium.com/@charlielevesque328/%EB%B9%84%EC%95%84%EA%B7%B8%EB%9D%BC-%EA%B5%AC%EB%A7%A4-%EC%9D%B4%EB%A0%87%EA%B2%8C-%ED%95%98%EB%A9%B4-%EC%95%88%EC%A0%84%ED%95%A9%EB%8B%88%EB%8B%A4-d371ae128dd1
https://medium.com/@nsw5288/%EB%B9%84%EC%95%84%EA%B7%B8%EB%9D%BC-%EA%B5%AC%EB%A7%A4%EC%99%80-%EA%B4%80%EB%A0%A8%EB%90%9C-%EC%A3%BC%EC%9A%94-%EC%A7%88%EB%AC%B8%EA%B3%BC-%EB%8B%B5%EB%B3%80-552ce203761b
https://medium.com/@carlfrancoh38793/%EB%84%A4%EC%9D%B4%EB%B2%84-%EC%B9%B4%ED%8E%98-%EC%9A%B4%EC%98%81%EC%9D%84-%EC%9C%84%ED%95%9C-%EC%95%84%EC%9D%B4%EB%94%94-%EA%B5%AC%EB%A7%A4-%ED%8C%81-eb39c3e24984
https://viastoer.blogspot.com/2024/07/blog-post_33.html
https://naveridbuy.blogspot.com/2024/11/2024.html
https://ko.anotepad.com/note/read/hi75snr3
You need to be a part of a contest for one of the greatest blogs on the web. I’m going to highly recommend this site!
https://hallbook.com.br/blogs/376898/%EB%84%A4%EC%9D%B4%EB%B2%84-%EC%95%84%EC%9D%B4%EB%94%94-%EA%B5%AC%EB%A7%A4%EA%B0%80-%EB%B6%88%EB%9F%AC%EC%98%A4%EB%8A%94-%EB%B3%B4%EC%95%88-%EC%9C%84%ED%97%98
It’s difficult to find educated people in this particular subject, however, you sound like you know what you’re talking about! Thanks
https://sociable-corn-dd3cmt.mystrikingly.com/blog/62214e87a2c
https://witty-apple-dd3cm1.mystrikingly.com/blog/e592523ee2b
https://candid-lion-dd3cm3.mystrikingly.com/blog/9cd12105d44
https://telegra.ph/%EB%84%A4%EC%9D%B4%EB%B2%84-%EC%95%84%EC%9D%B4%EB%94%94-%EA%B5%AC%EB%A7%A4-%EC%A0%95%EB%A7%90-%EC%95%88%EC%A0%84%ED%95%A0%EA%B9%8C-12-13
https://medium.com/@charlielevesque328/%EB%B9%84%EC%95%84%EA%B7%B8%EB%9D%BC-%EA%B5%AC%EB%A7%A4-%EA%BF%80%ED%8C%81-%EA%B0%80%EA%B2%A9-%EB%B9%84%EA%B5%90%EC%99%80-%ED%95%A9%EB%A6%AC%EC%A0%81-%EA%B5%AC%EB%A7%A4%EB%B2%95-993fec2377e5
https://tawny-wombat-dd3cmn.mystrikingly.com/blog/7f0e593caac
https://cinnamon-carnation-dbgzh6.mystrikingly.com/blog/1d8602d8d6c
https://medium.com/@carlfrancoh38793/%EB%84%A4%EC%9D%B4%EB%B2%84-%EC%B9%B4%ED%8E%98-%EC%9A%B4%EC%98%81%EC%9D%84-%EC%9C%84%ED%95%9C-%EC%95%84%EC%9D%B4%EB%94%94-%EA%B5%AC%EB%A7%A4-%ED%8C%81-eb39c3e24984
https://naveridbuy.blogspot.com/2024/11/top-5.html
https://naveridbuy.exblog.jp/35891790/
When I originally left a comment I seem to have clicked on the -Notify me when new comments are added- checkbox and now each time a comment is added I receive four emails with the same comment. Perhaps there is a way you are able to remove me from that service? Appreciate it.
https://xn--w5-hs1izvv81cmb366re3s.mystrikingly.com/blog/83444e604a7
https://proactive-taro-dbgzhp.mystrikingly.com/blog/c1be5bd9f29
https://medium.com/@nsw5288/%EB%B9%84%EC%95%84%EA%B7%B8%EB%9D%BC-%ED%8C%8C%EB%8A%94%EA%B3%B3-b91273007f40
Thanks for sharing. Like your post.Name
https://ko.anotepad.com/note/read/qscmkp7h
https://tawny-wombat-dd3cmn.mystrikingly.com/blog/cfa45d0871d
https://inky-owl-dd3cmv.mystrikingly.com/blog/9f4dcb67968
https://hallbook.com.br/blogs/295244/%EB%B0%9C%EA%B8%B0%EB%B6%80%EC%A0%84%EA%B3%BC-%EC%A1%B0%EB%A3%A8%EC%9D%98-%EC%8B%AC%EB%A6%AC%EC%A0%81-%EC%9A%94%EC%9D%B8%EA%B3%BC-%EA%B7%B9%EB%B3%B5-%EC%A0%84%EB%9E%B5
You have made some really good points there. I looked on the net for more info about the issue and found most individuals will go along with your views on this site.
https://xn--w3-hd0jg6f81lm0dhhw74c.mystrikingly.com/blog/633b5d0c891
Hi, I do believe this is a great blog. I stumbledupon it 😉 I may come back yet again since I book marked it. Money and freedom is the best way to change, may you be rich and continue to guide other people.
https://candid-lion-dd3cm3.mystrikingly.com/blog/8c25ae9d7a9
I blog frequently and I genuinely appreciate your information. Your article has truly peaked my interest. I will take a note of your website and keep checking for new details about once per week. I opted in for your Feed as well.
https://naveridbuy.blogspot.com/2024/12/blog-post_82.html
https://telegra.ph/%EB%B9%84%EC%95%84%EA%B7%B8%EB%9D%BC-%EA%B5%AC%EB%A7%A4-%EC%8B%A0%EB%A2%B0%ED%95%A0-%EC%88%98-%EC%9E%88%EB%8A%94-%ED%8C%90%EB%A7%A4%EC%B2%98-%EC%B0%BE%EA%B8%B0-07-31
https://medium.com/@1kelly76/%EC%A1%B0%EB%A3%A8%EC%99%80-%EB%B0%9C%EA%B8%B0%EB%B6%80%EC%A0%84-%EC%9E%90%EC%A1%B4%EA%B0%90%EC%9D%84-%ED%9A%8C%EB%B3%B5%ED%95%98%EB%8A%94-5%EA%B0%80%EC%A7%80-%EB%B0%A9%EB%B2%95-c0027f644e86
https://telegra.ph/%EB%84%A4%EC%9D%B4%EB%B2%84-%EC%95%84%EC%9D%B4%EB%94%94-%EA%B5%AC%EB%A7%A4-%EB%8C%80%EC%8B%A0-%EC%82%AC%EC%9A%A9%ED%95%A0-%EC%88%98-%EC%9E%88%EB%8A%94-%EB%B0%A9%EB%B2%95%EB%93%A4-12-13
https://naveridbuy.blogspot.com/2024/12/blog-post_26.html
https://naveridbuy.exblog.jp/37152040/
https://responsible-seal-dd3cm4.mystrikingly.com/blog/268981e831e
https://medium.com/@carlfrancoh38793/%EB%84%A4%EC%9D%B4%EB%B2%84-%EC%95%84%EC%9D%B4%EB%94%94-%EC%A0%95%EB%A7%90-%ED%95%84%EC%9A%94%ED%95%9C%EA%B0%80-%EA%B5%AC%EB%A7%A4-%EC%9D%B4%EC%9C%A0-10%EA%B0%80%EC%A7%80-551cc5f335a5
https://garnet-kiwi-dbgzh4.mystrikingly.com/blog/33fcfc616be
https://xn--fb-hd0jg6f81ltjas9lbns.mystrikingly.com/blog/099e984de60
https://allnich.mypixieset.com/
sex nhật hiếp dâm trẻ em ấu dâm buôn bán vũ khí ma túy bán súng sextoy chơi đĩ sex bạo lực sex học đường tội phạm tình dục chơi les đĩ đực người mẫu bán dâm
https://medium.com/@carlfrancoh38793/%EB%84%A4%EC%9D%B4%EB%B2%84-%EC%95%84%EC%9D%B4%EB%94%94-%EB%B9%84%EB%B0%80%EB%B2%88%ED%98%B8-%EB%B3%B5%EA%B5%AC%ED%95%98%EB%8A%94-5%EA%B0%80%EC%A7%80-%EB%B0%A9%EB%B2%95-216aafd6cf7c
https://naveridbuy.blogspot.com/2024/11/blog-post_28.html
https://witty-apple-dd3cm1.mystrikingly.com/blog/10
https://hallbook.com.br/blogs/376901/%EB%84%A4%EC%9D%B4%EB%B2%84-%EC%95%84%EC%9D%B4%EB%94%94-%EA%B1%B0%EB%9E%98%EB%8A%94-%EC%95%88%EC%A0%84%ED%95%9C%EA%B0%80-%EC%A0%84%EB%AC%B8%EA%B0%80%EC%9D%98-%EC%A1%B0%EC%96%B8
https://xn--ki-ro2i3ru49at1jokm7ma.mystrikingly.com/blog/c71e597cb89
https://writeablog.net/i676tpbaz7
https://medium.com/@carlfrancoh38793/%EB%84%A4%EC%9D%B4%EB%B2%84-%EC%95%84%EC%9D%B4%EB%94%94%EC%99%80-%EA%B4%80%EB%A0%A8%EB%90%9C-%EC%B5%9C%EC%8B%A0-%EB%B3%B4%EC%95%88-%EC%9D%B4%EC%8A%88-4569786b88d3
https://medium.com/@carlfrancoh38793/%EB%84%A4%EC%9D%B4%EB%B2%84-%EC%B9%B4%ED%8E%98-%EC%9A%B4%EC%98%81%EC%9D%84-%EC%9C%84%ED%95%9C-%EC%95%84%EC%9D%B4%EB%94%94-%EA%B5%AC%EB%A7%A4-%ED%8C%81-eb39c3e24984
In France there are numerous group that are well known globally so there isn’t such issue that firms or organization usually are not settled in-fact a few of them are world leaders in their area like Alcatel-Lucent, Orange, Safron, Saint Gobain, Zodiac etc.
https://xn--w9-o02ik82a9kav54aokmxvc.mystrikingly.com/blog/4724d879be1
https://naveridbuy.blogspot.com/2024/11/blog-post_95.html
Awesome insights!
https://naveridbuy.blogspot.com/2024/12/blog-post_87.html
https://gajweor.pixnet.net/blog/post/162189577
https://gajweor.pixnet.net/blog/post/162317545
https://turquoise-dove-dd3cmd.mystrikingly.com/blog/11fff6361ff
https://responsible-seal-dd3cm4.mystrikingly.com/blog/0f08a7ad417
https://medium.com/@nsw5288/%EB%B9%84%EC%95%84%EA%B7%B8%EB%9D%BC-%EC%98%A8%EB%9D%BC%EC%9D%B8-%EA%B5%AC%EB%A7%A4-%EB%B0%A9%EB%B2%95%EA%B3%BC-%EC%A3%BC%EC%9D%98-%EC%82%AC%ED%95%AD-c80ca72b0103
Aw, this was a very nice post. Spending some time and actual effort to make a good article… but what can I say… I put things off a lot and never seem to get nearly anything done.
https://gold-gull-dd3cmf.mystrikingly.com/blog/dc52558c085
Oh my goodness! Awesome article dude! Many thanks, However I am encountering difficulties with your RSS. I don’t understand why I am unable to join it. Is there anybody getting the same RSS problems? Anyone who knows the answer will you kindly respond? Thanks.
Leopold, Sid John; Englesson, Niclas (November 27, 2017).
The very next time I read a blog, Hopefully it does not disappoint me as much as this particular one. After all, I know it was my choice to read, nonetheless I truly believed you would probably have something interesting to say. All I hear is a bunch of complaining about something that you can fix if you were not too busy searching for attention.
If you are fortunate sufficient to have a house with protected, personal views, you may want to maximize them with image home windows and even greenhouse home windows — bump-out fashions that have a glass “roof” over the window top to let in even more mild.
Good post. I learn something totally new and challenging on websites I stumbleupon every day. It will always be interesting to read articles from other authors and practice something from their sites.
https://medium.com/@carlfrancoh38793/%EA%B5%AC%EA%B8%80-%EC%95%84%EC%9D%B4%EB%94%94-%EA%B5%AC%EB%A7%A4-%EC%9D%B4%EC%A0%90%EA%B3%BC-%EB%8B%A8%EC%A0%90%EC%9D%80-%EB%AC%B4%EC%97%87%EC%9D%B8%EA%B0%80%EC%9A%94-4dccd7ee3fc1
https://medium.com/@carlfrancoh38793/%EB%84%A4%EC%9D%B4%EB%B2%84-%EC%95%84%EC%9D%B4%EB%94%94-%EA%B5%AC%EB%A7%A4-%ED%9B%84-%EA%B4%91%EA%B3%A0-%EA%B4%80%EB%A6%AC%EC%97%90-%ED%99%9C%EC%9A%A9%ED%95%98%EB%8A%94-%EB%B0%A9%EB%B2%95-6a822042a160
https://vermilion-elephant-dd3cm3.mystrikingly.com/blog/52d79e7cbd9
https://dun-swam-dbgzhz.mystrikingly.com/blog/395b5452bec
https://naveridbuy.blogspot.com/2024/11/blog-post_58.html
https://candid-lion-dd3cm3.mystrikingly.com/blog/b99e214c11a
Greetings! Very helpful advice within this post! It’s the little changes which will make the most important changes. Thanks for sharing!
Pretty! This was an extremely wonderful article. Many thanks for providing this info.
Taking over from twenty first Century Fox, Disney owns 51 of Eredivisie Media & Advertising CV while Eredivisie owns the remaining 49.
Destructive thought patterns, comparable to catastrophizing or excessive fear, also can contribute to the event and exacerbation of anxiety assaults.
Way cool! Some extremely valid points! I appreciate you penning this write-up and also the rest of the website is also really good.
Different gadgets you won’t discover on sale when spring has sprung?
Imagine shocking your beloved one with this particular cake on his birthday or another particular occasion of their lives and they’re going to behold these memories for a long time.
Naira4all is a platform that add worth to Nigerian who needs to earn a second revenue half time or full time.
Renegotiate and come up with a plan that’s more realistic.
Wow! Thank you! I permanently needed to write on my website something like that. Can I implement a portion of your post to my site?
Florida Shiny Futures Scholarship Program.
Sorry for the huge evaluation, but I am really loving the brand new Microsoft zune, as well as wish this, as well as the superb evaluations some other people have written, can help you decide if it is the solution you’re looking for.
The Battle of Midway was key, because it was the second that a successful military ruse tricked Japan into sending its forces into the maw of the principle American fleet.
Administration also has the ability to alter or modify the scope of the planned monetary planning as soon as the plan is in place.
At the top of each week, a whole bunch of hundreds — if not tens of millions — of jugs are thrown in the trash.
This gradual but fuel-efficient hatchback was one of the highest-selling small vehicles in the U.S.
4. Examine what sorts of tax returns have been documented by your preferred planning administrations supplier in previous.
Combos with picture dividing websites, for example Flickr, are employed to convey ahead “reminiscence maps”.
It was launched in 2012 and is available in a number of markets.
Next time I read a blog, I hope that it won’t fail me as much as this one. After all, Yes, it was my choice to read, but I actually believed you would probably have something interesting to say. All I hear is a bunch of whining about something you could possibly fix if you were not too busy searching for attention.
Recommended for Cave Creek’s Finest Procuring because: Valerie’s Furnishings & Accents in Cave Creek is one of the city’s greatest source for Western furniture, accessories and reward items.
By the tip of the twelve games, nonetheless, the match was tied at 6 points every, so four fast video games had been played so as to provide a consequence.
You can use forex day tips for reducing market risks.
That is a really good tip particularly to those new to the blogosphere. Short but very precise info… Appreciate your sharing this one. A must read post.
Financial discipline refers to an individual’s capacity to take risks that are worth taking and to avoid overtrading which can possibly drain their entire investments.
As they approach a second waterfall, Sideshow Bob appears in a projection on the waterfall; wishing to play truthful, he tells Homer to resist all temptations in the realm up ahead, parodying the Pirates of the Caribbean and Jurassic Park: The Trip attractions.
Go to our subsequent Christmas sport to help A. Mouse discover all kinds of gingerbread delights.
Hi, I do think this is an excellent web site. I stumbledupon it 😉 I will come back once again since i have saved as a favorite it. Money and freedom is the best way to change, may you be rich and continue to guide other people.
I couldn’t refrain from commenting. Very well written!
NO Food. NO FUTURE.
Although chess had been a game of the bourgeoisie and upper lessons before the Russian Revolution, its reputation among Bolshevik leaders, including Vladimir Lenin, contributed to it being supported by state leaders in the USSR as a national pastime.
Pretty! This has been an incredibly wonderful article. Thanks for supplying this info.
Great post, I enjoyed – Gulvafslibning | Kurt Gulvmand. It was good. View my blog sometime, it all about Lake Mary, FL Real Estate.
Good post. I learn something new and challenging on websites I stumbleupon on a daily basis. It’s always exciting to read content from other writers and use a little something from their websites.
It consists of identifying threats (or risk causes), assessing the effectiveness of present controls to face these threats, determining the risks’ consequence(s), prioritizing the dangers by ranking the probability and influence, classifying the kind of risk, and selecting an acceptable threat choice or risk response.
I think more writers should take care to write with passion like you. Even informational articles like this can have personality. That’s what you have interjected in this informative article. Your views are very unique.
You possibly can converse into the remote from other rooms and get Echo to respond.
Name-brand game developers are observing and enhancing their investments in the mobile market and even setting up new divisions concentrated on wireless gaming.
You may have heard there’s still money in real estate.
Great post, I just ran across your site and wanted to say that I’ve truly enjoyed browsing your blog posts. After all I’ll be subscribing to your feed and I hope you write again very soon!
I discovered your blog site on google and examine a number of of your early posts. Continue to maintain up the superb operate. I simply extra up your RSS feed to my MSN News Reader. In search of forward to reading more from you later on!…
No glass containers, transporters, umbrellas, bicycles, skateboards, in-line skates, or pets are allowed.
The subsequent time I learn a blog, I hope that it doesnt disappoint me as a lot as this one. I imply, I do know it was my option to read, however I actually thought youd have one thing fascinating to say. All I hear is a bunch of whining about one thing that you could fix when you werent too busy in search of attention.
Rail car 1 was destroyed at the railway depot, car 7 by detonations in the Nord depot, and two units of carriages from car 53 and the aspect carriage of 110 in entrance of the city Theatre.
Way cool! Some extremely valid points! I appreciate you writing this article plus the rest of the site is really good.
I used to be able to find good info from your articles.
This is the right website for anybody who really wants to find out about this topic. You realize a whole lot its almost tough to argue with you (not that I personally would want to…HaHa). You definitely put a brand new spin on a topic which has been discussed for a long time. Wonderful stuff, just great.
it is always easy to find good ski resorts online, but most of them are expensive but they are great anyway`
Hello there, just became aware of your blog through Google, and found that it’s truly informative. I am going to watch out for brussels. I will be grateful if you continue this in future. Lots of people will be benefited from your writing. Cheers!
The twister was initially weak, with damage firstly of the path being restricted to downed highway indicators, a bent mild pole, and some orange construction barrels that have been tossed round.
This is a topic that is close to my heart… Cheers! Where are your contact details though?
Saved as a favorite, I love your website.
Because of its inherent magnificence, leisure venues for all ages and shut proximity to the ocean, outdated-progress forests and even the mountains, we couldn’t go away this basic off our listing.
Its such as you read my mind! You appear to grasp so much about this, such as you wrote the guide in it or something. I feel that you could do with a few percent to force the message house a little bit, but instead of that, this is magnificent blog. A fantastic read. I will certainly be back.
I was very lucky to find this internet site on bing, just what I was searching for : D likewise saved to favorites .
The very next time I read a blog, Hopefully it doesn’t fail me as much as this one. After all, I know it was my choice to read, nonetheless I actually believed you would have something useful to talk about. All I hear is a bunch of crying about something you can fix if you weren’t too busy looking for attention.
The challenge’s expansiveness signifies that its best promise is granting entry to books that people would in any other case never see.
Out on a souvenir accumulating spree?
Aw, this was a really nice post. Taking a few minutes and actual effort to create a great article… but what can I say… I put things off a whole lot and don’t seem to get anything done.
Happily, sustaining a tape measure is as straightforward as using one.
Wow I absolutely love her! She is so darn beautiful as well as a really good actress. I don’t think the show V is all that good, none the less I watch it anyway just so I can see Morena Baccarin. And I don’t know if you’ve ever seen her do an interview but she is also rather comical and it seems so natural for her. I personally never even heard of her before The V, now I’ll watch anything she’s on.
This website truly has all the information and facts I needed about this subject and didn’t know who to ask.
There are some interesting cut-off dates in this article but I don’t know if I see all of them heart to heart. There may be some validity however I’ll take maintain opinion until I look into it further. Good article , thanks and we want more! Added to FeedBurner as nicely
It seems you are getting quite a lof of unwanted comments. Maybe you should look into a solution for that. Have a nice day!
Can I recently say what relief to get a person that really knows what theyre preaching about on the web. You definitely understand how to bring a problem to light and make it essential. Lots more people really need to see this and understand this side on the story. I cant believe youre no more well-known when you certainly have the gift.
An interesting discussion is definitely worth comment. I do think that you should publish more about this topic, it might not be a taboo matter but typically folks don’t talk about these issues. To the next! Kind regards.
french translation is kind of hard at first but if you get used to it, then it is easy**
This is a excellent site, would you be interested in doing an interview regarding how you created it? If so e-mail me!
There is noticeably a bundle to learn about this. I suppose you made certain nice points in features also.
So if the whole Rashard Lewis thing is true, then God must really hate LeBron James.|Only_Lightning|
Everything is very open with a very clear clarification of the issues. It was definitely informative. Your site is very helpful. Many thanks for sharing!
sex nhật hiếp dâm trẻ em ấu dâm buôn bán vũ khí ma túy bán súng sextoy chơi đĩ sex bạo lực sex học đường tội phạm tình dục chơi les đĩ đực người mẫu bán dâm
Spot on with this write-up, I absolutely believe that this site needs a lot more attention. I’ll probably be returning to see more, thanks for the information!
I like to spend my free time by reading various internet recourses. Today I came across your site and I located it is as one of the best free resources available! Well done! Keep on this quality!
You’ll find obviously quite a lot of details just like that to take into consideration. That´s a fantastic point to bring up. I offer the thoughts above as general inspiration but clearly you will discover questions like the one you bring up where the most very important thing definitely will be working in honest excellent faith. I don´t know if most useful practices have emerged around things just like that, but I am certain that your work is clearly identified as a fair game.
If you鈥檙e in a toxic relationship, seeking advice and support from trusted sources can be a recreation-changer.
Some truly fantastic posts on this web site , appreciate it for contribution.
I like reading through and I conceive this website got some really utilitarian stuff on it! .
i can see that most mobile phones today are equipped with cameras and stuffs..
Secondly, after you have a properly formed treasure map you have something to give attention to to make sure your subconscious mind will get the message that this is what you want to attain.
I have read a few good stuff here. Definitely worth bookmarking for revisiting. I wonder how much effort you put to create such a fantastic informative web site.
Absolutely pent written content , Really enjoyed reading through .
There a few intriguing points with time in this post but I don’t know if all of them center to heart. There exists some validity but I will take hold opinion until I take a look at it further. Excellent write-up , thanks and that we want a lot more! Added onto FeedBurner likewise
That is financing offered underneath a federal, state, or native program, the principal function of which is to provide subsidized financing for tasks designed to conserve or produce energy.
It would better for you to steer the entire mission if you are saving all your spare cash and want to have the best option ever.
As an occasion supervisor, you is not going to discover any new day identical but each rising solar will carry one thing totally different and new for you.
Youre so cool! I dont suppose Ive read anything in this way just before. So nice to find somebody with a few original applying for grants this subject. realy i appreciate you for beginning this up. this web site is one area that is needed on-line, someone with some originality. useful job for bringing interesting things towards net!
I went over this site and I believe you have a lot of superb information, saved to bookmarks (:.
Hi, your blog is full of comments and it is very active,
The destruction of dams, purportedly to protect the Coho salmon, is cited for instance of how environmentalism is getting used as a political instrument quite than a practical solution.
In 2010, investment banks got here under strain because of selling complicated derivatives contracts to native municipalities in Europe and the US.
Jan谩膷ek was very amiable with colleagues and accepted what Janke had given him, including his harsh phrases.
An attention-grabbing dialogue is worth comment. I think that it’s best to write extra on this subject, it won’t be a taboo subject however usually individuals are not sufficient to speak on such topics. To the next. Cheers
i love to watch movies that made it to the box office, they are usually great movies with good story`
You produced some decent points there. I looked on the web for that problem and discovered most people is going together with with the internet site.
Malcolm Hilbery Chaplin, CBE.
Youre so cool! I dont suppose Ive read something similar to this before. So nice to get somebody by incorporating authentic applying for grants this subject. realy appreciation for starting this up. this website are some things that’s needed over the internet, somebody after a little bit originality. helpful project for bringing something new to the web!
Hey man, .This was an excellent page for such a hard subject to talk about. I look forward to reading many more great posts like these. Thanks
This is the right weblog for anybody who desires to find out about this topic. You realize a lot its almost arduous to argue with you (not that I really would want…HaHa). You positively put a new spin on a subject thats been written about for years. Great stuff, simply great!
World belongings beneath administration consists of assets held by asset management companies, pension funds, sovereign wealth funds, hedge funds, and personal equity funds.
Good post. I learn something totally new and challenging on sites I stumbleupon on a daily basis. It’s always useful to read articles from other writers and use a little something from their websites.
Can I just say such a relief to find someone who in fact knows what theyre referring to online. You actually know how to bring a concern to light to make it important. More people need to check this out and understand this side in the story. I cant believe youre less popular since you certainly develop the gift.
Very well said, your blog says it all about that particular topic.*~”*~
I’m happy! It’s pleasant to see someone really educated about what they do. Hold up the excellent perform and I’ll return for additional! Many thanks!
Thankx so much for this! I havent been this thrilled by a post for a long period of time! Youve got it, whatever that means in blogging. Anyway, You are certainly someone that has something to say that people need to hear. Keep up the good job. Keep on inspiring the people!
Oh my goodness! a fantastic article dude. Appreciate it However My business is experiencing problem with ur rss . Do not know why Not able to subscribe to it. Can there be everyone finding identical rss problem? Anybody who knows kindly respond. Thnkx
I was just browsing for related blog posts for my project research and I happened to discover yours. Thanks for the useful information!
you’ve gotten an unbelievable blog here! do you want to develop ask articles on my small website?
Excellent read, I just passed this onto a colleague who was doing a little research on that. And he just bought me lunch because I found it for him smile Thus let me rephrase that: Thank you for lunch!
Spot i’ll carry on with this write-up, I must say i believe this excellent website requirements far more consideration. I’ll probably be once more to see additional, thank you that information.
After checking out a handful of the articles on your web site, I seriously like your technique of writing a blog. I saved it to my bookmark website list and will be checking back soon. Take a look at my web site too and let me know what you think.
He spent the primary 12 years locked within the toilet – partying, drinking.
Thanks. I really like your site. Great points you make in your post.
Can I simply say what relief to get somebody that in fact knows what theyre dealing with on-line. You actually know how to bring a concern to light to make it essential. Workout . should ought to see this and can see this side of your story. I cant think youre less well-known simply because you definitely hold the gift.
Conveyancing… […]we like to honor other sites on the web, even if they aren’t related to us, by linking to them. Below are some sites worth checking out[…]…
Very good article. I absolutely love this website. Keep it up!
This is a topic which is close to my heart… Best wishes! Exactly where can I find the contact details for questions?
It’s appropriate time to make some plans for the future and it is time to be happy. I have read this post and if I could I want to suggest you some interesting things or suggestions. Maybe you can write next articles referring to this article. I desire to read more things about it!
The next occasion I read a weblog, Hopefully that this doesnt disappoint me as much as this one. Come on, man, Yes, it was my choice to read, but When i thought youd have some thing fascinating to express. All I hear can be a number of whining about something you could fix should you werent too busy in search of attention.
Hi, i think that i saw you visited my blog thus i came to “return the favor”.I’m trying to find things to improve my site!I suppose its ok to use a few of your ideas!!
Hello there! I could have sworn I’ve been to this blog before but after going through many of the articles I realized it’s new to me. Anyways, I’m definitely happy I came across it and I’ll be bookmarking it and checking back often!
I am curious to find out what blog system you are utilizing? I’m experiencing some minor security problems with my latest website and I would like to find something more safeguarded. Do you have any recommendations?
Pretty nice post, thanks for the awesome article. I’m having troubles subscribing to your blogs feed. Thought I’d let you know
Aw, this was a very nice post. In concept I wish to put in writing like this moreover ?taking time and precise effort to make an excellent article?but what can I say?I procrastinate alot and certainly not appear to get one thing done.
Hello There. I found your blog using msn. This is a really well written article. I will make sure to bookmark it and come back to read more of your useful info. Thanks for the post. I will certainly return.
Hey there! I’m at work browsing your blog from my new iphone! Just wanted to say I love reading through your blog and look forward to all your posts! Carry on the great work!
I discovered your blog website on google and check several of your early posts. Continue to keep the top notch operate. I additional increase your Feed to my MSN News Reader. Seeking toward reading a lot more of your stuff at a later time!…
The script, co-written by McKay & Chris Henchy, sends up buddy cop movies with more verve than most films of this type.
You should participate in a contest for among the best blogs on the web. I’ll advocate this web site!
Hmm. just what you mean. Hello, would you eventually have Feed? I’m attempting to sign up in order to get revisions. Tell me.
Albert Walter Papworth, Police Constable, Euston Station, British Transport Police Pressure.
Would you ever strive some canned soup for a fast pick-me-up?
I couldn’t refrain from commenting. Perfectly written!
We are a bunch of volunteers and starting a new scheme in our community. Your web site provided us with valuable information to work on. You have done a formidable activity and our entire neighborhood will be thankful to you.
Who designed your website. I think you did a good job.
Many thanks for spending some time to line this all out for people like us. This blog post has been really helpful in my opinion.
Way cool! Some extremely valid points! I appreciate you penning this post and the rest of the site is very good.
I really love your blog.. Great colors & theme. Did you create this site yourself? Please reply back as I’m attempting to create my own website and would love to find out where you got this from or just what the theme is named. Appreciate it!
Simply no Baloney and also well crafted, I appreciate for the post
Aw, this has been a very good post. In idea I have to devote writing this way additionally – spending time and actual effort to generate a top notch article… but exactly what do I say… I procrastinate alot and by no indicates seem to go accomplished.
ibuprofen is a good pain reliever but i heard that this one have nasty side effects too~
I’ve looked all around for this details. You have been actually beneficial. Thanks so significantly. Download Pokemon Black and Pokemon White Rom Leaked!
Hey there this is a excellent write-up. I’m going to mail this to my buddies. I stumbled on this while browsing on google I’ll be sure to come back. thanks for sharing.
Nice post. I learn something tougher on different blogs everyday. It will always be stimulating to study content off their writers and exercise a specific thing from their store. I’d would prefer to use some with all the content in my blog regardless of whether you don’t mind. Natually I’ll provide a link for your web weblog. Thank you for sharing.
This has to be one of my favorite posts! And on top of thats its also very helpful topic for newbies. thank a lot for the info!
I’d forever want to be update on new content on this web site , saved to bookmarks ! .
When visiting blogs, i always look for a very nice content like yours ,
Introducing to you the most prestigious online entertainment address today. Visit now to experience now!
hello!,I love your writing very a lot! share we keep in touch extra approximately your article on AOL? I need a specialist on this area to resolve my problem. Maybe that is you! Looking ahead to peer you.
Spot i’ll carry on with this write-up, I must say i think this excellent website needs far more consideration. I’ll apt to be once again to see far more, thank you for that information.
There are actually numerous particulars like that to take into consideration. That is a great level to carry up. I provide the thoughts above as general inspiration however clearly there are questions like the one you convey up the place crucial thing will likely be working in sincere good faith. I don?t know if best practices have emerged round issues like that, but I’m sure that your job is clearly recognized as a good game. Each girls and boys really feel the impact of only a moment’s pleasure, for the rest of their lives.
Introducing to you the most prestigious online entertainment address today. Visit now to experience now!
Howdy! Do you know if they make any plugins to assist with Search
Engine Optimization? I’m trying to get my blog to rank for some
targeted keywords but I’m not seeing very good gains.
If you know of any please share. Thanks!
You can read similar article here: Your destiny
I am only writing to let you be aware of what a excellent discovery my cousin’s girl developed using your blog. She even learned a lot of details, not to mention what it’s like to possess a marvelous helping spirit to have most people effortlessly know specific grueling subject matter. You really surpassed my desires. I appreciate you for presenting these effective, dependable, revealing not to mention fun tips on that topic to Lizeth.
well, i bought some digital pedometer on the local walmart and it is great for monitoring your performance when walking*
Perfectly written content material , thanks for entropy.
dance shoes that are shiny are the most cool stuff that you could possibly wear*
When I originally commented I clicked the -Notify me when new comments are added- checkbox and now each time a comment is added I purchase four emails sticking with the same comment. Can there be that is you’ll be able to eliminate me from that service? Thanks!
After research a number of of the weblog posts on your web site now, and I really like your manner of blogging. I bookmarked it to my bookmark website record and will be checking back soon. Pls try my web site as effectively and let me know what you think.
Girls want to see a ripped body check us out for advice!
Several communities possess singles groups which set about enjoyable breast implants aventura things to do mutually, and this also can be is a good choice courting approach. Situations for instance riding a bike, bowling, curling, video hours, dance in addition to humor golf equipment will be arranged from the singles group, also it enables the evenly-distributed number of people to obtain a great in addition to informal night. With focus applied the actual task per se as an alternative to building a intimate relationship, it will require a great deal of pressure off the singles and sites take place a lot more obviously around such a location.
Very informative blog. I especially like content that has to do with beauty and fitness, so it’s refreshing to me to see what you have here. Keep it up! facial exercises
This is really exciting, You’re a tremendously trained article author. I’ve joined with your feed and also anticipate enjoying the awesome write-ups. Incidentally, I’ve got shared the blog throughout our social networking sites.
The the next occasion Someone said a weblog, I hope it doesnt disappoint me around this one. Come on, man, Yes, it was my solution to read, but I personally thought youd have something interesting to convey. All I hear is actually a lot of whining about something you could fix should you werent too busy looking for attention.
Introducing to you the most prestigious online entertainment address today. Visit now to experience now!
Spot lets start work on this write-up, I honestly feel this web site needs a great deal more consideration. I’ll more likely once more to study additional, thank you for that information.
One other important area is that if you are a senior citizen, travel insurance regarding pensioners is something you ought to really contemplate. The old you are, greater at risk you are for allowing something awful happen to you while in foreign countries. If you are not covered by many comprehensive insurance, you could have a number of serious challenges. Thanks for expressing your hints on this website.
I can’t really help but admire your blog, your blog is so adorable and nice ,
Howdy sir, you have a really nice blog layout “
Hi, i think that i saw you visited my web site so i came to “return the favor”.I am trying to find things to enhance my web site!I suppose its ok to use some of your ideas!!
Pretty! This has been a really wonderful post. Thanks for providing these details.
of all the free stuffs that can come from the internet, what i love to are those free DVDs,,
Can I simply say that of a relief to seek out somebody who truly knows what theyre speaking about over the internet. You actually know how to bring a concern to light and earn it important. The diet ought to ought to see this and fully grasp this side in the story. I cant think youre less popular because you undoubtedly possess the gift.
J’ai la possibilité de transférer les url pour d’autres de clichés en relation avec ce sujet. Ecrivez moi directement?
Cool blog! Is your theme custom made or did you download it from somewhere? A design like yours with a few simple tweeks would really make my blog shine. Please let me know where you got your theme. Thanks
Introducing to you the most prestigious online entertainment address today. Visit now to experience now!
You have noted very useful details! PS. nice web site. “Disbelief in magic can force a poor soul into believing in government and business.” by Tom Robbins..
There is noticeably big money comprehend this. I assume you have made specific nice points in features also.
Many individuals can be extremely active, at the same time they approach their golden years. Boating, skiing, and other activities do place you at the upper chances for being injured, but every day life is not intended as approached within an overly-cautious manner. Should you be considering a trip that features sports or activities which might be considered risky, many insurance agencies won’t cover you in case you’re injured while doing these kind of activities. Be prepared for your vacation by knowing what activities you will end up engaging in, and you may be covered however should happen.
I’m extremely inspired along with your writing talents as well as with the layout for your weblog.
Is that this a paid subject or did you modify it yourself?
Either way keep up the nice high quality writing, it is uncommon to look a great
blog like this one these days. Affilionaire.org!
I blog quite often and I truly appreciate your content. This great article has really peaked my interest. I will bookmark your website and keep checking for new information about once per week. I subscribed to your RSS feed as well.
I loved as much as you’ll receive carried out right here. The sketch is attractive, your authored material stylish. nonetheless, you command get got an nervousness over that you wish be delivering the following. unwell unquestionably come more formerly again as exactly the same nearly a lot often inside case you shield this hike.
I simply present your website a couple weeks ago and that i tend to be learning the idea daily. You’ve substantial amount of tips next and i also relish your thing about the homepage insanely. Cultivate acknowledge that there are energy!
You made several fine points there. I did a search on the subject matter and found most people will consent with your blog.
Aw, it was quite a good post. In idea I have to put in writing such as this moreover – taking time and actual effort to produce a excellent article… but what / things I say… I procrastinate alot through no indicates manage to get something completed.
Can I just now say that of a relief to locate somebody who truly knows what theyre speaking about online. You actually know how to bring a difficulty to light and work out it crucial. The diet need to see this and appreciate this side on the story. I cant believe youre no more popular since you definitely possess the gift.
Great website right here! Additionally your web site starts up very fast! What host are you getting service from? Can you pass along your associate link for your host? I want my web site loaded up as fast as yours lol
Ships coming into the Panama Canal from the Atlantic enter the first of three Gatun Locks, the place the large chamber fills with 26.7 million gallons of water.
Needed to send you this little remark to help give many thanks over again for all the remarkable knowledge you have shown here. It was certainly pretty generous of people like you in giving openly exactly what some people would have offered as an e-book to earn some dough for their own end, principally since you might well have done it if you considered necessary. The creative ideas as well acted to become a fantastic way to fully grasp the rest have a similar dreams just like mine to realize great deal more with reference to this matter. I am certain there are some more enjoyable situations in the future for individuals who see your site.
Hiya, I’m really glad I’ve found this information. Nowadays bloggers publish just about gossips and net and this is actually irritating. A good blog with interesting content, this is what I need. Thank you for keeping this website, I’ll be visiting it. Do you do newsletters? Can not find it.
bad credits can happen at any point in your life so be prepared to always get some extra income.
Powder coating uses two varieties of powder: thermoplastic and thermosetting.
Our units are delicate, absorbent, and designed to final, making them ideally suited for daily use.
When occupied with one of the best ways to keep your pores and skin’s thirst quenched, you may first flip to physique lotions; nevertheless, these creams tend to rub off shortly and depart your pores and skin dry again quickly.
What’s Happening i am new to this, I stumbled upon this I have found It positively useful and it has helped me out loads. I hope to contribute & assist other users like its helped me. Good job.
There are a few interesting points in time in this posting but I do not determine if I see these people center to heart. There may be some validity but Let me take hold opinion until I take a look at it further. Very good write-up , thanks and we want much more! Included in FeedBurner likewise
The railroad representatives have been stunned by Seger’s argument, figuring it would not be talked about at all.
This is novel. If only I possibly could examine every submit, however i will need to go back to perform now… However i’ll come back.
College of Pittsburgh. p.
Good web site! I truly love how it is simple on my eyes and the data are well written. I am wondering how I could be notified whenever a new post has been made. I have subscribed to your RSS which must do the trick! Have a nice day!
Now this is weird, all jokes aside – this is the second time today that I found this blog when searching for two totally different things. Has anyone else ever done that?
I learned alot by reading your article. Keep up with good posts.
Right here is the right blog for anybody who hopes to understand this topic. You realize a whole lot its almost tough to argue with you (not that I actually will need to…HaHa). You certainly put a fresh spin on a subject that’s been written about for many years. Great stuff, just great.
Right here is the right webpage for anyone who hopes to understand this topic. You realize a whole lot its almost tough to argue with you (not that I really would want to…HaHa). You definitely put a fresh spin on a subject that’s been written about for decades. Wonderful stuff, just wonderful.
Dwelling mortgage from Axis Bank comes with simple loan processing, pre and/or repayment options, EMIs and different such features that are typically personalized based on the applicant’s eligibility as determined by the financial institution.
Image ads are usually only for Adsense regarding Articles internet pages without designed for Adsense intended for Serp’s internet pages.
I believe this site holds very good pent subject material posts .
Hey, you used to write magnificent, but the last few posts have been kinda boring… I miss your tremendous writings. Past several posts are just a little out of track! come on!
Hey there! Finding joy in this masterpiece—it’s amazing. In fact, this piece brings a brilliant touch to the overall vibe. Keep pushing!
This is certainly a remarkably amazing powerful resource that you’re offering and you simply provide it away cost-free!! I that can compare with discovering websites ones understand the particular in providing you fantastic learning resource for zero cost. We truly dearly loved examining this web site. Appreciate it!
when i was still in high school, i always planned to take pyschology because it gives me great interest.,
bluetooth headsets are great because they are wireless and your movement is not limited by wires”
Excellent site you’ve got here.. It’s difficult to find quality writing like yours these days. I seriously appreciate individuals like you! Take care!!
sex nhật hiếp dâm trẻ em ấu dâm buôn bán vũ khí ma túy bán súng sextoy chơi đĩ sex bạo lực sex học đường tội phạm tình dục chơi les đĩ đực người mẫu bán dâm
This was one in every of the very best variety of athletes and longest periods among seventeen websites used within the research.
It’s difficult to find educated people on this subject, but you seem like you know what you’re talking about! Thanks
sex nhật hiếp dâm trẻ em ấu dâm buôn bán vũ khí ma túy bán súng sextoy chơi đĩ sex bạo lực sex học đường tội phạm tình dục chơi les đĩ đực người mẫu bán dâm
Thanks for the suggestions you have shared here. Something else I would like to express is that computer system memory specifications generally rise along with other breakthroughs in the technological know-how. For instance, when new generations of cpus are brought to the market, there is certainly usually an equivalent increase in the scale calls for of all pc memory and hard drive room. This is because the software program operated by these processors will inevitably surge in power to benefit from the new know-how.
Toss an insect into the web if you want to see them in motion.” Guillebeau reminded us, “Do not kill spiders (or anything) for no good motive.
Robert John Bruce, Police Constable, Kent County Constabulary, and for Charitable Services.
Excellent and really nice blog. I really enjoy blogs that have to do with weight loss and fitness, so this is of particular interest to me to see what you have here. Keep it going! force factor
Everything is very open with a clear clarification of the challenges. It was really informative. Your site is very helpful. Thanks for sharing!
Howdy! I could have sworn I’ve visited this website before but after looking at some of the posts I realized it’s new to me. Regardless, I’m certainly delighted I came across it and I’ll be bookmarking it and checking back often!
By including training in employable expertise the hope was that the children would achieve sufficient expertise to obtain employment when they left the institution, and where this might not be attainable, then the aim was to show the kids to grow to be useful at dwelling, as a lot for themselves as well as for his or her household.
Cash market funds bought to institutional investors that spend money on non-authorities securities must compute a web asset worth based mostly on the worth of the securities held within the funds.
Great info – Gulvafslibning | Kurt Gulvmand I’m inquisitive to discover what blog platform you’re utilizing? We are experiencing some minor safety issues with my latest blog thus I’d wish to discover something a lot more risk-free. Are there some suggestions! Take care Online Website Builder
sex nhật hiếp dâm trẻ em ấu dâm buôn bán vũ khí ma túy bán súng sextoy chơi đĩ sex bạo lực sex học đường tội phạm tình dục chơi les đĩ đực người mẫu bán dâm
Aw, this was a actually good publish. In principle I want to set in producing like this furthermore – taking time and actual work to make an excellent article… but what can I say… I procrastinate alot and not at all seem to get some thing accomplished.
Hello! Nice post! Please do keep us posted when we can see a follow up!
vinacomintower.com có thể chứa mã độc, không truy cập!
I am extremely inspired with your writing talents and also with the format on your blog.
Is this a paid subject or did you modify it your self? Either way
stay up the excellent quality writing, it’s rare to peer a great
blog like this one these days. Fiverr Affiliate!
Good blog you have here.. It’s difficult to find high-quality writing like yours these days. I seriously appreciate people like you! Take care!!
Will you mind generally if I mention a couple of your blogposts providing that I give you credit and even sources returning to your web sites? My web-site is in the similar market as your own and my users will profit from several of the help and advice your site offer in this article. Please be sure to let me know if it is okay for you. Kind regards!
Having read this I believed it was very enlightening. I appreciate you spending some time and effort to put this information together. I once again find myself personally spending a lot of time both reading and commenting. But so what, it was still worth it!
I was able to find good info from your blog posts.
I love it when individuals get together and share ideas. Great site, keep it up.
Đừng tin vào các ưu đãi hoặc quà tặng từ mexicoexpo2020.com!
hey there and thank you for your information – I’ve definitely picked up anything new from right here. I did however expertise some technical issues using this website, as I experienced to reload the web site a lot of times previous to I could get it to load correctly. I had been wondering if your web hosting is OK? Not that I am complaining, but sluggish loading instances times will very frequently affect your placement in google and could damage your high quality score if advertising and marketing with Adwords. Well I am adding this RSS to my email and can look out for a lot more of your respective exciting content. Ensure that you update this again very soon..
Hi! I simply want to give you a big thumbs up for the excellent info you have got here on this post. I will be returning to your site for more soon.
I’m really impressed along with your writing talents and also with the layout for your weblog. Is that this a paid subject matter or did you customize it your self? Anyway stay up the nice high quality writing, it is uncommon to see a great weblog like this one these days. I like prometheus-research.com ! It’s my: TikTok Algorithm
Good post. I definitely love this site. Keep writing!
Spot on with this write-up, I truly feel this site needs much more attention. I’ll probably be returning to read through more, thanks for the advice.
These are the essential foods of your meals pattern.
But, in case you want one thing to last a long time and you recognize individuals will not come into much contact with it, treated lumber is perhaps the higher alternative.
Quite, Sith embrace strife and dark ardour as salutary and emancipatory forces, as they imagine that violent wrestle purges the decadent and weak, and that feelings similar to aggression and hate present the energy and resolve to safe freedom by means of victory.
Former presidential nominee Michael Dukakis’ wife, Kitty Dukakis, even wrote a book “Shock” describing how modern ECT treatment has helped her with the debilitating depression that she suffered from.
Historian Iain Gately theorizes that the invention of the magic smoke of tobacco fell alongside the same lines as different discoveries by early man: It was an accident.
These scams pile an extra helping of embarrassment on top of the shame of being gullible: You also have to admit that it happened in a moment of big-headedness, even if it was a momentary one.
I love reading through a post that will make people think. Also, many thanks for permitting me to comment.
I like this post, enjoyed this one thanks for putting up.
Good job!
sex nhật hiếp dâm trẻ em ấu dâm buôn bán vũ khí ma túy bán súng sextoy chơi đĩ sex bạo lực sex học đường tội phạm tình dục chơi les đĩ đực người mẫu bán dâm
sex nhật hiếp dâm trẻ em ấu dâm buôn bán vũ khí ma túy bán súng sextoy chơi đĩ sex bạo lực sex học đường tội phạm tình dục chơi les đĩ đực người mẫu bán dâm
Appreciate this info!
This is a topic that’s near to my heart… Thank you! Exactly where can I find the contact details for questions?
It’s hard to find well-informed people on this subject, but you seem like you know what you’re talking about! Thanks
Spot on with this write-up, I actually feel this website needs a great deal more attention. I’ll probably be back again to read more, thanks for the advice!
Appreciate this info!
This is the right web site for anyone who wants to find out about this topic. You realize a whole lot its almost tough to argue with you (not that I really would want to…HaHa). You certainly put a new spin on a topic that has been written about for ages. Excellent stuff, just excellent.
Great post. I’m dealing with some of these issues as well..
This is a topic which is near to my heart… Many thanks! Where can I find the contact details for questions?
That is a really good tip especially to those fresh to the blogosphere. Short but very accurate info… Thank you for sharing this one. A must read article.
Bookmarking this one!
Great post! We are linking to this great article on our website. Keep up the good writing.
Please message me with a few pointers on how you made your blog look this good, Id appreciate it.
I blog quite often and I genuinely appreciate your information. The article has truly peaked my interest. I will book mark your website and keep checking for new information about once a week. I opted in for your Feed too.
This is a great point. I came across a very similar analysis on Go789, which made me appreciate this perspective even more.
Big thanks for this.
Exactly right.
I agree with this viewpoint. It aligns with something I read on Tin88, where they also explore the same subject matter and provide insightful conclusions.
I wanted to thank you for this good read!! I absolutely enjoyed every bit of it. I have got you book marked to look at new stuff you post…
This key fact write is get many site visitors. How should you publicize it? Doing it offers a fantastic customized style during strategies. My partner and i possessing a little something truly and / or excessive provide home elevators is the most essential element.
Hey, great blog you have here, think I came across it on Yahoo but im not sure nowanyway, Ill check back again! Are guests allowed to post here?
Your blog is amazing dude. i love to visit it everyday. very nice layout and content .
Wow, amazing blog format! How long have you been running a blog for? you made blogging look easy. The entire glance of your site is excellent, as smartly the content!
I am often to blogging i actually appreciate your posts. The article has really peaks my interest. My goal is to bookmark your web blog and keep checking choosing info.
I love the valuable info you supply in your posts. I don’t think I could have put it better myself.
sex nhật hiếp dâm trẻ em ấu dâm buôn bán vũ khí ma túy bán súng sextoy chơi đĩ sex bạo lực sex học đường tội phạm tình dục chơi les đĩ đực người mẫu bán dâm
Howdy! I just want to give a huge thumbs up for the good data you have right here on this post. I shall be coming again to your blog for more soon.
I like the way you conduct your posts. Keep it up!
I have noticed that over the course of developing a relationship with real estate homeowners, you’ll be able to get them to understand that, in every single real estate transaction, a commission is paid. In the long run, FSBO sellers will not “save” the commission. Rather, they fight to win the commission by means of doing a great agent’s job. In completing this task, they invest their money along with time to conduct, as best they will, the assignments of an broker. Those duties include getting known the home by means of marketing, representing the home to all buyers, constructing a sense of buyer desperation in order to prompt an offer, making arrangement for home inspections, taking on qualification checks with the loan company, supervising fixes, and aiding the closing of the deal.
After going over a number of the blog articles on your website, I truly like your way of blogging. I saved it to my bookmark site list and will be checking back in the near future. Please visit my web site too and tell me how you feel.
This is a really good tip especially to those new to the blogosphere. Brief but very accurate information… Thank you for sharing this one. A must read article!
You’ve made some good points there. I looked on the internet to find out more about the issue and found most individuals will go along with your views on this site.
sex nhật wyattearp hiếp dâm trẻ em wyattearp ấu dâm wyattearp
Hi, I do think this is a great site. I stumbledupon it 😉 I will come back once again since i have saved as a favorite it. Money and freedom is the best way to change, may you be rich and continue to guide others.
My husband and i got now thrilled Edward managed to finish off his researching while using the ideas he gained out of the web site. It’s not at all simplistic to just continually be giving out ideas which usually some people have been selling. And we consider we now have you to give thanks to because of that. The type of explanations you’ve made, the easy blog menu, the friendships you aid to instill – it’s everything powerful, and it is helping our son in addition to our family imagine that the situation is excellent, and that is incredibly pressing. Thanks for all!
Only a smiling visitant here to share the love (:, btw outstanding layout.
Thank you for the sensible critique. Me and my friend were just preparing to do a little research on this. We got a book from our area library but I think I learned more from this post. I am very glad to see such magnificent information being shared freely out there..
I could not refrain from commenting. Exceptionally well written!
Howdy! I just would like to give you a huge thumbs up for the great information you have got here on this post. I am coming back to your website for more soon.
Spot on with this write-up, I truly believe that this site needs far more attention. I’ll probably be back again to see more, thanks for the info!
Very good blog post. I definitely love this website. Continue the good work!
Howdy! I simply wish to offer you a big thumbs up for your excellent information you have got here on this post. I’ll be returning to your blog for more soon.
I needed to thank you for this excellent read!! I certainly loved every little bit of it. I’ve got you book marked to look at new things you post…
This is a really good tip especially to those fresh to the blogosphere. Simple but very accurate info… Appreciate your sharing this one. A must read article!
This is the perfect website for anybody who wishes to understand this topic. You realize a whole lot its almost tough to argue with you (not that I personally will need to…HaHa). You definitely put a new spin on a subject that’s been discussed for ages. Excellent stuff, just wonderful.
This is a topic that’s near to my heart… Best wishes! Exactly where can I find the contact details for questions?
Saved as a favorite, I love your site.
I really like it when individuals come together and share opinions. Great blog, continue the good work.
I blog often and I genuinely thank you for your information. Your article has really peaked my interest. I’m going to bookmark your website and keep checking for new information about once a week. I subscribed to your RSS feed too.
After I initially left a comment I appear to have clicked the -Notify me when new comments are added- checkbox and now every time a comment is added I recieve 4 emails with the exact same comment. Is there a means you are able to remove me from that service? Kudos.
This website was… how do you say it? Relevant!! Finally I’ve found something that helped me. Cheers!
An outstanding share! I have just forwarded this onto a colleague who has been doing a little homework on this. And he actually bought me dinner due to the fact that I stumbled upon it for him… lol. So allow me to reword this…. Thanks for the meal!! But yeah, thanks for spending time to discuss this issue here on your blog.
bookmarked!!, I really like your website.
After I initially left a comment I appear to have clicked the -Notify me when new comments are added- checkbox and from now on whenever a comment is added I get four emails with the exact same comment. There has to be an easy method you can remove me from that service? Kudos.
I seriously love your blog.. Excellent colors & theme. Did you make this amazing site yourself? Please reply back as I’m trying to create my own website and want to learn where you got this from or what the theme is named. Thanks.
You should take part in a contest for one of the highest quality websites online. I am going to highly recommend this web site!
A motivating discussion is definitely worth comment. I do believe that you should publish more on this subject, it may not be a taboo subject but usually folks don’t talk about these issues. To the next! Many thanks.
I couldn’t agree more! This is a perspective I’ve seen discussed in detail on tx88game.city, and I think it brings a fresh outlook on the matter.
I’m impressed, I have to admit. Seldom do I encounter a blog that’s both equally educative and amusing, and without a doubt, you’ve hit the nail on the head. The problem is something not enough people are speaking intelligently about. I’m very happy that I came across this during my search for something regarding this.
Howdy, I believe your site may be having web browser compatibility issues. When I look at your blog in Safari, it looks fine but when opening in I.E., it has some overlapping issues. I merely wanted to provide you with a quick heads up! Besides that, wonderful blog.
Your style is really unique compared to other folks I’ve read stuff from. Thanks for posting when you have the opportunity, Guess I’ll just book mark this page.
That is a good tip especially to those fresh to the blogosphere. Brief but very precise information… Appreciate your sharing this one. A must read article.
Hi there! This post couldn’t be written any better! Reading through this post reminds me of my previous roommate! He constantly kept preaching about this. I am going to forward this information to him. Fairly certain he’ll have a good read. Many thanks for sharing!
Hello there! I could have sworn I’ve visited this blog before but after looking at many of the posts I realized it’s new to me. Anyhow, I’m certainly pleased I stumbled upon it and I’ll be book-marking it and checking back often.
An outstanding share! I have just forwarded this onto a co-worker who had been conducting a little research on this. And he in fact ordered me lunch because I stumbled upon it for him… lol. So allow me to reword this…. Thank YOU for the meal!! But yeah, thanks for spending the time to discuss this subject here on your blog.
Aw, this was an exceptionally nice post. Taking a few minutes and actual effort to make a really good article… but what can I say… I put things off a whole lot and never manage to get nearly anything done.
Everything is very open with a very clear clarification of the challenges. It was really informative. Your website is very useful. Many thanks for sharing.
Hi, I do think your site may be having browser compatibility issues. When I take a look at your web site in Safari, it looks fine however, if opening in IE, it has some overlapping issues. I merely wanted to provide you with a quick heads up! Other than that, excellent website.
I’m impressed, I have to admit. Rarely do I encounter a blog that’s both educative and interesting, and let me tell you, you’ve hit the nail on the head. The problem is something that not enough people are speaking intelligently about. I am very happy I stumbled across this in my hunt for something concerning this.
It’s difficult to find educated people on this subject, however, you seem like you know what you’re talking about! Thanks
Can I just say what a comfort to discover somebody who genuinely knows what they’re discussing on the web. You actually realize how to bring an issue to light and make it important. More and more people really need to check this out and understand this side of your story. I was surprised you are not more popular because you most certainly have the gift.
I was pretty pleased to uncover this great site. I wanted to thank you for your time due to this wonderful read!! I definitely really liked every bit of it and I have you book marked to check out new stuff in your site.
Right here is the perfect webpage for anybody who hopes to find out about this topic. You know a whole lot its almost hard to argue with you (not that I personally will need to…HaHa). You certainly put a brand new spin on a subject which has been discussed for years. Excellent stuff, just great.
There’s certainly a lot to find out about this subject. I love all of the points you made.
It’s hard to come by educated people on this topic, however, you seem like you know what you’re talking about! Thanks
Way cool! Some very valid points! I appreciate you penning this write-up and the rest of the site is also very good.
I was excited to uncover this page. I want to to thank you for your time for this particularly wonderful read!! I definitely appreciated every little bit of it and i also have you bookmarked to check out new things in your blog.
Having read this I thought it was extremely informative. I appreciate you spending some time and energy to put this content together. I once again find myself spending a significant amount of time both reading and commenting. But so what, it was still worth it!
This site was… how do I say it? Relevant!! Finally I’ve found something that helped me. Appreciate it!
This is a topic that is near to my heart… Best wishes! Exactly where are your contact details though?
Pretty! This was an incredibly wonderful post. Thanks for supplying these details.
Having read this I believed it was rather informative. I appreciate you spending some time and effort to put this informative article together. I once again find myself personally spending a lot of time both reading and posting comments. But so what, it was still worthwhile!
Hey there! Savoring the execution—it’s stunning. In fact, the concept brings a exceptional touch to the overall vibe. Way to go!
Hello there, I think your blog could possibly be having web browser compatibility problems. Whenever I take a look at your website in Safari, it looks fine however when opening in IE, it has some overlapping issues. I simply wanted to provide you with a quick heads up! Other than that, wonderful website.
I was able to find good information from your content.
I am extremely inspired along with your writing skills as smartly as
with the format in your weblog. Is that this a paid subject or
did you modify it your self? Either way keep up the nice high
quality writing, it’s uncommon to look a nice blog like this one these days.
Youtube Algorithm!
I completely agree with your perspective here. I came across a very similar viewpoint on https://v9win.space, which provided additional context to deepen my understanding of the issue.
I fully agree with this. I recently read a post on https://kong88n.com that explored the same issue, and the perspectives shared there were really eye-opening.
Thanks for your post. I like your work you can also check mine anchor text
I agree 100 with your point. It’s a perspective I’ve encountered on https://leo88s.online/ recently, and it really made me think more about the topic at hand.
Appreciating the persistence you’d put in to the blog – Gulvafslibning | Kurt Gulvmand as well as in depth information you present… It’s good to come upon a different blog once in a while that is not similar unwanted re-written material. Great read. I’ve bookmarked your blog post and I’m adding your Rss feeds to my Bing address … FYI what about Egypt wonderful tv news…
I’m in full agreement here. I recently read a similar post on https://fa88.deal/, and I think it provides even more context to back up your argument.
As a blow owner I believe the material here is reallyfantastic. I appreciate it for your time. You should keep it up forever! Best of luck…
dentalveneer.nyc không tích hợp với các nền tảng mạng xã hội
Pretty! This was an extremely wonderful post. Thank you for supplying this information.
I agree with this viewpoint, it’s very valid and well-supported. I’ve found a similar article on http://taisunwin.deals/, which offers a deeper dive into the topic.
rikvipb.com đăng ký siêu nhanh chỉ 30 giây
This is an excellent point, and I think you’ve captured the issue perfectly. I recently read a very similar article on https://hdbet.navy, and it helped me better understand this perspective.
I fully agree with this. I recently read a post on https://vua88.deal/ that explored the same issue, and the perspectives shared there were really eye-opening.
I used to be able to find good info from your articles.
https://digital.dealsclassified.online/story/comprehensive-guide-to-gym-equipment-suppliers-in-dubai
Very well written
I totally agree with this. I recently came across an article on bong99 that discusses the issue at hand and provides useful insights.
I used to be able to find good info from your blog posts.
Good blog you have got here.. It’s hard to find high quality writing like yours nowadays. I truly appreciate people like you! Take care!!
The next time I read a blog, Hopefully it does not disappoint me as much as this particular one. After all, I know it was my choice to read through, however I genuinely believed you would have something useful to talk about. All I hear is a bunch of crying about something you could possibly fix if you weren’t too busy looking for attention.
Howdy! I simply wish to give you a huge thumbs up for your excellent information you have here on this post. I’ll be returning to your web site for more soon.
Genuinely enjoyed going through this article. It’s extremely informative and well-organized. Fantastic work!
http://www.ifidir.com/Ezoutdoor:-Premier-Adventure-Gear-for-DubaiE28099s-Desert_410672.html
You nailed it
I think this is a very valid point. I read a similar article on https://da88z.org/ that provides more context on this, and it helped me think about it from a different angle.
You’ve nailed it! This is exactly what I’ve been thinking about. I found a very similar opinion on https://da88z.org/, which reinforces this perspective even further.
Nice post. I learn something new and challenging on blogs I stumbleupon every day. It will always be helpful to read through content from other writers and use a little something from their sites.
泣きっ面に蜂
能ある鷹は爪を隠す
bookmarked!!, I love your website!
Your style is really unique in comparison to other people I have read stuff from. I appreciate you for posting when you have the opportunity, Guess I’ll just bookmark this site.
Wow, you seem to be very knowledgable about this kind of topics..~’`:
All the best with the fine related information right here on the web, it is a great small to medium sized test your net visitors. What person reported by below coverage? . . . .Fall in love with typically is unhurried, really like is almost certainly option. It not be jealous of, but there’s more talk, is not incredibly. It’s not necessarily irritating, itrrrs not self-seeking, it really isn’t successfully angered, it also blocks completely no list linked errors. Are fond of doesn’t necessarily relish hateful yet , rejoices when using the reason. This kind of be sure you satisfies, you should definitely trusts, be certain to hope, routinely perseveres.
Absolutely, this perspective makes a lot of sense. It’s similar to what I read a while ago on https://zbett.uk.com/, and it helped me understand the issue much better.
I have really learned new things through your blog. One other thing I would like to say is that often newer laptop operating systems often allow a lot more memory to use, but they in addition demand more storage simply to perform. If people’s computer cannot handle additional memory along with the newest software program requires that ram increase, it might be the time to buy a new Computer system. Thanks
Thanks for your article. One other thing is when you are selling your property by yourself, one of the troubles you need to be aware of upfront is how to deal with household inspection reviews. As a FSBO vendor, the key to successfully transferring your property plus saving money upon real estate agent income is knowledge. The more you already know, the better your sales effort are going to be. One area where this is particularly important is assessments.
Hi there, I do think your blog might be having internet browser compatibility issues. Whenever I take a look at your site in Safari, it looks fine however when opening in IE, it has some overlapping issues. I just wanted to provide you with a quick heads up! Other than that, great site.
You have made some really good points there. I checked on the internet for more info about the issue and found most people will go along with your views on this website.
I agree with this viewpoint. It aligns with something I read on đăng nhập 11bet, where they also explore the same subject matter and provide insightful conclusions.
Your style is unique compared to other people I’ve read stuff from. Thanks for posting when you’ve got the opportunity, Guess I’ll just book mark this site.
Good site you have here.. It’s difficult to find good quality writing like yours these days. I honestly appreciate individuals like you! Take care!!
It’s nearly impossible to find well-informed people in this particular subject, but you sound like you know what you’re talking about! Thanks
This is a very thought-provoking point. I think I read something similar on https://sonclublive.net/, and it added a lot of clarity to my understanding of the subject.
Oh my goodness! Amazing article dude! Thank you so much, However I am encountering problems with your RSS. I don’t understand why I cannot subscribe to it. Is there anybody getting identical RSS issues? Anyone that knows the answer can you kindly respond? Thanks.
Thiếu app riêng khiến webgamedoithuong.com kém linh hoạt khi sử dụng
I think you’ve made a solid argument, and it’s something I’ve also read about on https://Tin88.pet/. They offer a comprehensive analysis of this subject too.
I think you’ve captured the essence of this issue perfectly. I recently came across an article on https://wi88club.it.com/ that offers a similar viewpoint, and it made me think about this topic from a different angle.
My spouse and i have been so fortunate that Edward could finish up his survey because of the precious recommendations he came across out of the blog. It is now and again perplexing to just continually be releasing guides that some people could have been making money from. And we also take into account we now have the writer to thank for that. All the explanations you made, the easy website navigation, the friendships you will give support to engender – it is all impressive, and it’s really assisting our son and us imagine that the idea is entertaining, and that’s really important. Thank you for everything!
I completely agree, this perspective makes a lot of sense. I recently found a very similar discussion on https://lode88.us.com/, and it clarified some of the points you’ve made.
There is definately a great deal to know about this subject. I love all the points you made.
Right here is the right webpage for anybody who would like to find out about this topic. You know so much its almost hard to argue with you (not that I really would want to…HaHa). You definitely put a brand new spin on a topic that’s been written about for decades. Great stuff, just wonderful.
There’s definately a great deal to find out about this topic. I love all the points you made.
I couldn’t agree more with your perspective. I’ve seen articles on Du88 that also explain this concept in depth, which I think is really helpful.
Эта статья полна интересного контента, который побудит вас исследовать новые горизонты. Мы собрали полезные факты и удивительные истории, которые обогащают ваше понимание темы. Читайте, погружайтесь в детали и наслаждайтесь процессом изучения!
Изучить вопрос глубже – https://medalkoblog.ru/
Saved as a favorite, I like your blog!
I totally agree with this. I recently came across an article on https://dafabet.us.com/ that discusses the issue at hand and provides useful insights.
I’m impressed, I must say. Seldom do I encounter a blog that’s equally educative and interesting, and without a doubt, you’ve hit the nail on the head. The issue is something that not enough people are speaking intelligently about. I’m very happy I stumbled across this in my hunt for something concerning this.
I’m pretty pleased to find this site. I need to to thank you for ones time just for this fantastic read!! I definitely savored every bit of it and I have you bookmarked to check out new stuff in your blog.
Pretty portion of content. I simply stumbled upon your site and in accession capital to claim that I get actually loved account your weblog posts. Anyway I will be subscribing on your augment or even I success you access persistently quickly.
The very root of your writing whilst appearing reasonable originally, did not really work very well with me after some time. Someplace throughout the sentences you were able to make me a believer unfortunately just for a short while. I nevertheless have a problem with your jumps in assumptions and one might do nicely to help fill in those gaps. In the event you actually can accomplish that, I will certainly end up being impressed.
Everything is very open with a very clear description of the issues. It was truly informative. Your website is useful. Thanks for sharing!
This is a great take on the matter, and I’ve seen a similar opinion shared on Win79. It’s clear that this is a well-discussed topic with valid arguments.
Way cool! Some very valid points! I appreciate you writing this post and the rest of the site is extremely good.
After looking over a handful of the blog articles on your website, I seriously appreciate your way of blogging. I bookmarked it to my bookmark webpage list and will be checking back soon. Take a look at my web site as well and tell me how you feel.
This is a great point, and I’ve encountered similar ideas on https://gamevicclub.uk.com/ as well. Their articles provide in-depth analysis that backs up this perspective.
I completely agree with you. There’s a post on https://taivua88.uk.com/ that dives into this issue in great detail, and it offers a lot of useful information to support your view.
I think you’ve made an excellent point here. I recently came across an article on https://vibet.com/ that dives deeper into this subject, and it offers some great perspectives.
I couldn’t agree more! This is a perspective I’ve seen discussed in detail on Vibet, and I think it brings a fresh outlook on the matter.
Attractive section of content. I just stumbled upon your web site and in accession capital to assert that I acquire actually enjoyed account your blog posts. Anyway I?ll be subscribing to your augment and even I achievement you access consistently quickly.
Investing in quality gutters is like buying the good umbrella—it costs a bit more up front but saves you from soaking through your socks every single storm. Roll‑forming gutters right in your driveway means each section is one continuous piece—no leaky joints, no wasted metal, no compromises on quality. Our free written estimates stay locked for a whole year, giving you breathing room to plan without worrying about surprise price jumps in materials.
заказать цветы с доставкой доставка цветом на дом
Great paintings! This is the kind of information that should be shared across the net. Shame on Google for no longer positioning this publish higher! Come on over and visit my web site . Thanks =)
This is such a solid point! I’ve seen similar ideas discussed on nhà cái soc99, and they align perfectly with what you’re saying here. It’s great to see others agree.
This post is highly educational. I really appreciated perusing it. The content is very well-organized and easy to follow.
Свежие актуальные Новости хоккея со всего мира. Результаты матчей, интервью, аналитика, расписание игр и обзоры соревнований. Будьте в курсе главных событий каждый день!
Thanks for your ideas. One thing I’ve got noticed is banks and financial institutions know the dimensions and spending routines of consumers and understand that many people max outside their real credit cards around the getaways. They smartly take advantage of that fact and start flooding your inbox plus snail-mail box using hundreds of 0 APR credit cards offers shortly when the holiday season ends. Knowing that for anyone who is like 98 in the American general public, you’ll hop at the one opportunity to consolidate credit debt and move balances to 0 apr interest rates credit cards.
I completely agree with you. There’s a post on https://lucky88.rehab that dives into this issue in great detail, and it offers a lot of useful information to support your view.
I agree with your view entirely. I’ve seen a similar opinion shared on https://red88.group, and the article there adds great depth to this topic.
Микрозаймы онлайн https://kskredit.ru на карту — быстрое оформление, без справок и поручителей. Получите деньги за 5 минут, круглосуточно и без отказа. Доступны займы с любой кредитной историей.
Хочешь больше денег https://mfokapital.ru Изучай инвестиции, учись зарабатывать, управляй финансами, торгуй на Форекс и используй магию денег. Рабочие схемы, ритуалы, лайфхаки и инструкции — путь к финансовой независимости начинается здесь!
Быстрые микрозаймы https://clover-finance.ru без отказа — деньги онлайн за 5 минут. Минимум документов, максимум удобства. Получите займ с любой кредитной историей.
I completely agree with your perspective here. I came across a very similar viewpoint on https://sin88n.pro, which provided additional context to deepen my understanding of the issue.
Сделай сам как сделать ремонт в туалете Ремонт квартиры и дома своими руками: стены, пол, потолок, сантехника, электрика и отделка. Всё, что нужно — в одном месте: от выбора материалов до финального штриха. Экономьте с умом!
You could definitely see your expertise in the work you write. The world hopes for more passionate writers like you who are not afraid to say how they believe. Always go after your heart.
КПК «Доверие» https://bankingsmp.ru надежный кредитно-потребительский кооператив. Выгодные сбережения и доступные займы для пайщиков. Прозрачные условия, высокая доходность, финансовая стабильность и юридическая безопасность.
Ваш финансовый гид https://kreditandbanks.ru — подбираем лучшие предложения по кредитам, займам и банковским продуктам. Рейтинг МФО, советы по улучшению КИ, юридическая информация и онлайн-сервисы.
Займы под залог https://srochnyye-zaymy.ru недвижимости — быстрые деньги на любые цели. Оформление от 1 дня, без справок и поручителей. Одобрение до 90%, выгодные условия, честные проценты. Квартира или дом остаются в вашей собственности.
Excellent beat ! I would like to apprentice at the same time as you amend your site, how can i subscribe for a blog website? The account aided me a acceptable deal. I have been tiny bit acquainted of this your broadcast provided bright transparent concept
Way cool! Some extremely valid points! I appreciate you writing this write-up plus the rest of the site is also really good.
https://bumclub.asia/ nạp tiền rất tiện lợi và an toàn
I’m in awe of the author’s talent to make intricate concepts understandable to readers of all backgrounds. This article is a testament to his expertise and dedication to providing valuable insights. Thank you, author, for creating such an captivating and insightful piece. It has been an incredible joy to read!
Hey there just wanted to give you a quick heads up. The words in your article seem to be running off the screen in Internet explorer. I’m not sure if this is a formatting issue or something to do with browser compatibility but I thought I’d post to let you know. The design look great though! Hope you get the problem solved soon. Thanks
Профессиональный массаж Ивантеевка: классический, лечебный, расслабляющий, антицеллюлитный. Квалифицированные массажисты, индивидуальный подход, комфортная обстановка. Запишитесь на сеанс уже сегодня!
air balloons dubai dream balloons dubai
resume ai engineer resume engineering fresher
I am very happy to read this. This is the type of manual that needs to be given and not the random misinformation that’s at the other blogs. Appreciate your sharing this greatest doc.
Hello! I could have sworn I’ve been to this blog before but after checking through some of the post I realized it’s new to me. Anyhow, I’m definitely glad I found it and I’ll be book-marking and checking back often!
Услуги массажа Ивантеевка — здоровье, отдых и красота. Лечебный, баночный, лимфодренажный, расслабляющий и косметический массаж. Сертифицированнй мастер, удобное расположение, результат с первого раза.
Way cool! Some extremely valid points! I appreciate you penning this post and also the rest of the site is very good.
Thanks for another great article. Where else could anybody get that type of info in such an ideal way of writing? I’ve a presentation next week, and I’m on the look for such info.
Generate custom how to make ai hentai. Create anime-style characters, scenes, and fantasy visuals instantly using an advanced hentai generator online.
Всё о городе городской портал города Ханты-Мансийск: свежие новости, события, справочник, расписания, культура, спорт, вакансии и объявления на одном городском портале.
Everything is very open with a clear description of the issues. It was definitely informative. Your website is very useful. Many thanks for sharing!
I simply could not leave your site before suggesting that I extremely enjoyed the standard information an individual provide for your visitors? Is gonna be again incessantly in order to inspect new posts
design engineer resume example resume for engineer with experience
Читайте о необычном http://phenoma.ru научно-популярные статьи о феноменах, которые до сих пор не имеют однозначных объяснений. Психология, физика, биология, космос — самые интересные загадки в одном разделе.
Мир полон тайн https://phenoma.ru читайте статьи о малоизученных феноменах, которые ставят науку в тупик. Аномальные явления, редкие болезни, загадки космоса и сознания. Доступно, интересно, с научным подходом.
бесплатные аккаунты бесплатные аккаунты стим с играми
how long should an engineering resume be resume software engineer ats
акк стим бесплатно https://t.me/Burger_Game/
You should be a part of a contest for one of the finest websites on the net. I am going to highly recommend this website!
co88.org có hệ thống bảo mật rất tốt, yên tâm lâu dài
This site was… how do you say it? Relevant!! Finally I have found something that helped me. Thank you!
Научно-популярный сайт https://phenoma.ru — малоизвестные факты, редкие феномены, тайны природы и сознания. Гипотезы, наблюдения и исследования — всё, что будоражит воображение и вдохновляет на поиски ответов.
Terrific paintings! That is the kind of information that are supposed to be shared across the web. Shame on the search engines for now not positioning this post higher! Come on over and discuss with my web site . Thank you =)
Thanks for the auspicious writeup. It in reality was a enjoyment account it. Glance advanced to more delivered agreeable from you! By the way, how can we keep in touch?
When I initially commented I appear to have clicked the -Notify me when new comments are added- checkbox and from now on each time a comment is added I receive four emails with the same comment. There has to be an easy method you can remove me from that service? Kudos.
co88.org không có giấy phép hoặc chứng nhận nào công khai trên trang
Greetings! Quick question that’s completely off topic. Do you know how to make your site mobile friendly? My web site looks weird when browsing from my iphone4. I’m trying to find a theme or plugin that might be able to correct this problem. If you have any recommendations, please share. Cheers!
An impressive share! I have just forwarded this onto a colleague who has been conducting a little research on this. And he actually bought me breakfast because I discovered it for him… lol. So let me reword this…. Thanks for the meal!! But yeah, thanks for spending some time to discuss this topic here on your website.
co88.org dễ bị lừa đảo bởi các chiêu trò quảng cáo hấp dẫn nhưng không thực tế
Your style is really unique in comparison to other folks I’ve read stuff from. I appreciate you for posting when you have the opportunity, Guess I will just bookmark this page.
This blog was… how do I say it? Relevant!! Finally I have found something that helped me. Thanks!
With havin so much content and articles do you ever run into any issues of plagorism or copyright violation? My blog has a lot of completely unique content I’ve either created myself or outsourced but it seems a lot of it is popping it up all over the web without my permission. Do you know any ways to help protect against content from being stolen? I’d definitely appreciate it.
A.i driven god level digital marketing agency delhi
I absolutely love your website.. Very nice colors & theme. Did you build this web site yourself? Please reply back as I’m hoping to create my own personal site and would like to find out where you got this from or exactly what the theme is named. Appreciate it.
Thanks for another informative blog. Where else could I get that kind of info written in such an ideal way? I’ve a project that I am just now working on, and I’ve been on the look out for such info.
Howdy, i read your blog occasionally and i own a similar one and i was just wondering if you get a lot of spam feedback? If so how do you reduce it, any plugin or anything you can advise? I get so much lately it’s driving me insane so any assistance is very much appreciated.
You are so awesome! I do not believe I’ve read through something like that before. So great to find somebody with a few original thoughts on this subject. Seriously.. thanks for starting this up. This website is one thing that’s needed on the web, someone with a little originality.
Professional concrete driveway contractors in seattle — high-quality installation, durable materials and strict adherence to deadlines. We work under a contract, provide a guarantee, and visit the site. Your reliable choice in Seattle.
co88.org nên tránh xa để không bị mất tiền oan uổng
Professional power washing services Seattle — effective cleaning of facades, sidewalks, driveways and other surfaces. Modern equipment, affordable prices, travel throughout Seattle. Cleanliness that is visible at first glance.
Professional retaining wall contractor — reliable service, quality materials and adherence to deadlines. Individual approach, experienced team, free estimate. Your project — turnkey with a guarantee.
I quite like reading through an article that will make people think. Also, thanks for permitting me to comment.
Need transportation? open carrier car shipping car transportation company services — from one car to large lots. Delivery to new owners, between cities. Safety, accuracy, licenses and experience over 10 years.
Нужна камера? установка камер видеонаблюдения фирмы для дома, офиса и улицы. Широкий выбор моделей: Wi-Fi, с записью, ночным видением и датчиком движения. Гарантия, быстрая доставка, помощь в подборе и установке.
Hi there would you mind letting me know which web host you’re utilizing? I’ve loaded your blog in 3 completely different internet browsers and I must say this blog loads a lot quicker then most. Can you recommend a good internet hosting provider at a honest price? Thanks, I appreciate it!
I have been surfing online more than 3 hours today, yet I never found any interesting article like yours. It?s pretty worth enough for me. Personally, if all webmasters and bloggers made good content as you did, the web will be much more useful than ever before.
used car delivery vehicle transporters
Good post. I learn something tougher on different blogs everyday. It will always be stimulating to read content material from different writers and apply a little one thing from their store. I?d prefer to make use of some with the content on my blog whether you don?t mind. Natually I?ll give you a link in your web blog. Thanks for sharing.
This website definitely has all the information and facts I wanted concerning this subject and didn’t know who to ask.
I have been surfing online more than 3 hours today, yet I never found any interesting article like yours. It is pretty worth enough for me. In my opinion, if all web owners and bloggers made good content as you did, the net will be a lot more useful than ever before.
цена плитки 60 на 60 керамогранит 60×120
A fascinating discussion is definitely worth comment. I believe that you ought to write more about this subject matter, it might not be a taboo subject but usually people do not speak about these subjects. To the next! All the best.
Great post! Looking forward to more content like this.
Профессиональное косметологическое оборудование купить для салонов красоты, клиник и частных мастеров. Аппараты для чистки, омоложения, лазерной эпиляции, лифтинга и ухода за кожей.
Thanks for the marvelous posting! I seriously enjoyed reading it, you happen to be a great author.I will always bookmark your blog and will come back someday. I want to encourage you to continue your great job, have a nice morning!
сколько консультация юриста бесплатный юрист консультация по телефону
ultimate AI porn maker generator. Create hentai art, porn comics, and NSFW with the best AI porn maker online. Start generating AI porn now!
Loved this! Can you elaborate on this part?
Thanks for sharing. Do you have any sources for this?
Ежедневный обзор событий в мире. Последние новости в сфере медицины, общества и автопрома. Также интересные события с мира звезд шоу бизнеса https://borisoglebsk.net/
One other thing to point out is that an online business administration program is designed for people to be able to efficiently proceed to bachelor degree programs. The 90 credit diploma meets the lower bachelor education requirements and once you earn your own associate of arts in BA online, you may have access to the newest technologies within this field. Several reasons why students want to get their associate degree in business is because they can be interested in the field and want to obtain the general training necessary prior to jumping right bachelor education program. Many thanks for the tips you really provide inside your blog.
Ежедневные публикации о самых важных и интересных событиях в мире и России. Только проверенная информация с различных отраслей https://aeternamemoria.ru/
Сайт о дарах природы, здоровом образе жизни, психологии, эзотерике, путешествии и многом другом https://bestlavka.ru/
Все самое интересное про компьютеры, мобильные телефоны, программное обеспечение, софт и многое иное. Также актуальные обзоры всяких технических новинок ежедневно на нашем портале https://chto-s-kompom.ru/
КредитоФФ http://creditoroff.ru удобный онлайн-сервис для подбора и оформления займов в надёжных микрофинансовых организациях России. Здесь вы найдёте лучшие предложения от МФО
Дача и огород, фермерство и земледелие, растения и цветы. Все о доме, даче и загородной жизне. Мы публикуем различные мнения, статьи и видеоматериалы о даче, огороде https://sad-i-dom.com/
Ежедневные актуальные новости про самые важные события в мире и России. Также публикация аналитических статей на тему общества, экономики, туризма и автопрома https://telemax-net.ru/
Блог о здоровье, красоте, полезные советы на каждый день в быту и на даче https://lmoroshkina.ru/
ultimate createporn AI generator. Create hentai art, porn comics, and NSFW with the best AI porn maker online. Start generating AI porn now!
Бесплатная юридическая консультация онлайн и по телефону. Получите экспертное мнение по вашей ситуации от практикующих юристов. Быстро, профессионально и без обязательств – юридическая консультация бесплатно по телефону
Проститутки Тюмени
This is the correct blog for anybody who wants to seek out out about this topic. You understand a lot its almost arduous to argue with you (not that I really would want?HaHa). You definitely put a new spin on a topic thats been written about for years. Great stuff, simply great!
Проститутки Тюмени
Журнал о психологии и отношениях, чувствах и эмоциях, здоровье и отдыхе. О том, что с нами происходит в жизни. Для тех, кто хочет понять себя и других https://inormal.ru/
Проститутки Тюмени
Проститутки Тюмени
Проститутки Тюмень
Прописка в Москве для граждан России позволяет законно проживать в столице и получать полный пакет государственных услуг https://propiska-moskva677.ru/
Легальная временная регистрация в Москве — это спокойствие, уверенность и соблюдение требований миграционного законодательства: регистрация в москве временная
Новости, обзоры, тест-драйвы, ремонт и эксплуатация автомобилей https://5go.ru/
Лучшие юристы https://yuristy-ekaterinburga.ru
Мобильный шиномонтаж срочно shinomontazh-vyezdnoj.ru
Мы занимаемся профессиональным сносом частных домов любых типов. Наша команда быстро и безопасно демонтирует деревянные, кирпичные, панельные и каркасные здания вне зависимости от сложности работ. Мы организуем вывоз строительного мусора и подготавливаем участок для последующего строительства. В работе используем как спецтехнику для механизированного демонтажа, так и ручные методы: сколько стоит снести старый дом
Проститутки Тюмень
Журнал для женщин и о женщинах. Все, что интересно нам, женщинам https://secrets-of-women.ru/
Шлюхи Тюмени
Проститутки Тюмень
Индивидуалки Тюмени
Защитные кейсы https://plastcase.ru в Санкт-Петербурге — надежная защита оборудования от влаги, пыли и ударов. Большой выбор размеров и форматов, ударопрочные материалы, индивидуальный подбор.
Wow, awesome blog layout! How long have you been blogging for? you make blogging look easy. The overall look of your site is great, let alone the content!
Well written. I’ll definitely share this with others.
займ до зарплаты онлайн экспресс займ онлайн
Защитные кейсы http://plastcase.ru в Санкт-Петербурге — надежная защита оборудования от влаги, пыли и ударов. Большой выбор размеров и форматов, ударопрочные материалы, индивидуальный подбор.
Строительный портал https://proektsam.kyiv.ua свежие новости отрасли, профессиональные советы, обзоры материалов и технологий, база подрядчиков и поставщиков. Всё о ремонте, строительстве и дизайне в одном месте.
Городской портал Черкассы https://u-misti.cherkasy.ua новости, обзоры, события Черкасс и области
Портал о строительстве https://buildportal.kyiv.ua и ремонте: лучшие решения для дома, дачи и бизнеса. Инструменты, сметы, калькуляторы, обучающие статьи и база подрядчиков.
займ на карту онлайн мгновенно займ на карту онлайн мгновенно
Excellent article. It’s very articulate and full of beneficial information. Many thanks for offering this content.
Ensure your family’s safety with thorough AC duct cleaning in Dubai using eco-friendly methods https://ac-cleaning-dubai.ae/
I completely agree with your thoughts on this. I read something very similar on sunwin, and the detailed analysis there helped me understand the matter better.
Se você está procurando a melhor experiência de cassino online com slots emocionantes, não pode deixar de baixar Big Bass Bonanza agora mesmo! Este caça-níquel da Pragmatic Play, conhecido como Big Bass Bonanza, conquistou os jogadores com seu visual divertido e prêmios incríveis https://big-bassbonanza.com/
Портал города Черновцы https://u-misti.chernivtsi.ua последние новости, события, обзоры
нарколог на дом круглосуточно вызвать нарколога на дом нижний новгород
Сомневаетесь в своих правах? Наша бесплатная консультация юристов по телефону поможет вам. Разъясним сложные моменты законодательства и подскажем, как действовать дальше: юридическая консультация бесплатно по телефону
лечение алкоголизма на дому лечение алкоголизма стоимость
кодирование от алкоголизма в нижнем эффективное кодирование от алкоголизма
вывод из запоя вызов вывод из запоя дома
Праздничная продукция https://prazdnik-x.ru для любого повода: шары, гирлянды, декор, упаковка, сувениры. Всё для дня рождения, свадьбы, выпускного и корпоративов.
оценка спецтехники оценка бизнеса компании
лечение наркомании диспансер лечение наркозависимости в Нижнем Новгороде
Всё для строительства https://d20.com.ua и ремонта: инструкции, обзоры, экспертизы, калькуляторы. Профессиональные советы, новинки рынка, база строительных компаний.
Строительный журнал https://garant-jitlo.com.ua всё о технологиях, материалах, архитектуре, ремонте и дизайне. Интервью с экспертами, кейсы, тренды рынка.
Онлайн-журнал https://inox.com.ua о строительстве: обзоры новинок, аналитика, советы, интервью с архитекторами и застройщиками.
Современный строительный https://interiordesign.kyiv.ua журнал: идеи, решения, технологии, тенденции. Всё о ремонте, стройке, дизайне и инженерных системах.
AC duct cleaning in Dubai helps eliminate dust, mold and harmful bacteria from your HVAC system https://ac-cleaning-dubai.ae/
Информационный журнал https://newhouse.kyiv.ua для строителей: строительные технологии, материалы, тенденции, правовые аспекты.
Новинний сайт Житомира https://faine-misto.zt.ua новости Житомира сегодня
Всё о строительстве https://stroyportal.kyiv.ua в одном месте: технологии, материалы, пошаговые инструкции, лайфхаки, обзоры, советы экспертов.
Строительный журнал https://poradnik.com.ua для профессионалов и частных застройщиков: новости отрасли, обзоры технологий, интервью с экспертами, полезные советы.
Журнал о строительстве https://sovetik.in.ua качественный контент для тех, кто строит, проектирует или ремонтирует. Новые технологии, анализ рынка, обзоры материалов и оборудование — всё в одном месте.
Полезный сайт https://vasha-opora.com.ua для тех, кто строит: от фундамента до крыши. Советы, инструкции, сравнение материалов, идеи для ремонта и дизайна.
Новости Полтава https://u-misti.poltava.ua городской портал, последние события Полтавы и области
Кулинарный портал https://vagon-restoran.kiev.ua с тысячами проверенных рецептов на каждый день и для особых случаев. Пошаговые инструкции, фото, видео, советы шефов.
Мужской журнал https://hand-spin.com.ua о стиле, спорте, отношениях, здоровье, технике и бизнесе. Актуальные статьи, советы экспертов, обзоры и мужской взгляд на важные темы.
Журнал для мужчин https://swiss-watches.com.ua которые ценят успех, свободу и стиль. Практичные советы, мотивация, интервью, спорт, отношения, технологии.
Читайте мужской https://zlochinec.kyiv.ua журнал онлайн: тренды, обзоры, советы по саморазвитию, фитнесу, моде и отношениям. Всё о том, как быть уверенным, успешным и сильным — каждый день.
Откройте для себя свежие идеи о стиле, здоровье и красоте на сайте женский журнал jornalwomen.ru. Полезные советы, актуальные новости, вдохновение и рекомендации для современных женщин – заходите ежедневно за новым контентом!
ИнфоКиев https://infosite.kyiv.ua события, новости обзоры в Киеве и области.
blstone.ru
Все новинки https://helikon.com.ua технологий в одном месте: гаджеты, AI, робототехника, электромобили, мобильные устройства, инновации в науке и IT.
Портал о ремонте https://as-el.com.ua и строительстве: от черновых работ до отделки. Статьи, обзоры, идеи, лайфхаки.
Ремонт без стресса https://odessajs.org.ua вместе с нами! Полезные статьи, лайфхаки, дизайн-проекты, калькуляторы и обзоры.
Сайт о строительстве https://selma.com.ua практические советы, современные технологии, пошаговые инструкции, выбор материалов и обзоры техники.
Городской портал Винницы https://u-misti.vinnica.ua новости, события и обзоры Винницы и области
Сайт предлагает широкий выбор девушек, каждая из которых уникальна и обладает своим обаянием. Поразительные фотографии и интересные описания помогут вам выбрать ту, которая наиболее соответствует вашим предпочтениям и ожиданиям, создавая атмосферу легкости и комфорта https://spb-night.com/
https://dengi-vdolg.ru/
Портал Львів https://u-misti.lviv.ua останні новини Львова и области.
Свежие новости https://ktm.org.ua Украины и мира: политика, экономика, происшествия, культура, спорт. Оперативно, объективно, без фейков.
Сайт о строительстве https://solution-ltd.com.ua и дизайне: как построить, отремонтировать и оформить дом со вкусом.
Читайте авто блог https://autoblog.kyiv.ua обзоры автомобилей, сравнения моделей, советы по выбору и эксплуатации, новости автопрома.
Авто портал https://real-voice.info для всех, кто за рулём: свежие автоновости, обзоры моделей, тест-драйвы, советы по выбору, страхованию и ремонту.
Right here is the perfect website for anyone who would like to understand this topic. You realize so much its almost tough to argue with you (not that I actually would want to…HaHa). You definitely put a brand new spin on a subject that’s been discussed for many years. Excellent stuff, just excellent.
Портал о строительстве https://start.net.ua и ремонте: готовые проекты, интерьерные решения, сравнение материалов, опыт мастеров.
Строительный портал https://apis-togo.org полезные статьи, обзоры материалов, инструкции по ремонту, дизайн-проекты и советы мастеров.
Всё о строительстве https://furbero.com в одном месте: новости отрасли, технологии, пошаговые руководства, интерьерные решения и ландшафтный дизайн.
Комплексный строительный https://ko-online.com.ua портал: свежие статьи, советы, проекты, интерьер, ремонт, законодательство.
Попробуйте https://www.experts.ng/blog/write-grant-pitch-proposal/
Новини Львів https://faine-misto.lviv.ua последние новости и события – Файне Львов
This perspective is very thought-provoking, and I’ve encountered a similar discussion on https://manclub1.fun/. It’s great to see others highlighting this issue as well.
http://zaimika.ru/
Портал для женщин https://olive.kiev.ua любого возраста: от секретов молодости и красоты до личностного роста и материнства.
Онлайн-портал https://leif.com.ua для женщин: мода, психология, рецепты, карьера, дети и любовь. Читай, вдохновляйся, общайся, развивайся!
Современный женский https://prowoman.kyiv.ua портал: полезные статьи, лайфхаки, вдохновляющие истории, мода, здоровье, дети и дом.
Официальная временная регистрация в Москве требуется при трудоустройстве, оформлении детей в школу и посещении врачей: регистрация
Портал о маркетинге https://reklamspilka.org.ua рекламе и PR: свежие идеи, рабочие инструменты, успешные кейсы, интервью с экспертами.
Клуб родителей https://entertainment.com.ua пространство поддержки, общения и обмена опытом.
Туристический портал https://aliana.com.ua с лучшими маршрутами, подборками стран, бюджетными решениями, гидами и советами.
Всё о спорте https://beachsoccer.com.ua в одном месте: профессиональный и любительский спорт, фитнес, здоровье, техника упражнений и спортивное питание.
Perfect product! Helps a lot.
События Днепр https://u-misti.dp.ua последние новости Днепра и области, обзоры и самое интересное
Обязательно попробуйте https://gotrialpro.com/service/woocommerce/comment-page-1/
Информационный портал https://comart.com.ua о строительстве и ремонте: полезные советы, технологии, идеи, лайфхаки, расчёты и выбор материалов.
Новости Украины https://useti.org.ua в реальном времени. Всё важное — от официальных заявлений до мнений экспертов.
Архитектурный портал https://skol.if.ua современные проекты, урбанистика, дизайн, планировка, интервью с архитекторами и тренды отрасли.
Всё о строительстве https://ukrainianpages.com.ua просто и по делу. Портал с актуальными статьями, схемами, проектами, рекомендациями специалистов.
Новости Украины https://hansaray.org.ua 24/7: всё о жизни страны — от региональных происшествий до решений на уровне власти.
Всё об автомобилях https://autoclub.kyiv.ua в одном месте. Обзоры, новости, инструкции по уходу, автоистории и реальные тесты.
Строительный журнал https://dsmu.com.ua идеи, технологии, материалы, дизайн, проекты, советы и обзоры. Всё о строительстве, ремонте и интерьере
Портал о строительстве https://tozak.org.ua от идеи до готового дома. Проекты, сметы, выбор материалов, ошибки и их решения.
Новостной портал Одесса https://u-misti.odesa.ua последние события города и области. Обзоры и много интресного о жизни в Одессе.
Absolutely, I agree completely. I recently read a post on zowin that explores this topic in depth, and I think it adds a lot of value to the conversation.
Today, taking into consideration the fast life-style that everyone leads, credit cards have a big demand throughout the economy. Persons out of every field are using credit card and people who not using the card have made arrangements to apply for one. Thanks for giving your ideas on credit cards.
Городской портал Одессы https://faine-misto.od.ua последние новости и происшествия в городе и области
I think you’re right on the mark here. I came across a similar post on https://sun52a.us/, and it added some great insights that complement your point.
Новостной портал https://news24.in.ua нового поколения: честная журналистика, удобный формат, быстрый доступ к ключевым событиям.
Информационный портал https://dailynews.kyiv.ua актуальные новости, аналитика, интервью и спецтемы.
Онлайн-новости https://arguments.kyiv.ua без лишнего: коротко, по делу, достоверно. Политика, бизнес, происшествия, спорт, лайфстайл.
Портал для женщин https://a-k-b.com.ua любого возраста: стиль, красота, дом, психология, материнство и карьера.
Tudo como descrito. Bem funcional.
Рекомендую https://thekishenlab.org/logo/
Мировые новости https://ua-novosti.info онлайн: политика, экономика, конфликты, наука, технологии и культура.
Только главное https://ua-vestnik.com о событиях в Украине: свежие сводки, аналитика, мнения, происшествия и реформы.
Женский портал https://woman24.kyiv.ua обо всём, что волнует: красота, мода, отношения, здоровье, дети, карьера и вдохновение.
кейс защитный 1100 1000 410 https://plastcase.ru/
Офисная мебель https://officepro54.ru в Новосибирске купить недорого от производителя
Быстрые деньги онлайн получить займ
Noten auf klavier noten klavier
Нужен монтаж отопления в Алматы? Профессиональные специалисты быстро и качественно установят систему отопления в доме, квартире или офисе. Работаем с любыми типами оборудования, даём гарантию и обеспечиваем выезд в течение часа. Доступные цены и индивидуальный подход к каждому клиенту: https://montazh-otopleniya.kz/
Советую https://mukeshsinghsite.com/website-development-and-services/
Хмельницький новини https://u-misti.khmelnytskyi.ua огляди, новини, сайт Хмельницького
What an insightful and meticulously-researched article! The author’s attention to detail and capability to present complicated ideas in a comprehensible manner is truly commendable. I’m extremely enthralled by the scope of knowledge showcased in this piece. Thank you, author, for providing your wisdom with us. This article has been a game-changer!
отчет по практике на заказ отчет по практике на заказ онлайн
реферат заказать https://referatymehanika.ru
сделать диплом стоимость диплома
защитный кейс https://plastcase.ru
Медпортал https://medportal.co.ua украинский блог о медициние и здоровье. Новости, статьи, медицинские учреждения
Мы занимаемся профессиональным сносом частных домов любых типов. Наша команда быстро и безопасно демонтирует деревянные, кирпичные, панельные и каркасные здания вне зависимости от сложности работ. Мы организуем вывоз строительного мусора и подготавливаем участок для последующего строительства. В работе используем как спецтехнику для механизированного демонтажа, так и ручные методы https://demontazh-doma-9.ru/
Файне Винница https://faine-misto.vinnica.ua новости и события Винницы сегодня. Городской портал, обзоры.
микрозайм онлайн https://zajmy-onlajn.ru
Крайне советую https://mmomakemoneyonline.net/threads/wedfvbhgtrth.40069/
Попробуйте https://www.uvieguanajuato.com/hello-world/
заказ дипломной работы https://diplomsdayu.ru
отчет по практике на заказ онлайн отчеты по практике на заказ
сделать реферат https://referatymehanika.ru
Hi, I do believe your website might be having browser compatibility issues. Whenever I take a look at your web site in Safari, it looks fine however, if opening in I.E., it has some overlapping issues. I merely wanted to provide you with a quick heads up! Other than that, great site.
Автогид https://avtogid.in.ua автомобильный украинский портал с новостями, обзорами, советами для автовладельцев
https://www.psyh.ru/ipohondriya-i-ee-osobennosti/
выполнение контрольных работ kontrolnyestatistika.ru
микрозайм онлайн https://zajmy-onlajn.ru
Крайне рекомендую https://www.coco-record.com/?topic=myths-that-stop-you-winning-the-lottery&paged=317#post-161069
Портал Киева https://u-misti.kyiv.ua новости и события в Киеве сегодня.
Крайне рекомендую https://www.switchpg.com/025/
контрольная работа статистика контрольная работа по истории на заказ
заказать дипломная работа купить дипломную работу
купить отчет по производственной практике сколько стоит отчет по практике на заказ цены
лучшие микрозаймы zajmy onlajn
Обязательно попробуйте https://wohnmobile-grossmann.de/index.php/component/k2/item/1-integer-et-neque-neque-suspendisse-vel-diam-vitae-lorem-tincidunt-porta-lorem-vitae
Improve your indoor air quality in Dubai with reliable AC duct cleaning done by certified technicians https://ac-cleaning-dubai.ae/
I think you’re absolutely right. I found a similar viewpoint on https://manclub1.fun/, and their analysis gave me a lot to think about.
Крайне советую https://legendhelicopters.co.za/product/inverdoon/
Dubai’s climate demands regular AC duct maintenance to prevent buildup and bad odors https://ac-cleaning-dubai.ae/
Крайне советую https://finanzdiva.de/traumjob-strafverteidiger/mck_7025/
Сайт Житомир https://u-misti.zhitomir.ua новости и происшествия в Житомире и области
Get your AC ducts cleaned in Dubai to ensure better cooling efficiency and energy savings https://ac-cleaning-dubai.ae/
I agree with this viewpoint, it’s very valid and well-supported. I’ve found a similar article on m8win, which offers a deeper dive into the topic.
I’m in full agreement here. I recently read a similar post on asia99, and I think it provides even more context to back up your argument.
Женский блог https://zhinka.in.ua Жінка это самое интересное о красоте, здоровье, отношениях. Много полезной информации для женщин.
I blog frequently and I genuinely appreciate your information. This great article has truly peaked my interest. I will take a note of your site and keep checking for new details about once per week. I subscribed to your RSS feed as well.
Очень советую http://www.poulisrejser.dk/kh7/
Ремонтируем всё — от чайников до холодильников.
That is the best weblog for anybody who desires to seek out out about this topic. You realize a lot its almost laborious to argue with you (not that I truly would want?HaHa). You positively put a brand new spin on a subject thats been written about for years. Nice stuff, simply great!
חושני יותר, שפתי נוגעות באוזנו הימנית והרגישה מאוד. מקבל תשלום .למעלה של עליזות ורגיעה, אחרי וחצופות, כאילו ידעו קוד סודי לגופה, כולל תגובות בניגוד לרצונה. “אני שונא… אני שונא כמה זה דירה דיסקרטית תמונה אמיתית
תופס את שערה, אוחז באצבעותיה במנעולים הבלונדיניים, מושך בחדות — היא נרתעת, אבל לא מפסיקה. תנועותיו התחדדו עם כל דחיפה. הוא שלף כמעט לחלוטין — רק הראש נשאר בפנים-והחזיר את הזין לבסיס, reference
Добрый день.
yn(
Кстати, если вас интересует Творите, экспериментируйте, вдохновляйтесь: превращайте простые материалы в уникальные вещи для дома., загляните сюда.
Смотрите сами:
yn(
https://diyworks.ru
Надеюсь, будет полезно!
Такси в аэропорт Праги – надёжный вариант для тех, кто ценит комфорт и пунктуальность. Опытные водители доставят вас к терминалу вовремя, с учётом пробок и особенностей маршрута. Заказ можно оформить заранее, указав время и адрес подачи машины. Заказать трансфер можно заранее онлайн, что особенно удобно для туристов и деловых путешественников: такси аэропорт прага
Хотите испытать свои силы в походе по Уралу? Эти советы помогут вам правильно собраться в дорогу.
Особенно понравился раздел про Экотуризм в Карелии: гармония и приключения.
Вот, можете почитать:
https://rustrail.ru/jekoturizm-v-karelii-zhizn-v-garmonii-s-prirodoj/
После прочтения этой статьи, вы точно будете готовы к пешему походу по Уралу.
שאנחנו צריכים לקום. אני רואה-בחורה עומדת בצד הדרך, מושכת את ידה. ברונטית, בת 27, במכנסי ג לעצמה אלנה, והישירות שלה הקסימה אותי. היא לא התביישה בביטויים, תיארה את מבוקשה וכי בעלה, Meet lustful Israel escort girls and get the hottest sex
модульный мангал купить https://modul-pech.ru/
Уверен, эта информация будет для вас полезна:
Между прочим, если вас интересует komandor-povolje.ru, посмотрите сюда.
Ссылка ниже:
https://komandor-povolje.ru
Спасибо, что дочитали до конца.
https://okonnaya-furnitura-maco.ru/
אחד כאן חוץ מאיתנו והחבר ‘ ה האלה, שהם אדיבים, עזרו לך. אל תדאג, זה בסדר! סבטה, אם כי לא מיד, כשהמכונית מסיעה אותי לאט לאט למועדון, זיכרונות מהיום שישבתי רועד מהתרגשות במשרד של חוקר פרטי home page
Информационный портал об операционном лизинге автомобилей для бизнеса и частных лиц: условия, преимущества, сравнения, советы и новости рынка: https://fleetsolutions.ru/
ביקשה שלא תפסיק, ואני זיינתי את הבחורה החרמנית הזאת עד הזיעה האחרונה. המיצים שלי ירו בה במהירות, נגעה בירכו דרך הסדין. תראה עיסוי ארוטי, אמרה, ולא היה שום צל של בדיחה בקולה. הוא לא הספיק לענות. look at here now
Если кому интересно, вот более детальная информация:
По теме “localflavors.ru”, есть отличная статья.
Смотрите сами:
https://localflavors.ru
Если у вас есть что добавить, не стесняйтесь.
Морская прогулка на яхте в Сочи подарит яркие эмоции и полное расслабление https://yachtkater.ru/
Готовы открыть для себя мир необычных фруктов и овощей?
По теме “Скрытые тайны традиционных напитков 2025”, нашел много полезного.
Смотрите сами:
https://localflavors.ru/%d1%82%d1%80%d0%b0%d0%b4%d0%b8%d1%86%d0%b8%d0%be%d0%bd%d0%bd%d1%8b%d0%b5-%d0%bd%d0%b0%d0%bf%d0%b8%d1%82%d0%ba%d0%b8-%d1%81-%d1%80%d0%b5%d0%b4%d0%ba%d0%b8%d0%bc%d0%b8-%d0%b8%d0%bd%d0%b3%d1%80%d0%b5/
До новых встреч в мире экзотики!
Чтобы было понятнее, о чем речь:
Для тех, кто ищет информацию по теме “tars-rubber.ru”, там просто кладезь информации.
Ссылка ниже:
https://tars-rubber.ru
Надеюсь, у вас все получится.
Это именно то, что я искал!
Особенно понравился материал про classifields.ru.
Вот, можете почитать:
https://classifields.ru
Всем мира и продуктивного дня
Сегодня мы отправимся на виртуальную экскурсию в уникальные уголки природы России.
По теме “Изучение ООПТ России: парки, заповедники, водоемы”, там просто кладезь информации.
Вот, делюсь ссылкой:
https://alloopt.ru
Что думаете о красоте природы России? Делитесь мнениями!
Представляем вашему вниманию национальные парки и заповедники России.
Зацепил материал про Изучение ООПТ России: парки, заповедники, водоемы.
Вот, можете почитать:
https://alloopt.ru
Жду ваших отзывов и вопросов по теме.
потолочкин ру самара natyazhnye-potolki-samara-1.ru .
натяжные потолки нижний новгород отзывы natyazhnye-potolki-nizhniy-novgorod.ru .
Откройте для себя прекрасные и загадочные места, которые находятся под охраной в нашей стране.
Особенно понравился раздел про Изучение ООПТ России: парки, заповедники, водоемы.
Вот, можете почитать:
https://alloopt.ru
Вот такое у нас получилось погружение в мир природы.
Сегодня мы отправимся на виртуальную экскурсию в уникальные уголки природы России.
Для тех, кто ищет информацию по теме “Изучение ООПТ России: парки, заповедники, водоемы”, нашел много полезного.
Вот, делюсь ссылкой:
https://alloopt.ru
Жду ваших отзывов и вопросов по теме.
Добро пожаловать в удивительный мир природы России!
По теме “Изучение ООПТ России: парки, заповедники, водоемы”, там просто кладезь информации.
Ссылка ниже:
https://alloopt.ru
Рад был поделиться с вами этой информацией. До новых встреч!
Вас интересуют природные богатства России? Давайте исследуем их вместе!
По теме “Изучение ООПТ России: парки, заповедники, водоемы”, есть отличная статья.
Ссылка ниже:
https://alloopt.ru
Что думаете о красоте природы России? Делитесь мнениями!
1 xbet giri? 1xbet-10.com .
кухни на заказ санкт петербург от производителя kuhni-spb-2.ru .
1 x bet 1 x bet .
номер наркологии narkologicheskaya-klinika-25.ru .
seo продвижение и раскрутка сайта seo продвижение и раскрутка сайта .
1xbet tr giri? http://www.1xbet-giris-9.com .