CPI Diagnosis: Transportation Up, Shelter Down, Inflation Steady
Welcome to The Observatory. The Observatory is how we at Prometheus monitor the evolution of the economy and financial markets in real-time. The insights provided here are slivers of our research process that are integrated algorithmically into our systems to create rules-based portfolios.
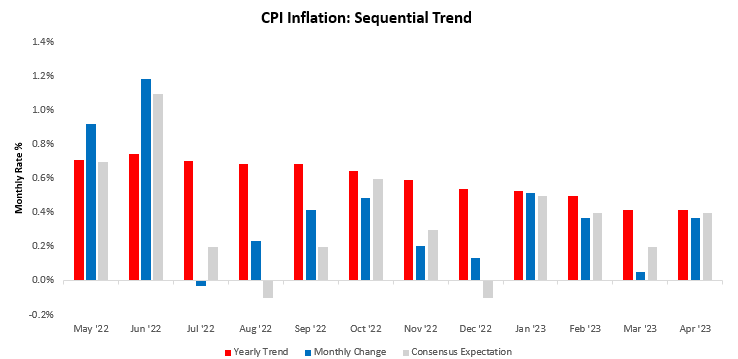
CPI data this morning came in roughly in line with our expectations, along the high end of our range of expected outcomes. CPI inflation increased by 0.37% in April, disappointing consensus expectations of 0.4%. This print contributed to a sequential deceleration in the quarterly trend relative to the yearly trend. Below, we show the monthly evolution of the data relative to its 12-monthly trend and consensus expectations.

The dynamics of this print largely conformed to our expectations, with no category surprising very meaningfully. We show our expectations by component versus the realized outcomes of the print below:
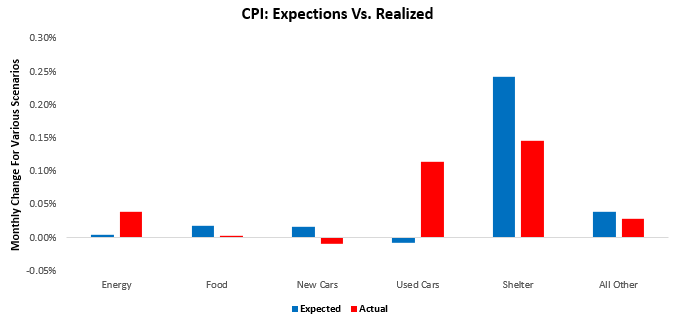
As we can see, the major difference in our compositional expectations versus the outcomes was in the new and used vehicles section. However, this was well-telegraphed by industry dynamics that we track, as we alluded to in our CPI preview:
Additionally, we see some potential for used car prices to surprise to the upside; this could, at the extreme, add about 0.07% to headline CPI, resulting in a surprise if all other components come in in-line with consensus expectations.
This print remains consistent with the themes we outlined in our latest Month In Macro, i.e., that transportation will be a swing factor in determining inflation outcomes. You can read all the details here:
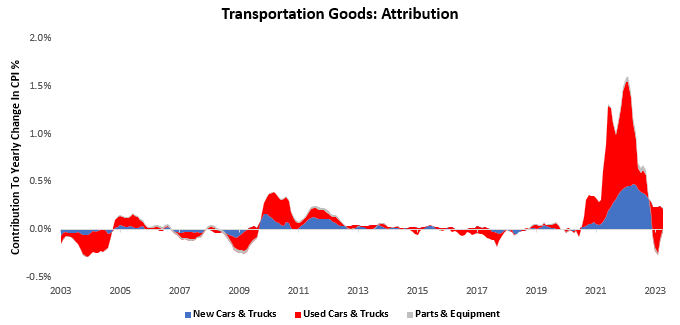
Summarily, there is significant potential for used vehicle deflation to stop and new vehicle inflation to persist, making total vehicle inflation more positive the previously. This change comes alongside a likely persistence of transportation services inflation. The combination of these factors will likely support resilient inflation. Below, we show the big-picture view of these forces, starting with improved vehicle deflation:
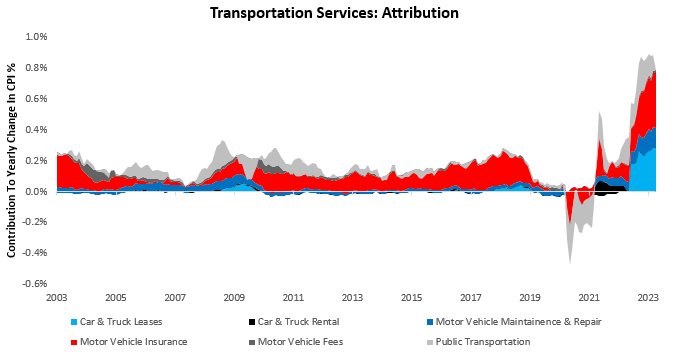
Next, we show transportation services inflation which continues to remain elevated:
Barring recessionary activity in the auto sector, the combination of these factors is likely to be net support to inflation above the Fed’s inflation objectives.
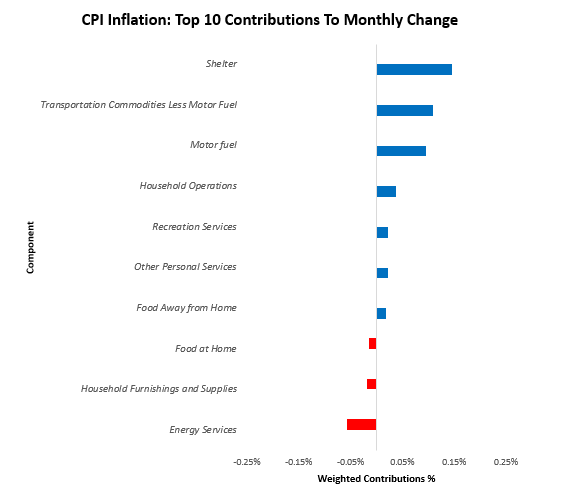
Zooming back into today’s print, the primary drivers of this print were motor fuel (0.1%), energy services (-0.06%), transportation goods(0.11%), shelter (0.15%), & household operations (0.04%). Below, we show the top 10 drivers of the monthly change:
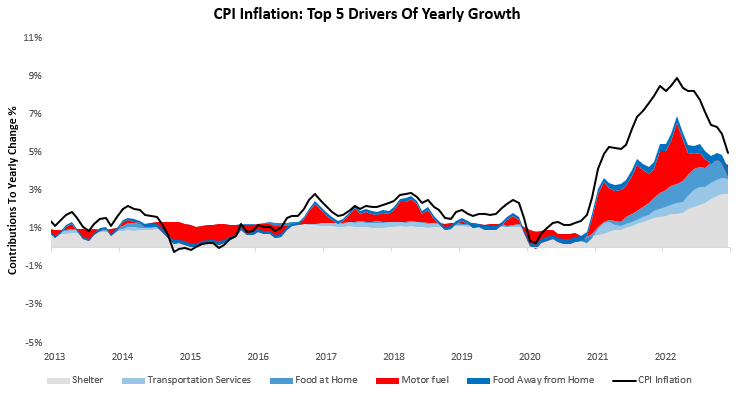
Over the last year, Food at Home (0.62%), Food Away from Home (0.41%), Motor fuel (-0.42%), Shelter (2.8%), & Transportation Services (0.65%). have been the primary drivers of the 4.96% CPI inflation. We show the contributions of these items to yearly changes in total spending below. We think it is important to note the significant contributions of transportation services:
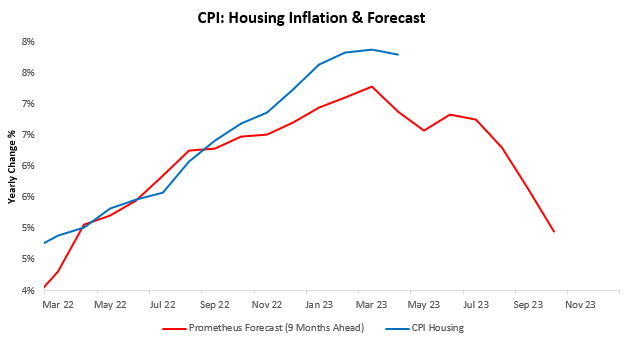
Alongside this inflationary impulse from transportation, we also saw a significant development in the form of disinflationary pressures in the shelter prices. The latest data (along with the last print) suggests that the lagged impacts of housing prices on CPI computation have started to kick in. This turning point shows up modestly in yearly data, but we prefer to remain zoomed out on this change as it is a slow undercurrent:
In magnitude, this potential regime change in housing CPI will overwhelm all other components in terms of the marginal impact on the direction of CPI. However, what we think is important to recognize is that even with a significant amount of housing disinflation, we remain extremely far from the Fed’s objectives. We show the distance from the Fed’s target in historical context below:
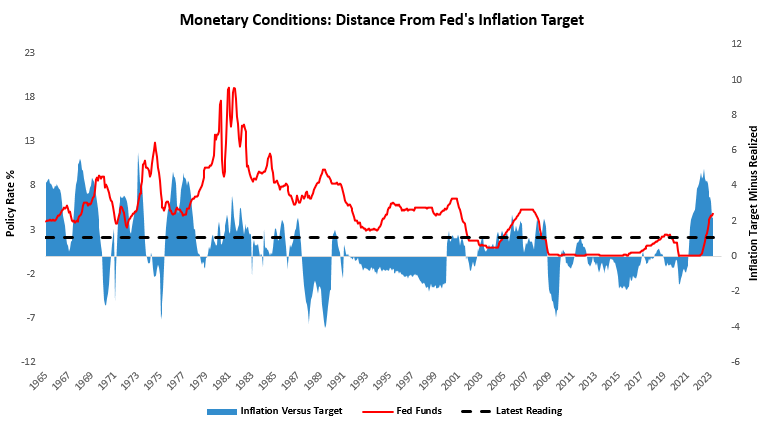
To construct this estimate, we examined decades of Fed transcripts back to the 1960s to understand the Fed’s contemporaneous inflation objectives. We then look at the difference between the Fed’s inflation target and realized inflation, which tells us how loose or tight monetary policy is at a given time. As we can see, we remain quite far from the Fed’s inflation objectives, though much less so relative to a few months ago.
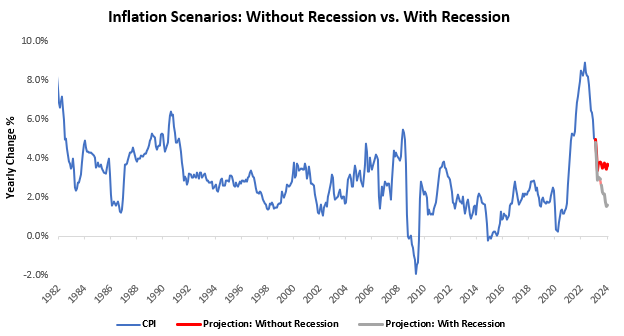
Overall, we continue to think that inflation remains well above the Fed’s objectives, and it looks unlikely to achieve those objectives without recessionary conditions. This latest print places us closer to the red line (inflation without a recession) than the grey one (inflation with a recession):
The Fed will likely have to go further.
They always keep my medication history well-organized.
cost lisinopril price
Impressed with their wide range of international medications.
Always responsive, regardless of time zones.
buying clomid price
Consistently excellent, year after year.
I appreciate the range of payment options they offer.
where buy cheap cipro without dr prescription
Their senior citizen discounts are much appreciated.
Their global outlook is evident in their expansive services.
clomid1day.top
A gem in our community.
A trailblazer in international pharmacy practices.
how can i get generic cytotec without dr prescription
Appreciate their commitment to maintaining global healthcare standards.