Welcome to The Observatory. The Observatory is how we at Prometheus monitor the evolution of the economy and financial markets in real time. The insights provided here are slivers of our research process that are integrated algorithmically into our systems to create rules-based portfolios.
If you haven’t already, check out Episode 5 of the Prometheus Podcast! For this episode, we have another exceptional guest for you- Bob Elliott. Bob is the Co-Founder and CEO of Unlimited- a company that uses machine learning to replicate hedge fund strategies in a low-cost ETF format. Before starting Unlimited, Bob spent over a decade at Bridgewater Associates, one of the largest and most successful macro hedge funds, and was integral to building their systematic process. Bob brings a rich mixture of economic analysis, portfolio construction, and systematic thinking to this episode, which is not to be missed! Aahan & Bob cover almost every aspect of macro in their discussion and provide a rigorous framework for thinking about the current environment. If Alpha was ever available on a podcast, it’s this one!
Now, let’s dive into our observations. Summarily:
-
Nominal activity is still elevated, though it continues to slow.
-
Employment continues to stay extremely strong in response to nominal activity.
-
The combination of high nominal levels of nominal activity and employment brings us incrementally closer to the Fed tightening more than is currently expected.
The Fed remains on the path to tightening financial conditions to cause a nominal activity contraction. Alongside this policy stance, pressures continue to build for the US economy to enter a stagflationary period. Below, we discuss the incremental information we have received pushing us in this direction:
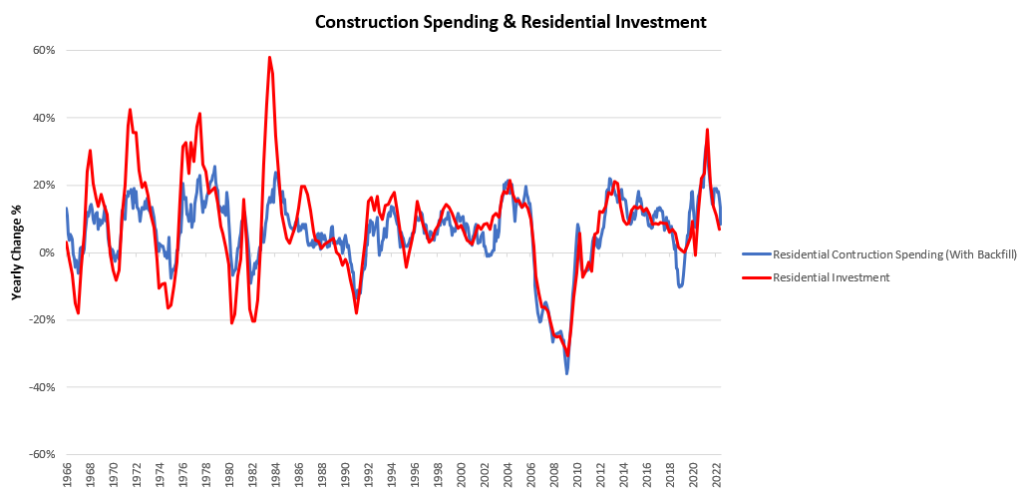
i. Construction spending remains elevated in nominal terms. Total construction Spending came in at 8.6%, a sequential deceleration from the last print. Non-residential spending remains roughly in line with levels seen in the previous year. However, residential spending has begun to weaken significantly. Residential spending is the largest component of construction spending, and plays an important role in GDP. Below, we show residential construction spending versus residential fixed investment:

Residential investment accounts for about 18% of total investment in nominal GDP- which is a critical determinant of GDP and profitability. What we are seeing today in residential construction activity points to continued support for both nominal GDP & profitability but a declining level of support, i.e., high and decelerating nominal growth. This activity bodes well for business profits at the nominal level, but as we have explained many times, real profits are required for future real output. The pressure on future profits remains in place.
ii. ISM PMI data continued to show sequential weakening. Pressure to reduce production grows. Both ISM Manufacturing & Services PMIs showed decelerating sequential data within decelerating trends. These data points continue to pressure future equity market earnings relative to expectations. We show these below:

There remains a significant gap between manufacturing and services readings, which we interpret as consistent with the strength of nominal demand in the services economy. While many use PMIs as real growth indicators, we think of PMIs as detrended nominal growth indicators. This is because PMI surveys do not ask respondents to differentiate between nominal and real output variables, making it harder to tease the implied impact on real economic data. Consequently, we find the mixed readings from PMIs to largely be a function of elevated nominal demand dynamics. Nonetheless, our broad PMI aggregates remain in contractionary territory, suggesting a weak environment ahead for profits:

PMIs are good gauges of the profit cycle as they offer insight into the decisions of purchasing managers, who sit at the intersection of business supply & demand while trying to optimize business output for a given input level. We see in these PMIs is a significant decline in new orders for goods, which is consistent with what we are seeing in the real economic data. Below, we show real manufacturing new orders versus industrial production:

Real manufacturing new orders decreased by -0.01% in August, with durable goods and non-durable goods contributing -0.09% and 0.09%, respectively. On a real basis, we estimate that total manufacturing new orders have decreased -2.66% versus one year ago. Manufacturing new orders are at odds with industrial production, telling us there is pressure on industrial production to fall. Furthermore, PMI data continues to tell us that new orders are likely to stay in a downtrend. We show the new orders & new orders vs. inventories sub-components of our PMI composite below:

The combination of these factors continues to create future headwinds for production, output, and investment which does not bode well for equities or credit.
iii. Employment remains strong, likely pushing the Fed further along its tightening cycle. Nonfarm Payrolls increased 0.21% in September, surprising consensus expectations of 0.17%. This print contributed to a sequential deceleration in the quarterly trend relative to the yearly trend. Below, we show the monthly evolution of the data relative to its 12-monthly trend and consensus expectations:

This incremental information is concerning for the Fed, as the future of inflation will be determined by the balance between the commodities impulse and the trend in services inflation. In the most recent CPI print, we received information that showed us that despite extreme downwards pressures coming from energy prices, headline CPI remained in expansionary territory. We offer the composition of this print below:

The above tells us that there is a widening of inflationary pressures, enough to offset commodity disinflation. Furthermore, there is likely to be a timing mismatch between the two. The inflationary process begins with the demand for commodities and other real assets and goes through the supply chain to the consumer. Food and energy price shocks can be transmitted to the consumer fairly quickly (one to two months, by our estimates), but commodity shocks take more time to make their way into service prices. Below we show commodities and food & energy prices tend to coincide:

In contrast with food and energy, core CPI & PPI are more persistent due to their significant service components. These items reflect contractual obligations that are âmarked-to-marketâ far less than commodity prices. Therefore, as we move further up the supply chain, prices tend to follow stable trajectories, i.e., they are autocorrelated:

These components continue to suggest sustained and entrenched inflationary pressures. Furthermore, we will likely see further support for core CPI from housing prices. In 1984, the government changed their CPI calculations to reflect rents rather than house prices to capture consumer costs better they did so by creating an item called owners’ equivalent rent, which estimates what homeowners would charge were they to rent their homes. However, their methodology included a smoothing process, which resulted in perceived rents (i.e., home prices) passing into CPI with a lag of approximately 20 months. We show this below:

Therefore, even if home prices fell dramatically in the coming months, the methodology would not fully reflect those changes for six to eighteen months. These insights and a multitude of data we received last week continue to tell us that inflationary pressures remain persistent as a function of resilient nominal activity. We highlight these inflationary pressures, as the likely persistence of inflation will cause the Fed to tighten interest rates further than is currently expected by markets. Raising interest rates increasing the cost of borrowing across the economy, dampening credit creation and borrowing- thereby bringing down nominal activity. However, this mechanism can take a while to show its full effect, as debt often carries fixed interest rates, and the impact of higher rates slowly makes its way into new financing and cost structures. Nonetheless, this tool is by no means ineffective, and 74% of disinflationary periods since 1962 have been preceded by hiking cycles. Below, we show periods where interest rate hikes have facilitated lower inflation:

The above visual shows CPI inflation alongside the Federal Funds rates. Additionally, we highlight periods where hiking cycles (persistent increases in Fed Funds) result in falling inflation over the next twelve months. We then highlight three periods that we think are appropriately illustrative of the pressures at play, i.e., that interest rates need to be significantly higher relative to inflation to catalyze lower future inflation. Historically, interest rates have needed to be about 2% above CPI to catalyze decelerating CPI. This gap could be created via higher rates or lower inflation. We find it is typically much more of the priori.e., interest rates need to rise to match an elevated level of inflation if they are to catalyze lower future inflation.
Our current estimates of CPI trend of 6.5%, alongside Fed Funds at 3.25% and Nominal GDP growth of 9%, suggest that the gap between inflation and policy rate remains too large. While this gap will likely be closed by some inflation deceleration, we think there is a strong likelihood that interest rates will have to make up a significant amount as well. Markets are currently pricing in a peak Fed Funds rate of 4.5%, and we think this is the most considerable risk to asset markets. There is significant potential for policy rates to need to exceed these levels, and in this event, they are likely to hurt stocks and bond significantly. These dynamics will unfold over time, and we expect our systems to guide us. Currently, they continue to prefer shorting assets we will offer more guidance on the same in our Week Ahead note.
After a rough start to the week, our Alpha Strategy finished this week roughly flat, maintaining year-to-date gains. We show the year-to-date performance of our Alpha Strategy below:

Stay nimble.