Welcome to The Observatory. The Observatory is how we at Prometheus monitor the evolution of the economy and financial markets in real time. The insights provided here are slivers of our research process that are integrated algorithmically into our systems to create rules-based portfolios.
If you haven’t already, check out Episode 4 of the Prometheus Podcast! For this episode, we have the pleasure of once again hosting Darius Dale, Founder & CEO of 42 Macro. For those of you who missed our previous conversation, we highly recommend you give it a listen for a better understanding of his sophisticated framework (Click here). While in our last conversation, we focused more on mechanics, today we’re going to spend our time discussing the current state of the economy & the outlook for markets. Aahan & Darius traverse the US macro landscape, discussing everything from the Fed & inflation to the reverse repo facility and portfolio strategy. This episode is a must-listen for anyone seeking to manage macro risk during one of the most economically volatile periods in history.
Below are the top observations coming from our systematic tracking of economic conditions:
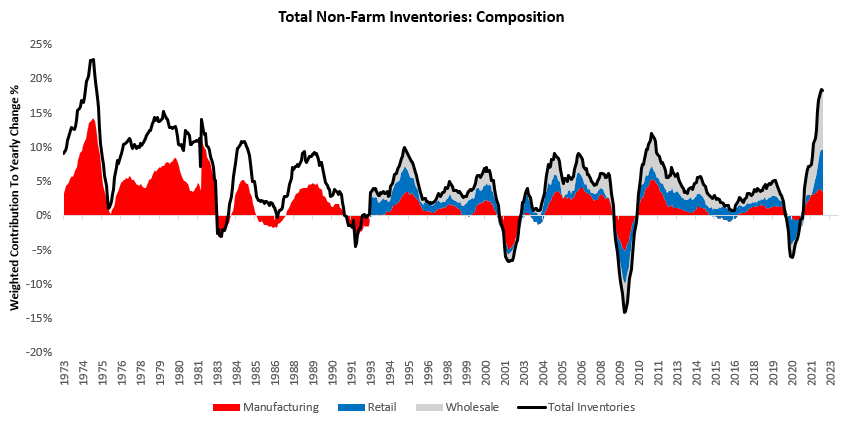
i. Pressures continue to build on businesses to contract employment. Today, we received incremental information in the form of wholesale inventory and sales data. This data disappointed expectations, with a monthly change of 0.6% versus the expected 0.8%. Over the last year, manufacturing, retail, and wholesale have contributed 3.51%, 6.04%, and 8.79%, respectively to an 18.34% increase in Total Non-Farm Inventories:

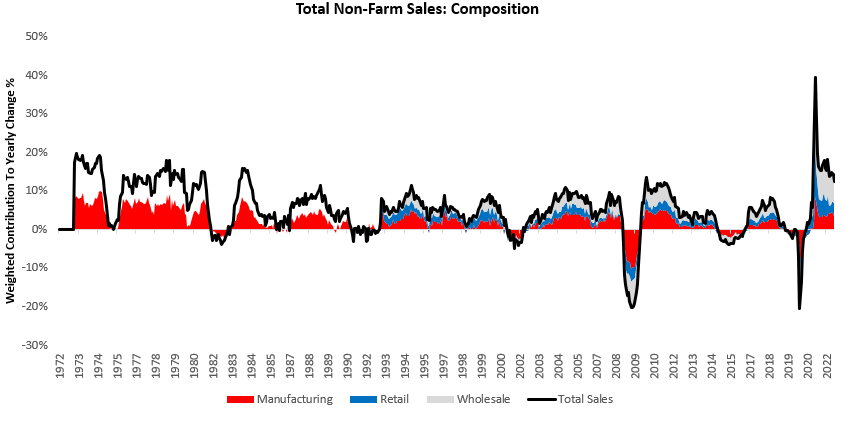
Alongside these inventory numbers, we also estimate total sales numbers. These estimates showed a -0.8% decrease in business sales- with manufacturing, retail, and wholesale contributing -0.25%, 0.01%, and-0.55%, respectively. Over the last year, manufacturing, retail, and wholesale have contributed 3.52%, 3.34%, and 5.67%, respectively to a 12.53% increase in sales:
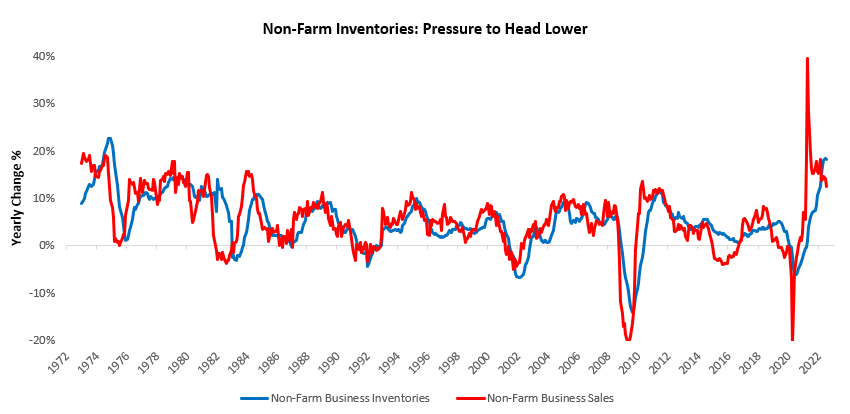
Inventory build supports sales growth because one business’s inventories are another business’s sales. However, there are physical limitations to inventory build. Furthermore, as sales growth deteriorates, the pressure on inventory growth increases. Total business sales are currently below the rate of change in inventories, suggesting downwards pressures on future inventory growth. The gap between sales & inventories is significant relative to history, suggesting strong downward pressure on inventories:
While nominal sales generally impact the direction of travel for inventories, real sales significantly impact the hiring outlooks for businesses. During times of rising real sales growth, we typically see employment pulled up as firms attempt to expand their output and capacity. Conversely, falling real sales growth tends to drag on employment as firms curb output. Today, sales growth is below employment growth, suggesting downwards pressures on future hiring. The divergence between sales & hiring is significant relative to history, suggesting strong downward pressure on future employment.
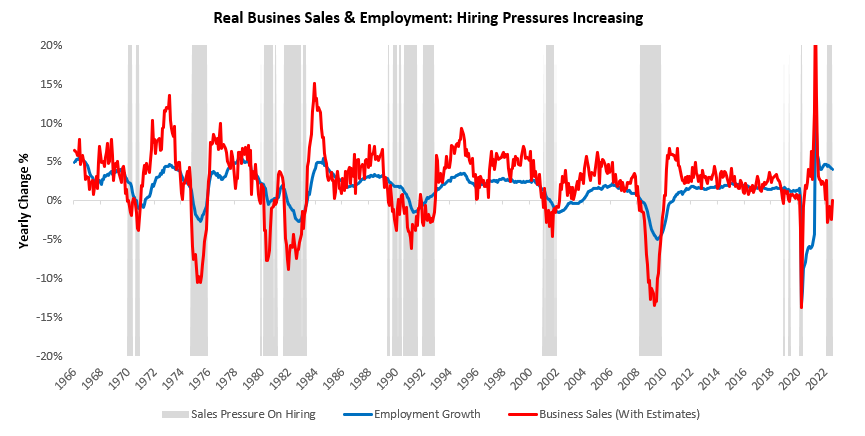
Since 1966, there have been eight periods that resemble today in terms of the decline in real sales relative to employmentand all of them have resolved themselves in a contraction in labor markets. The pressure is on.
ii. We are seeing the initial phases of private sector balance sheet contraction, with more to come. In Q2 2022, corporate balance sheets contracted -by 4.14% versus the previous year, with liabilities increasing by 1.72% and Net Worth decreasing -by 5.86%. Driving these changes, Real Assets increased by 2.81%, Cash Assets decreased -by 0.05%, Agency Securities increased by 0.04%, Risk Assets decreased -by 6.94%, and Financial Liabilities increased by 1.72%. Below, we show the composition of this contraction in balance sheet assets:
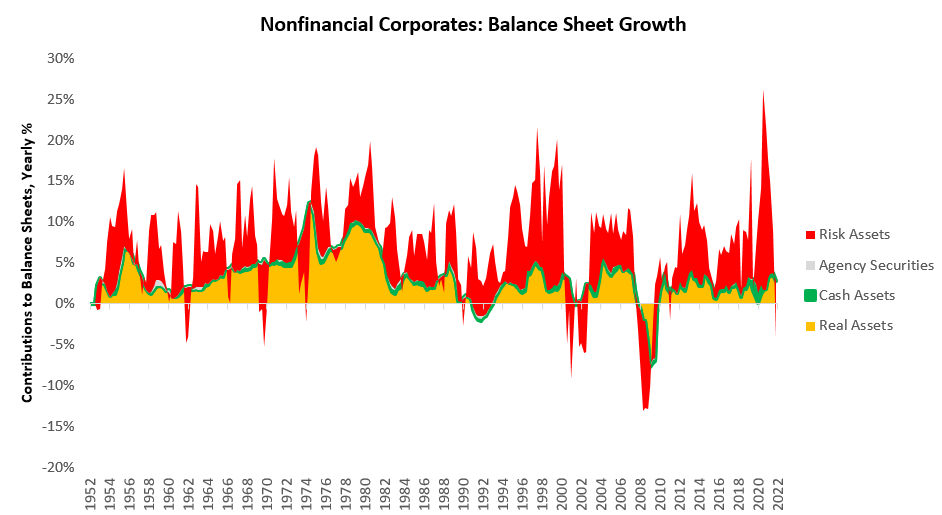
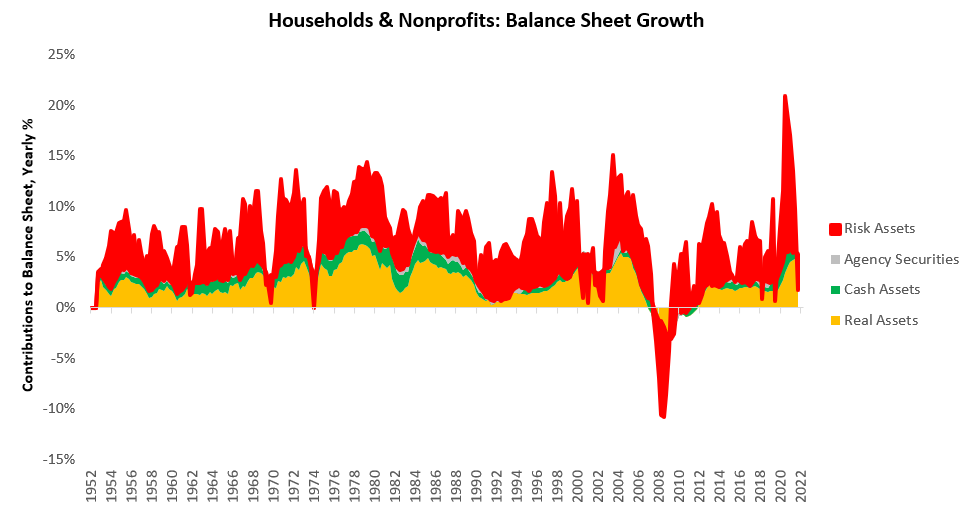
It is important to note that majority of this contractionary force came from the revaluation of corporate equities, i.e., corporate equities declined and caused net worths to fall. This contraction in corporate balance sheets is consistent with the Fed’s objectives of reigning in credit creation. As of Q2, some of this impact was passed onto households as well, but the effect was muted by real estate priceswhich remain elevated. However, the pass-through of lower equity values onto balance sheets remains significant. With the Fed set on its path to tightening financial conditions, household net worths are likely to contract in the coming quarters:
Given the current trajectory of monetary policy to contract lending through tighter financial conditions, the outlook for future investment continues to dim. Leverage in the financial system can increase as borrowing costs come down, real incomes rise, or net worths rise. We see none of the above, telling us that future output will likely be curtailed. The outlook remains weak for future production and hiring.
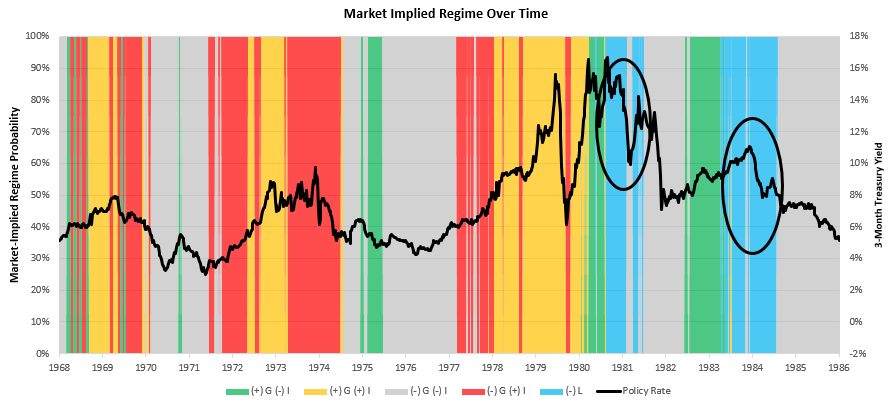
iii. Tightening liquidity conditions continue to create a challenging environment for all assets. Our market-regime monitors use our understanding of market pricing to estimate the implied odds of the current macroeconomic regime. Based on our regime recognition, we can be in one of 5 regimes:
-
(+) G (-) I: Rising Real Growth, Falling Inflation
-
(+) G (+) I: Rising Real Growth, Rising Inflation
-
(-) G (-) I: Falling Real Growth, Falling Inflation
-
(-) G (+) I: Falling Real Growth, Rising Inflation
-
(-) L: Tightening Liquidity
In reality, we can be in 8 different regimes based on the various permutations of growth, inflation, & liquidity. However, we compress the tightening liquidity environments into one regime to show the dramatic impact of tightening liquidity conditions on markets. Below, we show how our market regime monitors are currently showing elevated odds of both stagflationary nominal growth and tightening liquidity conditions:
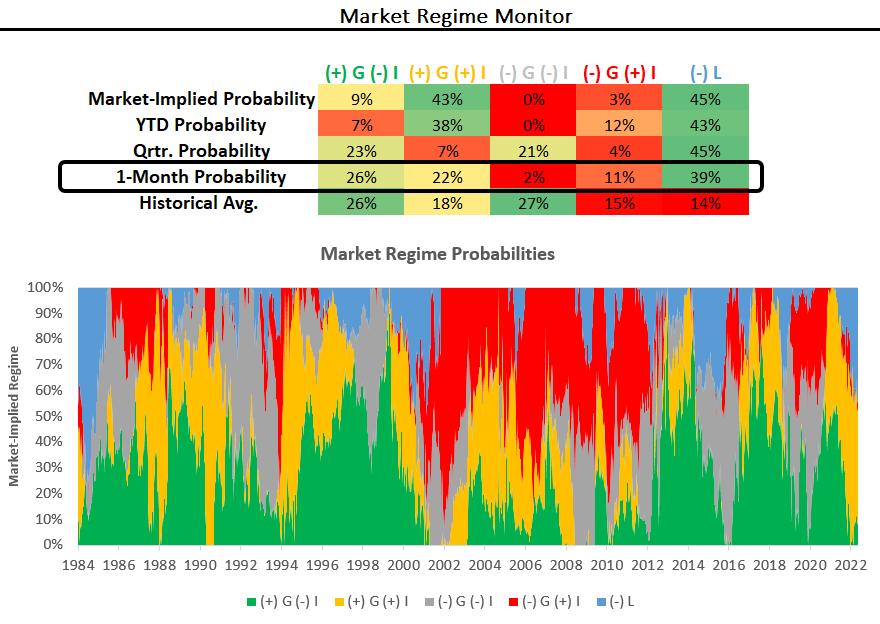
We highlight above that tightening liquidity is now the dominant market regime. Tightening liquidity reflects the drying up of funding liquidity in the economy, i.e. when the dry powder for future economic and financial activity contracts. Tightening liquidity conditions manifest themselves in flattening yield curves, widening credit spreads, cheapening valuations, and poor risk asset performance. Overall, this environment is rare in history as the dominant market regime, but it can be highly impactful when it occurs. To illustrate tightening liquidity’s impact on assets, we show our regime expected returns for equity sectors, commodities, and fixed income.
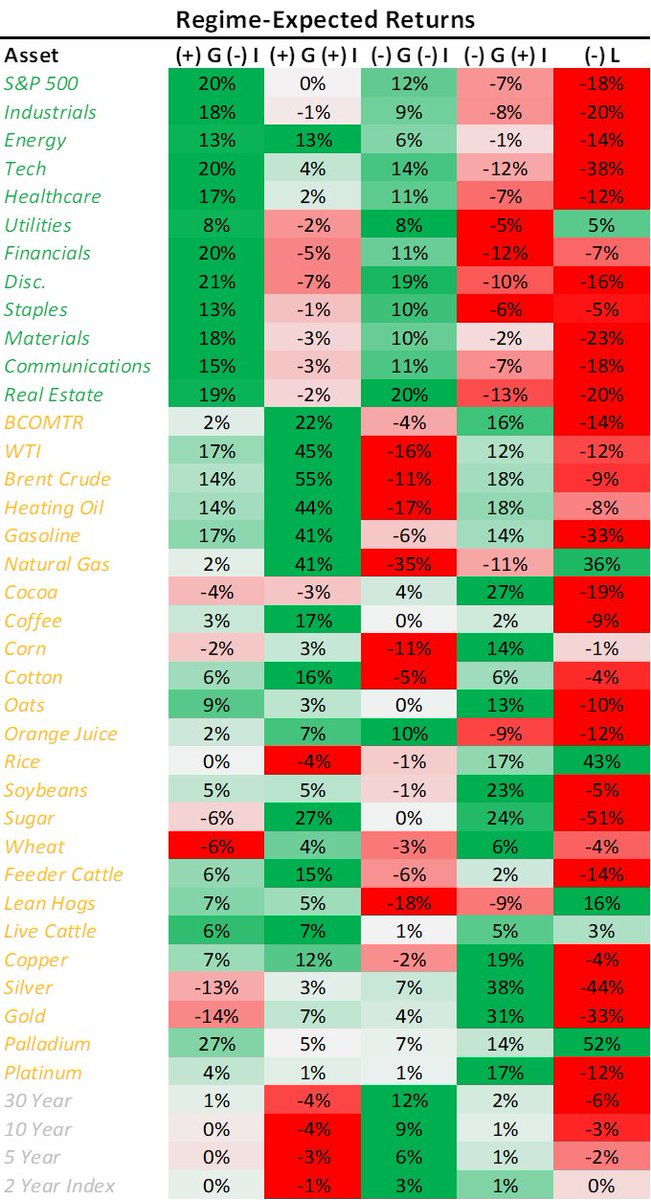
As we can see, assets across the board tend to underperform during tightening liquidity conditions. In past periods, when we have witnessed sustained bouts of tightening liquidity conditions, we have often seen a reversal by policymakers as tightening liquidity adequately curbed nominal economic activity:
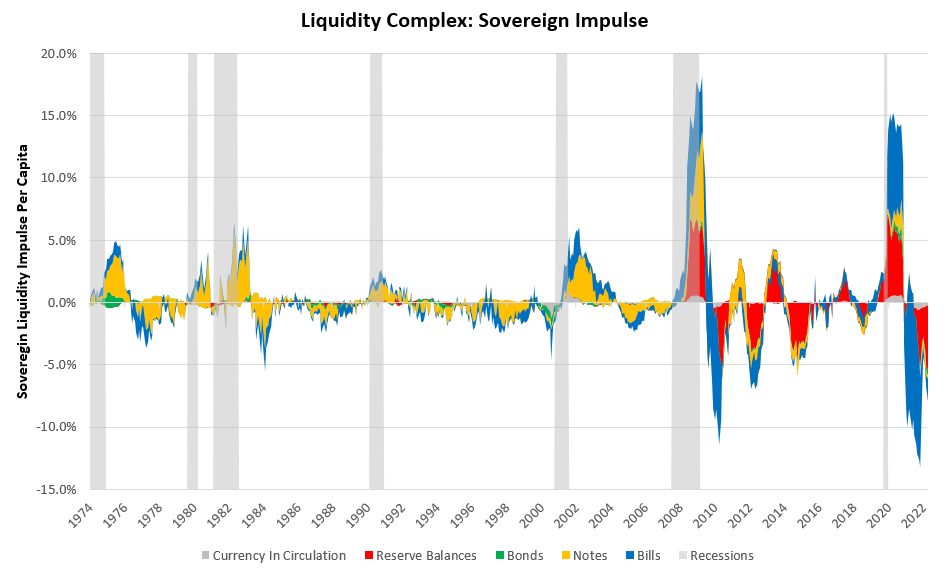
As the Federal Reserve moves to tighten financial conditions further, we will likely see a further extension in market-implied odds of tightening liquidity. Below, we show the combined tightening of liquidity conditions coming from the combined Fed & Treasury:
Therefore, while we remain in an environment of high inflation, our systems have preferred short exposures over long exposures to various asset classes. Our systems continue to monitor the evaluation of both fundamental and market data to asses when to begin adding assets, but for the time being, they maintain the dollar as our largest exposure.
Whether we can stay in a tightening liquidity environment will depend on the resolve of the Fed & Treasury to continue down the current path to curb inflation. The real test of this resolve will come when labor markets deteriorate, and they are likely to do so rapidly once they start. We wait, watch, & adjust incrementally. Stay nimble.