Over this week, we will migrate all our publishing to our new website. Please make sure to subscribe below here if you haven’t already, as we will be transferring all our mailing lists to the new website. You can check it out here.
Welcome to The Observatory. The Observatory is how we at Prometheus monitor the evolution of the economy and financial markets in real time. The insights provided here are slivers of our research process that are integrated algorithmically into our systems to create rules-based portfolios. We also just released our latest Month In Macro note, which over 45 pages, explains our current assessment of economic and market conditions. You can read it here:
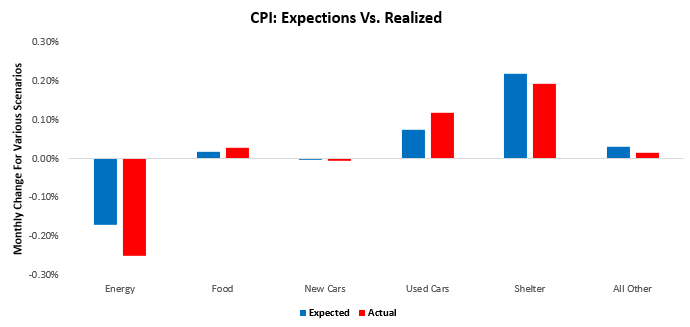
CPI data today came out largely in line with our expectations. Our expectations were for a print of 0.17%, while the print came in at 0.10%. Below, we show the composition of our estimates relative to the realized print:
In our note, prior to the print, we said:
We think print is one for careful assessment. Particularly, we will be looking two examine two factors. First, we will looking to see whether motor vehicle inflation remains persistent. Given the industry dynamics we monitor, there is potential for new cars to see deflation as manufacturing productions alleviate some degree of supply shortages. Nonetheless, used car inflation likely shows significant potential to re-accelerate this month. Second, we will be looking to see if housing inflation can continue the deceleration we have seen in the last few prints. This would confirm that our expectations of disinflation in housing are taking hold. In summary, the print will likely look weak due to commodity factors. Still, it is imperative to note that excluding all other items, CPI inflation will remain above 2% just through the housing component. We remain far from the Fed’s objectives.”
The latest print confirmed our expectations on both fronts: used car inflation came in strong, while shelter inflation continued its descent. We zoom into the transportation sector inflation:
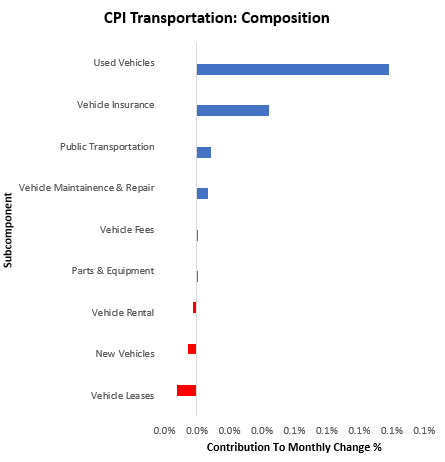
As we can see above, used vehicle prices were the primary driver of transportation inflation, as expected. This dynamic is likely to be an ongoing support to inflationary pressures. We dig a little deeper into the print.
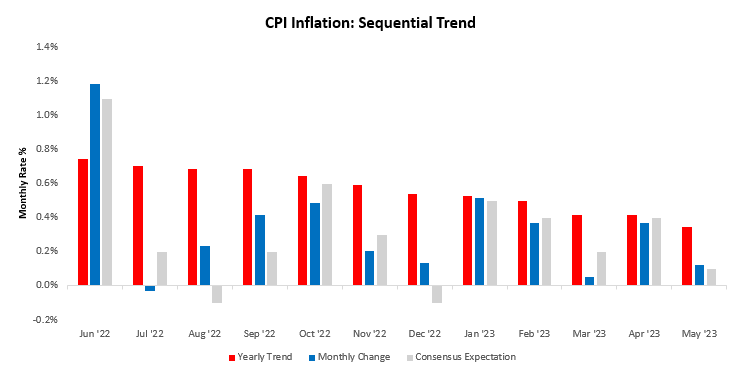
CPI Inflation increased by 0.12% in May, surprising consensus expectations of 0.1%. This print contributed to a sequential deceleration in the quarterly trend relative to the yearly trend. Below, we show the monthly evolution of the data relative to its 12-monthly trend and consensus expectations.
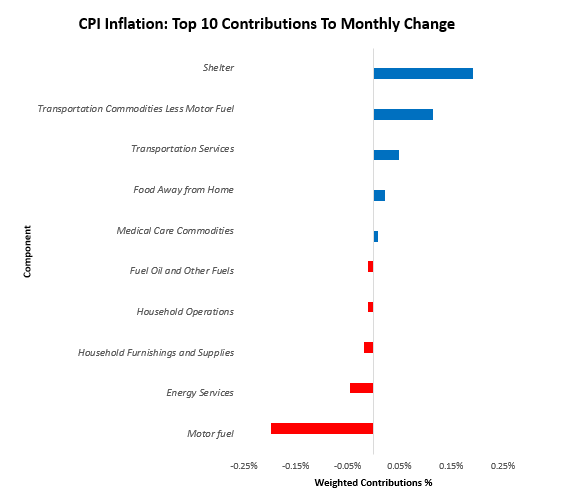
At the subcomponent level, the primary drivers of this print were Motor fuel (-0.2%), Energy Services (-0.05%), Transportation Commodities Less Motor Fuel (0.11%), Shelter (0.19%), & Transportation Services (0.05%). Below, we show the top 10 drivers of the monthly change:
Over the last year, Food at Home (0.5%), Food Away from Home (0.4%), Motor fuel (-0.71%), Shelter (2.77%), & Transportation Services (0.61%). have been the primary drivers of the 4.13% CPI inflation. We show the contributions of these items to yearly changes in total spending below.
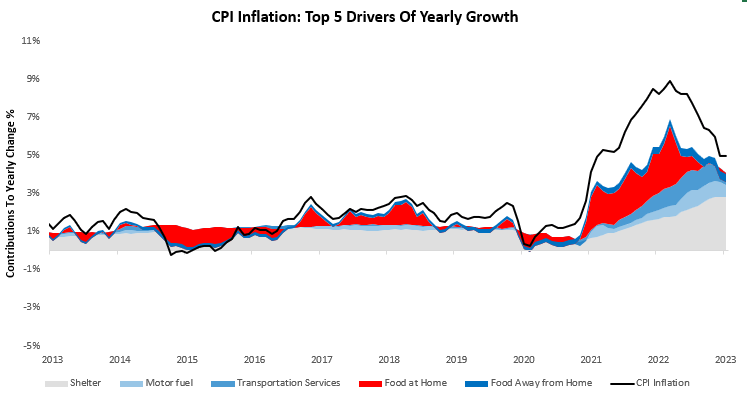
Alongside these big-picture drivers, we think it is important to note that we are seeing deflation in a few areas of the economy now:
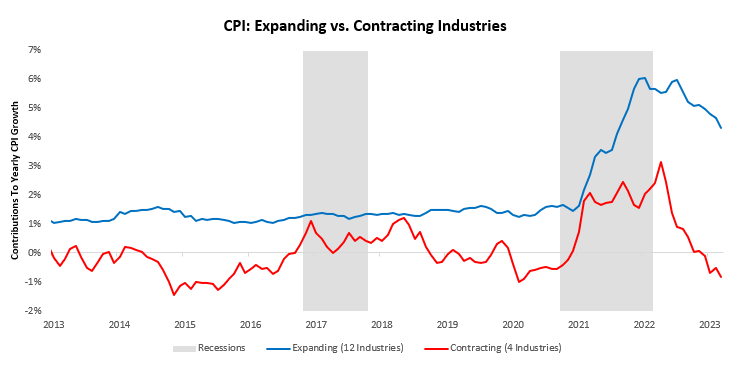
The industries currently seeing deflation are Fuel Oil, Motor fuel, Education & Communication Commodities, and Alcoholic Beverages.
We think it is important to note that excluding food and energy, i.e., core CPI, was up 0.40% this month— implying a 4.9% annualized rate for core inflation. This data is far removed from the Fed’s objective. As such, bond markets have moved to re-discount expectations, moving away from aggressive expectations of easing, consistent with our views outlined in our Month In Macro note. We show this below:
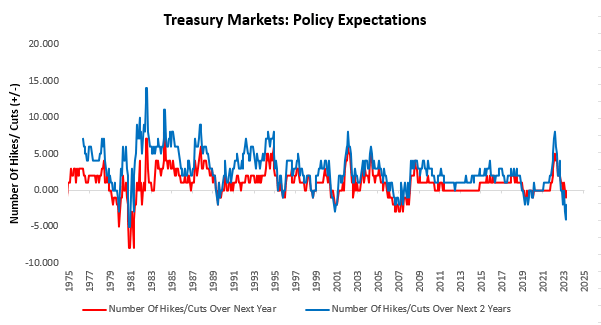
Markets have moved from pricing one interest rate cut over the next year and four over the next two to now pricing zero cuts in the next year and two cuts over the next two. Ahead of this repricing, our trend signals on 10- Year Treasuries had already turned negative and remains there:
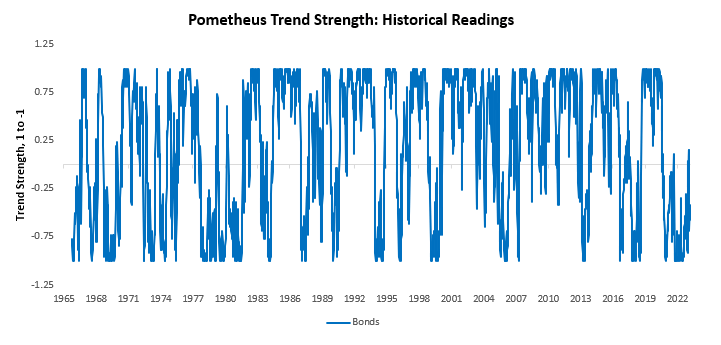
Additionally, we show daily trend signals for the Treasury ETFs our systems track. As we can see, they all show short signals across the curve:
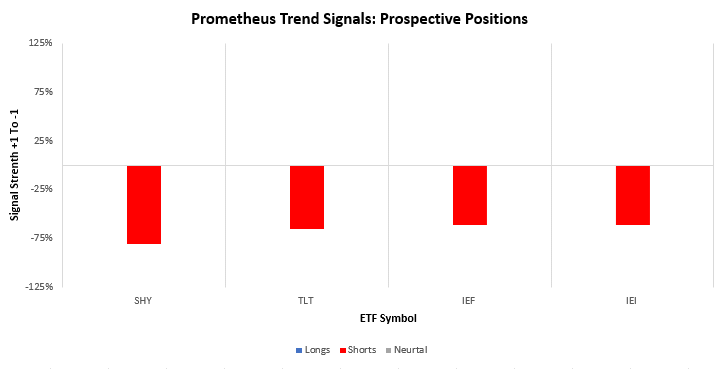
Inflationary dynamics continue to create a challenging dynamic for Treasuries, and the disinflationary pricing we expected to support a 60/40 portfolio in H1 of 2023 is likely to dissipate in H2 of 2023 as markets come to terms with potential inflation entrenchment:
Until next time.
Hi! Do you know if they make any plugins to assist with Search Engine Optimization? I’m trying to get my blog to rank for some targeted keywords but I’m not seeing
very good gains. If you know of any please share.
Appreciate it! I saw similar blog here: Wool product
A pharmacy that prides itself on quality service.
cost generic lisinopril without a prescription
A gem in our community.
Their global pharmacists’ network is commendable.
can i buy cytotec
The best place for quality health products.
Actual trends of drug.
sudden stopping gabapentin
Their global reputation precedes them.
Their global distribution network is top-tier.
buying cheap cytotec without dr prescription
I’m grateful for their around-the-clock service.
Leading with integrity on the international front.
fluoxetine without dr prescription
They provide a global perspective on local health issues.
hgh wachstumshormone kaufen
Due To This Fact, AAS with sufficient resistance to
hepatic breakdown and efficiency to activate the AR are prone to
incur liver damage. The medical relevance of elevated biochemical markers of liver damage in response to AAS use stays unknown. Moreover, warning should be taken when deciphering these
markers in AAS users.
The staff collected 28 anonymously donated steroid merchandise and chemically analysed them, discovering just four that had a
clear labelled dosage that proved to be accurate within 5%.
The researchers say many of the samples examined constructive for heavy
metals, including lead, and a few exceeded the safe day by day exposure restrict.
They say while their pattern measurement was small, their results show a range of potential safety
risks for those utilizing unregulated steroid merchandise.
No, anabolic steroids are unlawful to use, purchase, and promote in Australia and
not using a prescription. However, the options offered on our list of probably the most really helpful legal steroids in Australia
2025 can be found to be bought with no prescription.
The penalties for supplying steroids can be severe, depending on the quantity and
whether it’s deemed to be for business purposes. Supplying large quantities can lead to penalties including imprisonment for as a lot as
15 years. We are a one cease shop that caters to the needs of
skilled bodybuilders, dedicated fitness enthusiasts and more.
With our unwavering commitment to high quality
and authenticity, we only inventory a selection of high of
the range UGL and pharmaceutical-grade products.
Interestingly, even a dosage that is roughly twice that of TRT (200 mg testosterone enanthate weekly) solely partially suppresses LH (-66.7%) and FSH (-62.5%)
and, indeed, leads to azoospermia in only about two out of three
men (182). As such, efforts have been made to finish gonadotropin suppression by
including progestins. Whereas the addition of a progestin results
in almost undetectable gonadotropin ranges, and consequently to
azoospermia or extreme oligozoospermia in the overwhelming majority of men, a small proportion of males
remain potentially fertile (183, 184). One
reason for this could be that the low intratesticular testosterone ranges derived from the circulation proceed to stimulate spermatogenesis in some men (180).
In the HAARLEM research, practically all topics had undetectable LH and FSH levels during AAS use.
Nonetheless, solely two-thirds of topics were azoo- or oligozoospermic on the end of their cycle (176).
Selective Androgen Receptor Modulators (SARMs)
have been in a legal grey area in Australia
for some time. As of now, it’s unlawful to sell SARMs
in Australia, and they’re also included in the Australian Therapeutic
Goods Administration’s record of prohibited substances.
Nevertheless, they are often bought for ‘research purposes’ beneath certain conditions.
It’s also important to notice that the possession or use of
SARMs isn’t thought-about a felony offence, but they’re banned by the World Anti-Doping Agency (WADA),
that means athletes found to be utilizing them can face sanctions.
The safest option in case you are pregnant or considering pregnancy is to keep away from steroid use.
Inform antenatal staff of steroid use and attend regular antenatal checkups.
At NewZealandSteroidShop.com, we stand for reliability, outcomes, and actual
support. Every product we feature is backed by quality assurance and our commitment to helping you succeed whether or not
you’re simply starting out or pushing toward your next personal best.
In jurisdictions (outside of Australia) the place use
of AAS was authorized, approximately 60 per cent of girls using sought steerage or prescriptions from licensed medical practitioners.
Dr Piatkowski additionally emphasised that being an unlawful substance, there were lots of unknowns for anybody using steroids.
Members discuss their cycles, outcomes, and general satisfaction, offering a
wealth of knowledge for potential patrons. Discreet delivery is crucial within the steroid market due to the sensitive nature of
those merchandise. GearManiac uses plain packaging with no indication of the contents, guaranteeing that your privateness is maintained.
For instance, research has found that 41% of Australian men who
injected steroids reported an injection-related health problem corresponding to corresponding
to fevers, scarring and abscesses. It could be tempting to attempt a fast repair for muscle growth, harm restoration or better efficiency, but the potential
impression in your well being and life isn’t worth it.
Androgenic steroids (e.g. testosterone) and SARMs are
similar in that they work together with androgen receptors on the body’s cells to change cell operate.
To buy steroids in AU in a posh answer means to keep away from the need to independently choose medication, calculate the dosage,
the frequency of intake. Such things are tough not only for newbies, but in addition for professionals
involved in power sports for more than one year. Steroids
ready-made course – is the convenience of reception, high effectivity
and safety for the body.