Welcome to our official publication of the Prometheus ETF Portfolio. The Prometheus ETF portfolio systematically combines our knowledge of macro & markets to create an active portfolio that aims to offer high risk-adjusted returns, durable performance, & low drawdowns. Given its systematic nature, we have tested the Prometheus ETF Portfolio through decades of history and have shown its durability. For those of you who are unacquainted with our systematic process, we offer a detailed explanation here:
In this publication, we will discuss the performance, positioning, & risks of the Prometheus ETF Portfolio— and it will be published every week on Fridays to help investors understand how our systematic process is navigating through markets. Before diving into our ETF Portfolio positions, we think it is essential for subscribers to understand the context within which our systems choose their exposures. Below, we offer our latest Month In Macro note, which contains the conceptual underpinnings of our systematic process within the context of the latest economic data:
Our latest Month In Macro is our best work yet, and we highly recommend you take the time to review the materials provided. As a supplement to the macroeconomic views provided, we provide our thoughts on price actions this week.
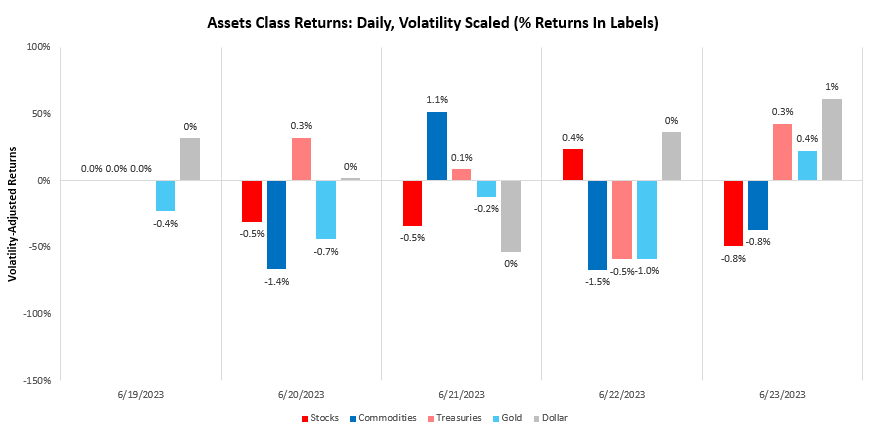
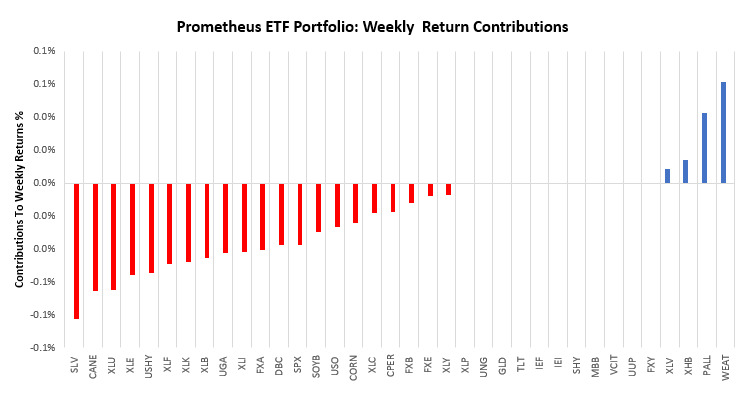
Over the last week, our systems moved to price tightening liquidity, with the dollar rising by 0.65%. We show the daily path of returns through the week:
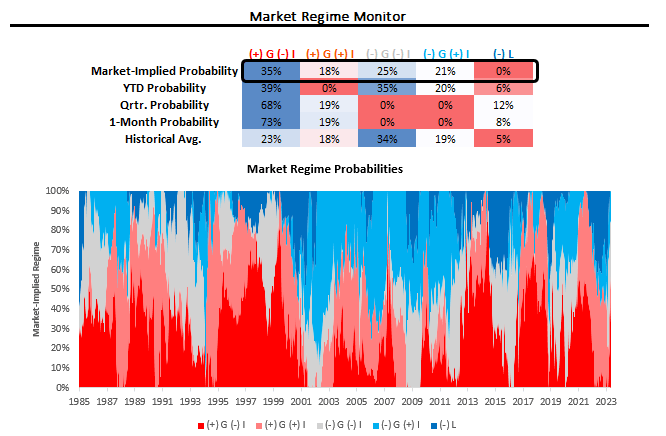
Using our understanding of cross-asset market pricing, we can derive the market-implied odds of varying regimes of growth, inflation, and liquidity. Currently, our proprietary process suggests that we are in a period of rising real growth pricing, though the distribution of regime probabilities remains relatively flat. We show our market regime monitor below:
Equity market strength faltered this week, but the broader trend in equity markets has been driven by rising liquidity conditions. In the most recent month, growth, inflation, liquidity, and discount rates have contributed 1.62%, 3.04%, -2.2%, & 0.5%, respectively. We show the cumulative contributions to total returns over the last year below. The sum of these lines equals the total return on equities:
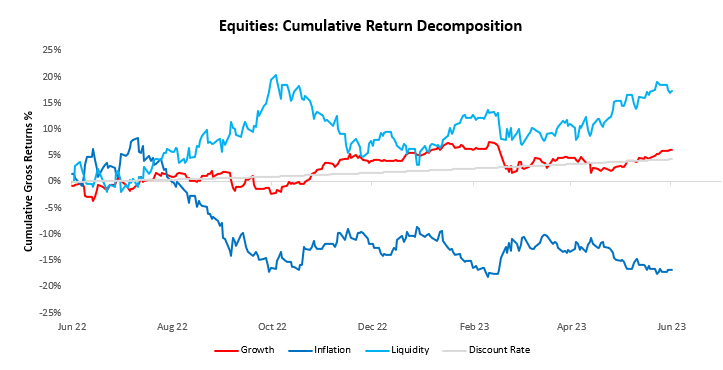
We think it’s important to recognize that inflationary factors continue to drag on equities while liquidity (and, to a much lesser extent, growth) is driving equity strength. This trend in equities is less robust than if all factors supported equity positions— however, there is nonetheless significant support for the equity trend.
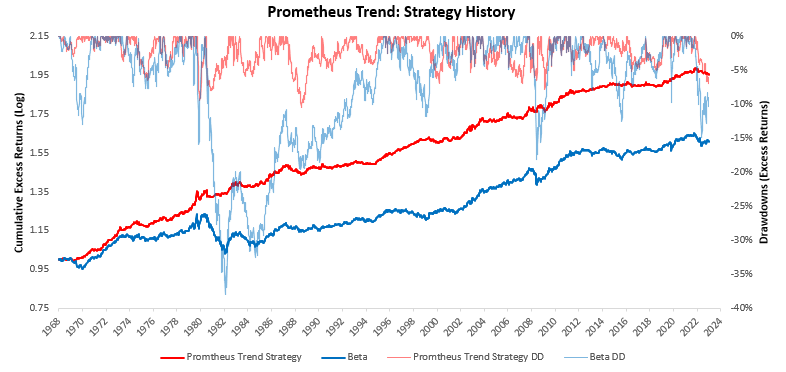
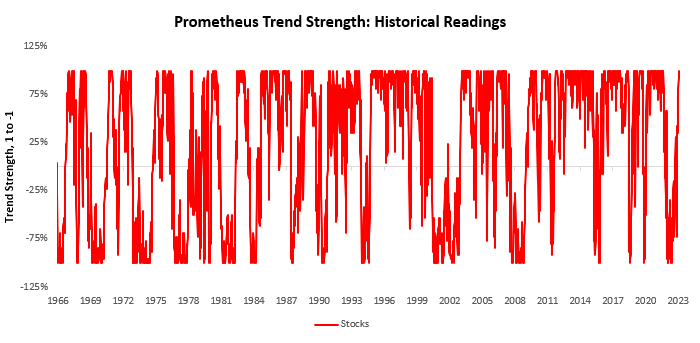
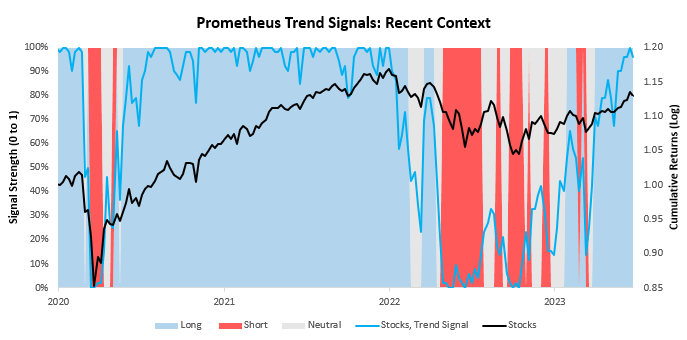
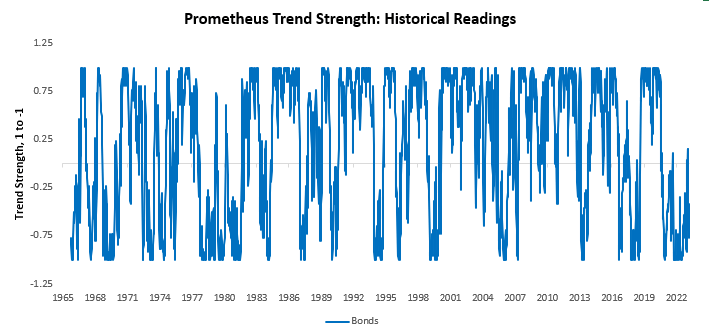
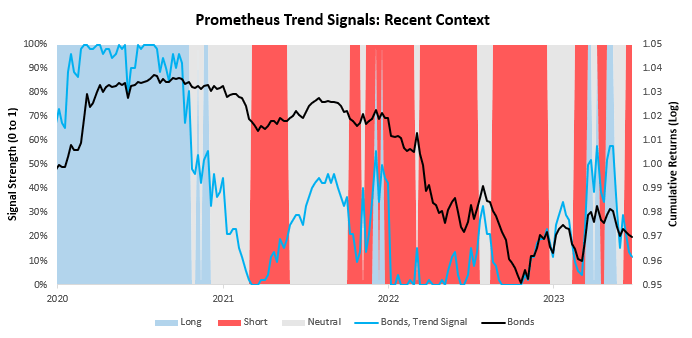
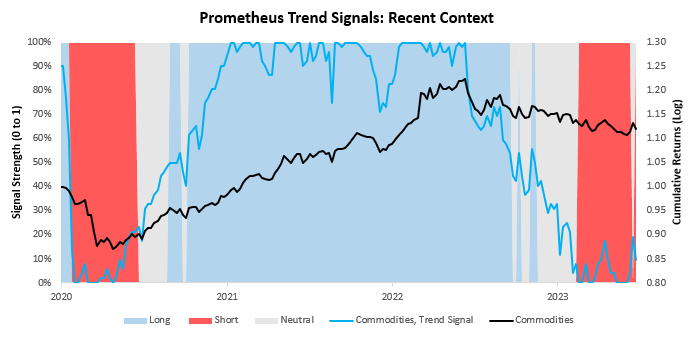
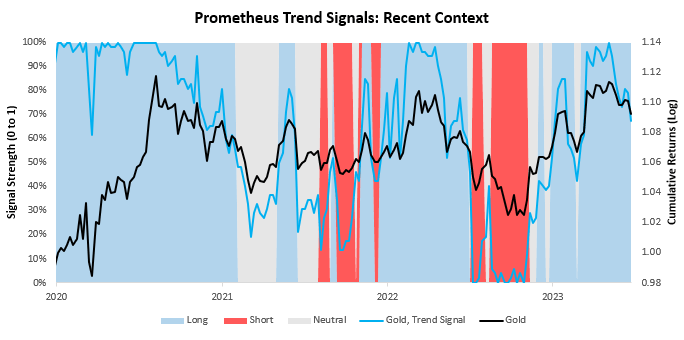
In addition to our market regime process, we have developed a set of trend filters to help us better evaluate the sustainability of asset-class moves. As always, we have tested these trend measures over time to understand whether they can help reliably generate an edge in markets. As proof of concept, we show how these combined signals have performed relative to an underlying portfolio of the same four assets. Currently, these signals suggest long positions in stocks, short positions in bonds, short positions in commodities, and long positions in gold.
We begin by showing our signals for stocks. We show both the full signal history and the most recent signal context:
Next, we show our system’s current readings for 10-Year Treasuries:
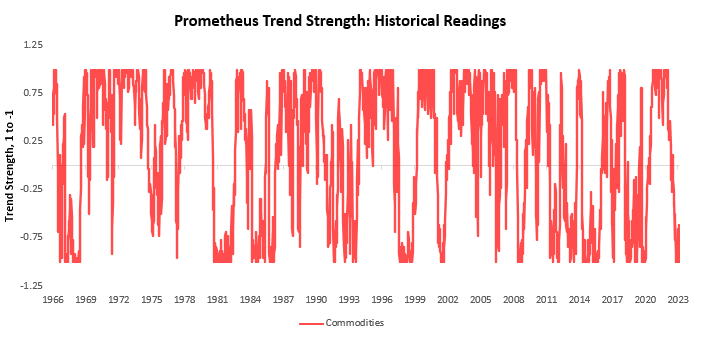
We now turn our attention to commodities:
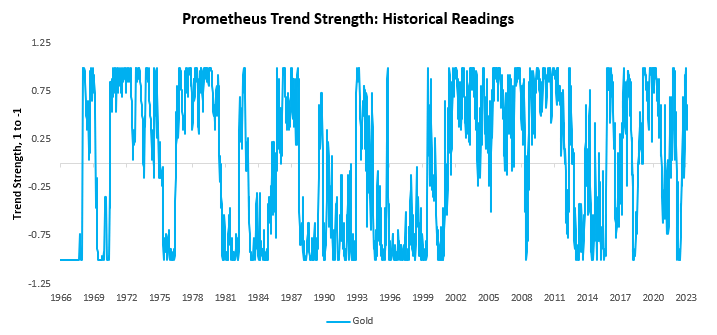
Finally, we show our trend signals for gold:
Over the last week, the Prometheus ETF Portfolio was down by -0.63%. Below, we show the contributions to this portfolio performance across securities:
Turning to next week, our systems are looking to position the Prometheus ETF Portfolio, as shown below. The portfolio contains 21 positions heading into next week. We show these below:
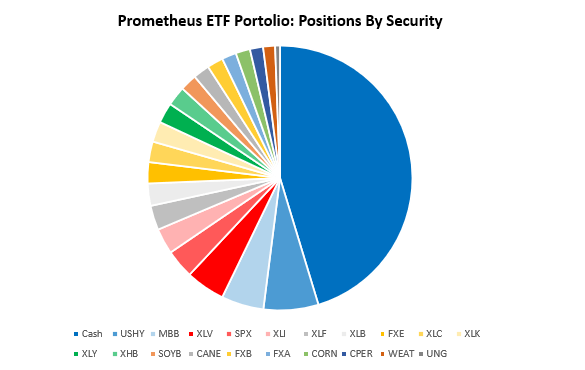
POSITIONS: Cash: 45.31% USHY: 6.7% MBB : 5.17% XLV : 4.79% SPX : 3.52% XLI : 3.14% XLF : 2.99% XLB : 2.71% FXE : 2.59% XLC : 2.52% XLK : 2.5% XLY : 2.49% XHB : 2.38% SOYB: 2.06% CANE: 2% FXB : 1.96% FXA : 1.76% CORN: 1.76% CPER: 1.6% WEAT: 1.46% UNG : 0.59% . Please note if cash position is negative it implies leverage.
Additionally, we show these positions aggregated into asset class allocations below:
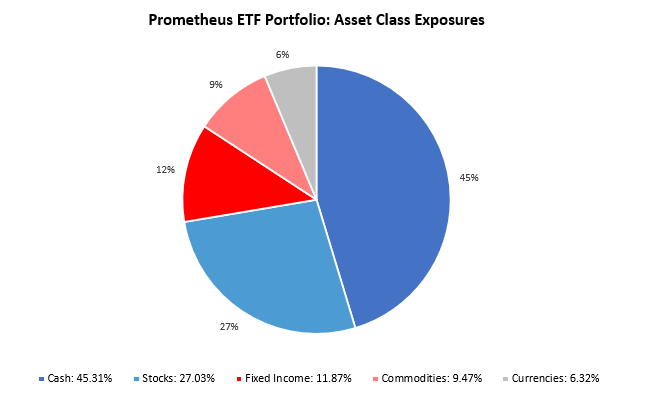
The portfolio has a net exposure (ex-cash) of 54.69%, with a gross exposure (ex-cash) of 54.69%, i.e., it is long-only. This allocation has an expected volatility of 4.84%, with maximum expected volatility of 10%. We are seeing both the symptoms and sources of liquidity improving within an inflationary environment. Until this changes, it favors equities and commodities over fixed income. Our positioning reflects these dynamics. Until next time.
A true gem in the international pharmacy sector.
lisinopril medication purpose
Their global presence never compromises on quality.
Their 24/7 support line is super helpful.
cytotec prescription
Top 100 Searched Drugs.
Delivering worldwide standards with every prescription.
cost generic clomid without insurance
A pharmacy that truly understands international needs.
They provide international health solutions at my doorstep.
can i purchase cipro without prescription
Always on the pulse of international healthcare developments.
Global expertise that’s palpable with every service.
can i purchase cheap cipro pill
Hassle-free prescription transfers every time.
Many lifters add KPV to their routine because it helps pace up
healing and lower muscle soreness after powerful exercises.
Analysis in folks and animals found that this peptide soothes the abdomen and intestine
lining. Peptides like KPV shield your intestine wall, so food and dietary supplements do extra for
muscle positive aspects. Ensuring the safety and stability of KPV peptide
is crucial for its effective use in analysis settings.
Moreover, understanding the proper usage and dosage of KPV peptide is important for reaching the specified results.
Comply With the guidelines provided by the supplier and consult scientific literature or medical professionals to determine the most effective administration strategies.
With careful consideration and responsible use, purchasing KPV peptide could be a useful step
toward managing irritation and enhancing overall well being.
It’s necessary to notice that KPV peptide targets main pathogens
known as irritation at its source, contributing to its effectiveness.
Furthermore, KPV peptide has been shown to modulate inhibited immune responses, further enhancing its therapeutic
potential in numerous inflammatory conditions. One of the most promising features
of KPV peptide injection is its potential in dermatological purposes.
The lifter attributes the acquire to each the smarter training
and the calmer inflammatory setting. The greatest stack
that strikes the needle is KPV peptide plus evidence based
coaching and restoration practices. That means acceptable quantity and frequency, good progression, sleep underneath real control, a
food plan that doesn’t punish your gut, and honest deloads.
The appropriate method to integrate any restoration device is to pair it with coaching design,
vitamin, sleep, and delicate tissue work. For oral use that targets the
gut wall, timing with meals is rational since PepT1 transport responds to meal driven peptide flux.
If your major goal is to calm a tough evening meal, an evening dose is
ok. You are optimizing for consolation and practicality,
not hunting for a legendary excellent peak.
KPV has increasingly turn into popular amongst various and integrative medicine practitioners due to its broad therapeutic results on inflammation and immune modulation. Practitioners usually highlight
its efficacy in managing persistent inflammatory conditions, enhancing
wound restoration, and combating resistant infections, though emphasizing
the importance of additional clinical validation. Lastly,
this text incorporates a nice deal of data that may inform you- the affected
person and also can inform your physician. It just
isn’t information that is supposed to diagnose or treat sufferers who have inflammatory bowel disease.
As with all procedures and “meds” used in the practice of medicine, the dose, timing,
mixture, and monitoring of symptoms and laboratory tests is essential to acquire optimum outcomes.
Not to say the cooperation between the affected person and an experienced, board-certified Practical doctor.
Patients “biologics,” which include an array of probably deadly unwanted effects.
It is for scientific research only and ought to be handled in licensed laboratory environments.
Cellular uptake occurs by way of the PepT1 transporter, which turns into upregulated in inflamed
tissues[2]. This offers targeted supply to areas where
irritation is current.
Side effects seem minimal when taken responsibly, however, like each energetic compound, it’s now not
one thing to self-administer without advice.
Not Like sturdy drugs that suppress your immune system totally, the peptide KPV seems to behave
extra precisely. It targets irritation, even as it helps keep your body’s
pure defences. This makes it especially applicable for continual intestinal
situations, in which calming the immune system with
out shutting it down is vital. That mentioned, as with every research peptide, long-term studies are wanted before it
could be thought-about for therapeutic use. Researchers are persevering
with to gauge its effectiveness, dosage, and interactions with
other compounds to ensure its security and efficacy.
Use this comparison to determine where KPV peptide fits somewhat than to crown a winner.
Stacking makes sense if you combine mechanisms that solve totally different parts of
the same problem. It doesn’t make sense whenever you combine 5 instruments with
overlapping motion and no measurement plan. For parenteral use in research contexts, as soon as
day by day suffices for many targets that athletes chase.
Multiple small every day exposures are typically used, however the burden is never justified until you’ve a very specific use case
beneath medical steerage. No, KPV is a fraction of α-MSH
and does not trigger pigmentation or hormone-related effects.
Right Here we listed probably the greatest website that is identified for it’s greatest results.
However, it’s meant strictly for research use and not for
human consumption. Purchase KPV peptide pre-mixed peptide 2 mg pen, a handy, ready-to-use solution for analysis, eliminating the necessity for guide mixing.
Designed for accuracy and portability, it simplifies dosing and ensures consistent,
reliable administration. Best for exploring it’s anti-inflammatory,
antioxidant, and neuroprotective effects. KPV Ultra is provided in an oral spray format and
can be utilized with or without food.
The peptide is regularly mentioned in skilled discussions
and clinical boards, emphasizing its promising
results in early analysis and clinical functions. This suggests that
KPV could be a promising candidate for oral administration to handle
inflammatory bowel disease (IBD) [R]. KPV peptide is rising as
a robust research tool in pores and skin health, thanks to its anti-inflammatory, therapeutic, and protecting properties.
The capability of KPV Peptide to affect various mobile processes,
corresponding to apoptosis and cell proliferation, additional underscores its
potential as a priceless tool within the management of IBD.
In the context of Inflammatory Bowel Illness (IBD), KPV Peptide emerges as a promising therapeutic agent due to its ability
to modulate inflammatory responses and promote mucosal repair.
By concentrating on key pathways concerned in IBD pathogenesis,
this peptide provides potential for managing UC and colonic cells.
The KPV Peptide offers a wide range of medical applications, with
a particular focus on addressing inflammatory bowel disease (IBD) and related gastrointestinal issues.
Its targeted supply mechanisms and biocompatible properties position it as a promising resolution for managing intestinal
irritation.
three risks of using anabolic steroids and other performance-enhancing drugs
This supply technique could allow KPV peptide for use in topical remedies for pores and skin situations that contain inflammation, such
as psoriasis or eczema. The ability to deliver KPV by way of
the pores and skin broadens its potential purposes in dermatology, offering
a non-invasive choice for managing inflammation-related pores and skin issues.
As A Result Of it is a small and stable molecule, it’s well-suited for
various strategies of administration in research settings.
It can be investigated as a topical agent utilized
directly to inflamed skin or as a systemic treatment to
target inner irritation. Its pure origin as part of a human hormone and its extremely specific motion give it a wonderful
safety profile in preclinical studies, making it a gorgeous candidate for additional investigation.
Without MSH, dangerous things happen; persistent sleep disorders with non-restful sleep
develop, and endorphin manufacturing is decreased, so continual ache follows.
Structural mind abnormalities are sometimes seen in these
with inflammatory conditions corresponding to Mildew Sickness, so this can be a
great cross-over. In abstract, the first mechanism of action seen in BPC-157 is the creation of new blood
vessels, a process known as angiogenesis. Peptides are additionally low
risk, because of the truth that they’re just easy amino acids 4-50 in chain size with a peptide bond.
Study which peptides may help you repair and restore Mold Illness, Toxicity and Persistent Inflammatory Response Syndrome.
KPV decreased loss of body weight, colonic MPO exercise, and markedly decreased histological
signs of inflammation and pro-inflammatory cytokines mRNA levels.
Our in vitro experiments instructed that this anti-inflammatory role of KPV results from inhibition of pro-inflammatory mechanisms in each IEC and immune cells.
Here we investigated KPV anti-inflammatory effect on dextran sulfate sodium (DSS)- and trinitrobenzene sulfonic acid (TNBS)-induced colitis in mice.
The dose used in our study (100 μM KPV) was based on previous publications utilizing α-MSH
to deal with experimental colitis (28, 29).
DSS therapy resulted in a characteristic loss of physique weight that
began after 4 days of remedy (Figure 6A). Administration of
KPV significantly lowered weight loss at day eight
compared with mice that received DSS alone (Figure 6A).
This website rotation helps reduce inflammation and retains
the injection site healthy throughout your protocol. Correct GLOW
peptide blend dosing and timing are key to getting the most effective results whereas minimizing potential unwanted
effects. For these seeking to assist research on tissue restore,
see our devoted Wound Therapeutic and Tissue Repair compound pages.
Investigations recommend that KPV, an anti-inflammatory tripeptide transported by PepT1, could offer
protecting influence towards abdomen most cancers in wild-type mice.
These with mildew may even perceive how Mold Sickness, Toxicity and CIRS result in a ‘Leaky Gut’ because
of a lowered alpha-Melanocyte-Stimulating Hormone.
With Out VEGF, you won’t have blood move, and with out blood circulate the cells begin to
starve and don’t work correctly. VEGF is a substance made by cells that stimulate new blood vessel formation and increases blood move in the capillary beds.
Properly, BPC-157 will increase the activity of
critical healing components such as vascular endothelial progress issue (VEGF).
Scientists isolated BPC-157 from human gastric juice and have used it to enhance regeneration and velocity up pure therapeutic processes.
So, whether you have already launched into a therapy protocol, are halfway through one, or are simply starting your
journey to restoration, Peptide Therapy is a promising addition to your therapy plan. I’m a giant fan of Peptide
Therapy and I really have efficiently used peptides in my follow when working with my
Mould Illness, Toxicity and CIRS shoppers.
KPV helped cut back injury, sped up recovery, and didn’t trigger pigmentation or irritation. From therapeutic skin to
supporting intestine well being, KPV peptide has proven huge results in many areas.
Let’s discover the main benefits one by one—and see why KPV is getting a lot consideration right now.
Yes, it is typically studied in combination with different peptides like BPC-157 due to their complementary results.
This speculation is supported by the reality that
KPV has been speculated in analysis studies to presumably mitigate inflammatory
bowel illnesses (IBD). KPV is a minimal alpha-msh-fragment with
strong anti-inflammatory exercise and no pigmentation unwanted
effects, best for research on intestine and skin therapeutic.
KPV is systemically lively, which means its benefits extend beyond localized treatment areas to affect general health.
By increasing blood circulate, KPV not only helps tissue well being but additionally
contributes to the general functioning of physique systems,
highlighting its position as a flexible, multi-functioning peptide.
Derived from the bigger protein α-MSH (alpha-melanocyte-stimulating hormone), KPV retains the anti-inflammatory and healing properties
of α-MSH while being smaller and more stable, making it perfect for therapeutic use.
Uncover how KPV peptide, a powerful tripeptide, addresses
inflammation, supports gut therapeutic, and promotes pores and skin restore, providing a pure strategy to wellness
and recovery….
It is important to seek the assistance of with
a healthcare professional earlier than utilizing any new supplement
or peptide. KPV peptide works by targeting and binding to specific receptors
within the physique, triggering a series of reactions that can assist cut back pain and
inflammation. This strategy guarantees that the peptide is delivered directly to the particular areas
of the gastrointestinal tract where it is most needed, thereby optimizing its efficacy.
Through tailored delivery mechanisms, such as encapsulation or nanoparticle carriers, KPV Peptide can bypass unwanted degradation in the physique and efficiently attain its intended goal.
Be Taught how KPV peptide, a potent tripeptide, provides a pure and efficient approach to manage gut irritation, assist intes…
Many peptides are bio-identical to these naturally produced within the physique, making
them both efficient and well-tolerated. When it involves intestine
well being, certain peptides have demonstrated distinctive promise in clinical and experimental settings.
In the realm of regenerative medication and wellness optimization, peptide therapies have emerged as promising instruments.
Amongst these, the combination generally recognized as GLOW—comprising BPC-157, TB-500, and GHK-Cu—and the tripeptide KPV have garnered consideration for their potential synergistic effects.
This article delves into their mechanisms, advantages, and the scientific evidence supporting their use.
Irritation is a basic organic process, however when it becomes persistent, it can contribute to a variety of health issues.
Peptide Hub is not a compounding pharmacy or chemical compounding facility as defined under 503A of the Federal Food, Drug,
and Beauty Act. Peptide Hub just isn’t an outsourcing facility as
defined beneath 503B of the Federal Food, Drug, and Beauty Act.
At Peptide Hub, we’re dedicated to delivering precision and high quality with
every order. Our team’s expertise and rigorous requirements be certain that each product meets
the highest degree of purity and effectiveness.
Further research should give consideration to optimizing the delivery
techniques for KPV, exploring various nanoparticle formulations and encapsulation strategies to boost its efficacy and bioavailability.
To be taught more about KPV or to discover associated research merchandise,
see our Anti-Inflammatory Peptide Tag or search the location for analysis peptide classes.
best supplements for men to get ripped
benefits of steroids