Tightening Liquidity: Short Commodities & Treasuries, Long Dollar
Welcome to our official publication of the Prometheus ETF Portfolio. The Prometheus ETF portfolio systematically combines our knowledge of macro & markets to create an active portfolio that aims to offer high risk-adjusted returns, durable performance, & low drawdowns. Given its systematic nature, we have tested the Prometheus ETF Portfolio through decades of history and have shown its durability. For those of you who are unacquainted with our systematic process, we offer a detailed explanation here:
In this publication, we will discuss the performance, positioning, & risks of the Prometheus ETF Portfolio and it will be published every week on Fridays to help investors understand how our systematic process is navigating through markets. Before diving into our ETF Portfolio positions, we think it is important for subscribers to understand the context within which our systems choose their exposures. Below, we offer our latest Month In Macro note, which contains the conceptual underpinnings of our systematic process within the context of the latest economic data:
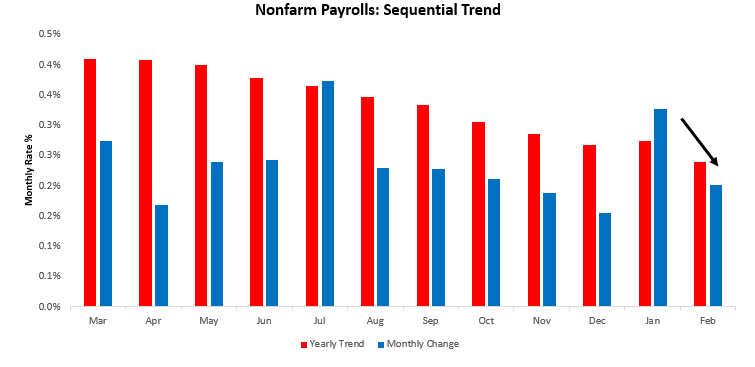
Economic data for February is starting to emerge, starting this week with labor market data. We begin by showing nonfarm payrolls. Nonfarm Payrolls increased 0.18% in February, surprising consensus expectations of 0.15%. This print contributed to a sequential deceleration in the quarterly trend relative to the yearly trend. Below, we show the monthly evolution of the data relative to its 12-monthly trend and consensus expectations.
More timely jobless claims data somewhat telegraphed this deceleration in data. Initial & Continuing Jobless claims surprised expectations coming at 211 & 1718 versus the expected 205 & 1660, respectively. Below, we show the history of these measures, along with the continuing claims rate, after adjusting these measures to provide an apples-to-apples comparison. Additionally, we combine these measures into a Jobless Claims Aggregate to capture the broad trend in the data:

Additionally, we show the recent evolution of Jobless Claims Data over the last twelve weeks. Our tracking of Jobless Claims currently tells us that we are a ways off from recessionary territory:

While claims data continue to suggest that we are far from recessionary conditions, we think it is important to recognize that by the time claims data tell us that we are in a recession, it will likely be amidst or after the worst for markets. When we look at the bigger picture drivers of this ongoing expansion, we see early indications that January’s strong start is likely to reverse in February. For more details on our views, please refer to our most recent Month in Macro.
Summarily, January saw a large spike in employment & hours worked, which increased nominal income, which resulted in nominal spending, and relative to output, this created further inflation. From our initial read-through of the most recent data, we see that the pressure is on for nominal incomes to slow significantly in January. Below, we show nominal income by sector broken into its macroeconomic drivers, i.e., wages, hours & employment:

As we can see above, the number of hours worked has declined across sectors. This is likely to be a function of businesses cutting back on the hours worked by employees as real sales continue to be weak. The combination of these factors creates an environment where barring a significant reduction in savings rates or an increase in government income, real consumer spending is likely to be contractionary.
Within this broader context, we must recognize that we are at a turning point in the economic cycle. The initial conditions for a contraction in real GDP have been met, with liquidity tightening and business activity contraction. Whether we are right about this shift and its timing remains to be seen. However, when assessing risk today especially when buying assets, the reward to risk is increasingly skewed to the downside. There are particular points in the economic cycle when macroeconomic conditions create extremely favorable reward-to-risk ratios today is far from one of them for both stocks and bonds. As active investors, we must leverage these periods to create the best return streams.
In the case of bonds, this means buying bonds as expectations for policy easing take hold as real economic growth collapses. Counter to popular ideas in financial media, this implies buying yield curves during inversions and profiting as discount rates fall to support the economy. We show one of our Prometheus Cycle Strategies below:

In contrast, stocks find their worst performance during these periods and only begin to show strong return/risk characteristics as growth bottoms, inflation has been tamed, and liquidity remains abundant. We show one of our Prometheus Cycle Strategies below:

As we see above, despite infrequent market exposure, carefully selecting periods to increase exposure based on macroeconomic conditions can pay off handsomely. We have developed various tools to help systematically navigate these points Prometheus Cycle Strategies. If these interest you, please let us know in the comments below as we decide whether to share them regularly.
Most importantly, we think it is important to understand that we are in the stage of the economic cycle that favors neither bond nor stock beta. We believe economic conditions are far from where equities will receive cyclical support. However, bonds are increasingly of interest as real growth continues to weaken. However, we aren’t there yet. There will come a time to buy bonds, stocks, and then both, and we intend to do so with both hands but that remains a ways off in the economic cycle.
For the time being, we stay nimble and tactical. Turning t performance this week, our Prometheus ETF Portfolio suffered losses as our tactical disinflationary bets on equities dragged on performance, while our bets on a higher dollar and gold helped soften the blow:

This week’s price action contributed to a 1.4% loss for the Promtheue ETF Portfolio. This loss was well within our expected outcomes, and while this has been the most sizeable loss since inception, we find little cause for concern. Turning to next week, our systems are looking to positon as follows:
below:
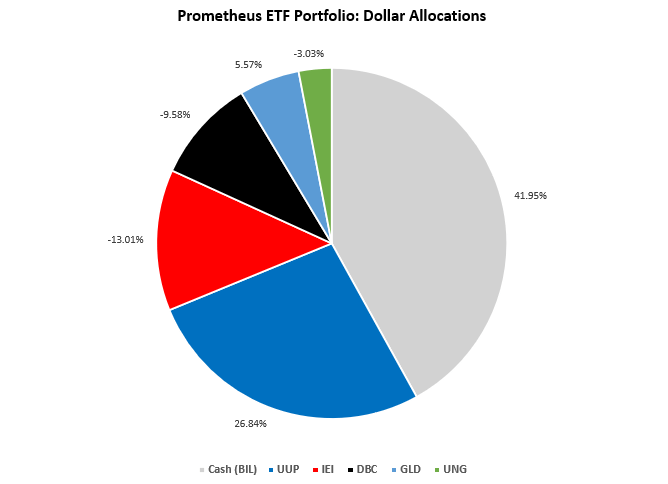
Positions: Cash (BIL): 41.95% UUP : 26.84% IEI : -13.01% DBC : -9.58% GLD : 5.57% UNG : -3.03%
At the asset class level:

This portfolio allocation has an expected volatility of 5.3%, with a maximum expected volatility of 10%. While the asset class base of this portfolio is adequately diverse, the combination of these bets reflects our system views that liquidity conditions are likely to drive markets lower, making cash and the dollar more attractive. Our short fixed-income positions reflect a tactical trade, fading the aggressive bear market spike in IEI, despite the tightening liquidity backdrop. Therefore, the primary risk to this allocation is any improvement in liquidity conditions is expected to hurt this allocation. We think this exposure is one to manage if you can actively trade, as a potential CPI disappointment would likely be a net support to all assets and a drag on the dollar. Unfortunately, the team will be taking some much-needed time off over the next few days, and we cannot provide our pre-CPI primer with existing data. Until next week.