Long Nominal Growth
Welcome to our official publication of the Prometheus ETF Portfolio. The Prometheus ETF portfolio systematically combines our knowledge of macro & markets to create an active portfolio that aims to offer high risk-adjusted returns, durable performance, & low drawdowns. Given its systematic nature, we have tested the Prometheus ETF Portfolio through decades of history and have shown its durability. For those of you who are unacquainted with our systematic process, we offer a detailed explanation here:
In this publication, we will discuss the performance, positioning, & risks of the Prometheus ETF Portfolio and it will be published every week on Fridays to help investors understand how our systematic process is navigating through markets. Before diving into our ETF Portfolio positions, we think it is important for subscribers to understand the context within which our systems choose their exposures. Below, we offer our latest Month In Macro note, which contains the conceptual underpinnings of our systematic process within the context of the latest economic data:
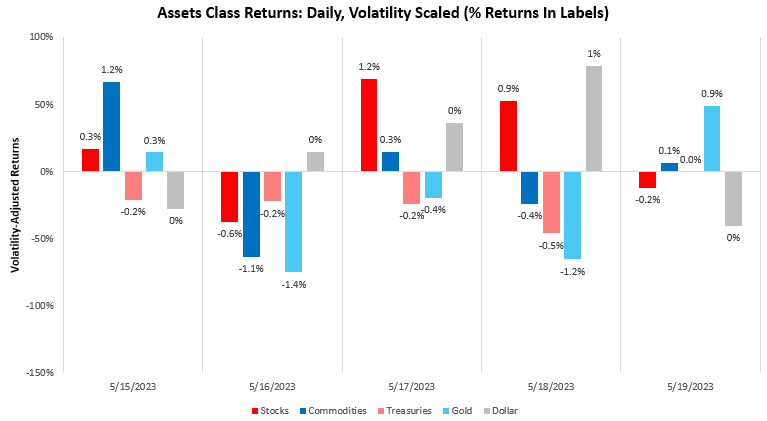
Last week showed better conditions for growth-biased allocations, i.e., stocks and commodities, while gold and bonds suffered significantly. Below, we show the daily path of asset returns:

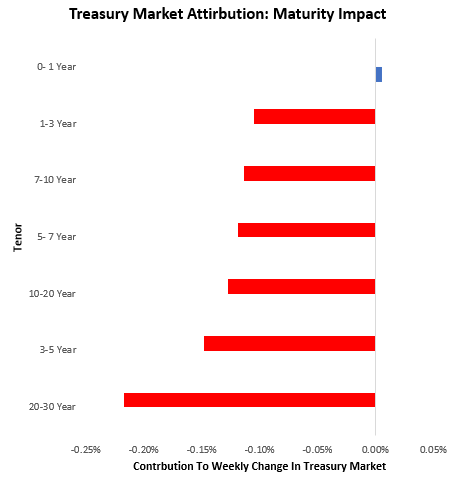
As we can see above, bond markets suffered significantly. Below, we show the composition of this weakness, which was across the curve as the market moved to price-less interest rate cuts:
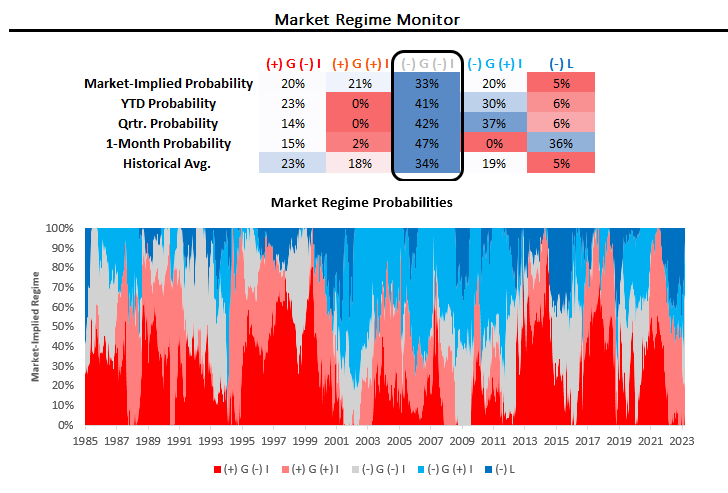
Despite this recent change in market movements, our market-implied regimes continue to show the persistence of disinflationary cross-asset pricing across durations, largely driven by the significant losses in the commodity complex. We show our regime monitors below:
To help contextualize and profit from macroeconomic asset-class moves, we have developed a set of trend filters to help us better evaluate the sustainability of asset-class moves. As always, we have tested these trend measures over time to understand whether they can help reliably generate an edge in markets. These measures are currently suggesting long positions in stocks, flat 10-year Treasuries, short commodities, and long gold. As proof of concept, we show how these combined signals have performed relative to an underlying portfolio of the same four assets.
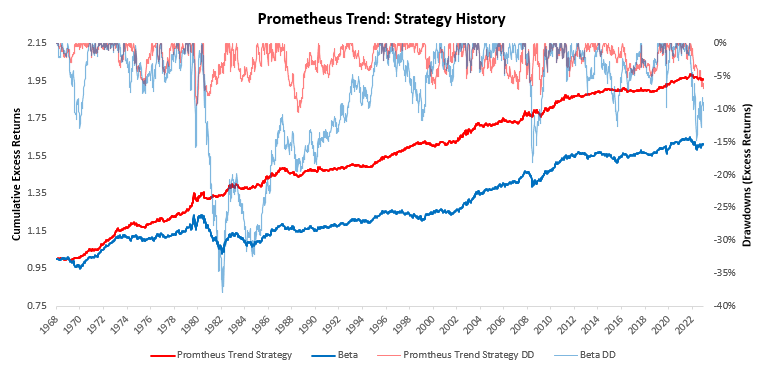
As we can see, our active, four-asset Prometheus Trend Strategy handily outperforms the underlying beta. We zoom in on the signals coming from this system to get an understanding of the dynamics at play today.
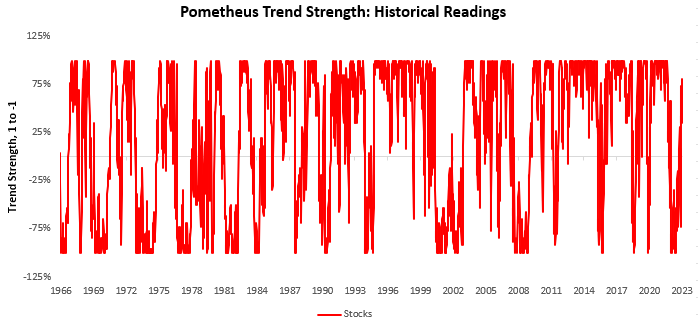
We start with equity markets, where we see increasingly bullish trend strength:
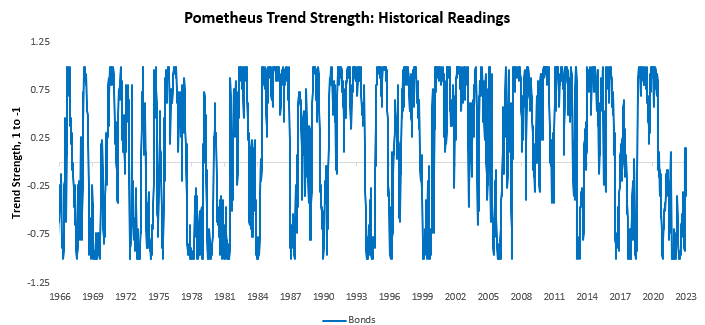
And turn to bond markets, which remain neutral:
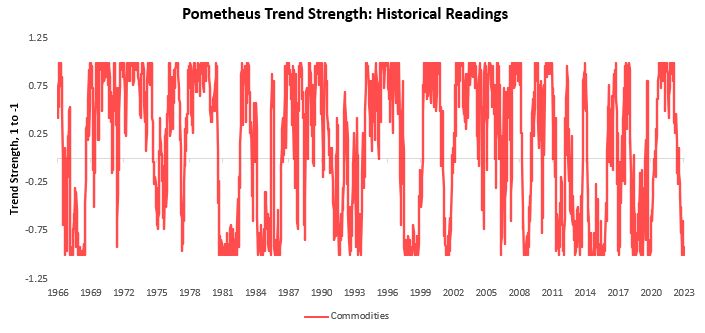
While commodity markets remain decidedly bearish:
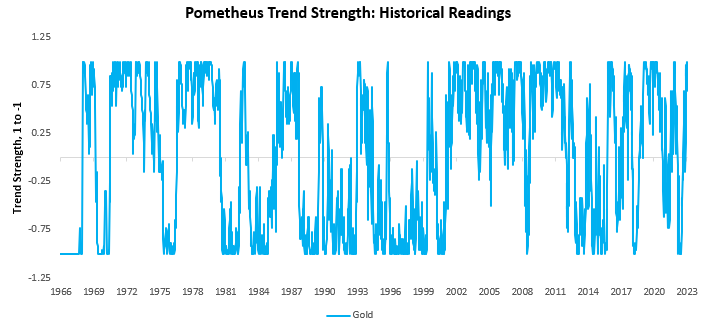
And finally, gold continues to offer diversifying and bullish characteristics:
Remember that these signals may not always conform with those in the Prometheus ETF Portfolio due to different objectives and the inclusion of economic factors in the Prometheus ETF Portfolio. However, when these signals align, we have a higher confidence level.
Turning to our Prometheus ETF Portfolio: Over the last week, the Prometheus ETF Portfolio was down by -0.52%. Below, we show the contributions to this portfolio performance across securities:
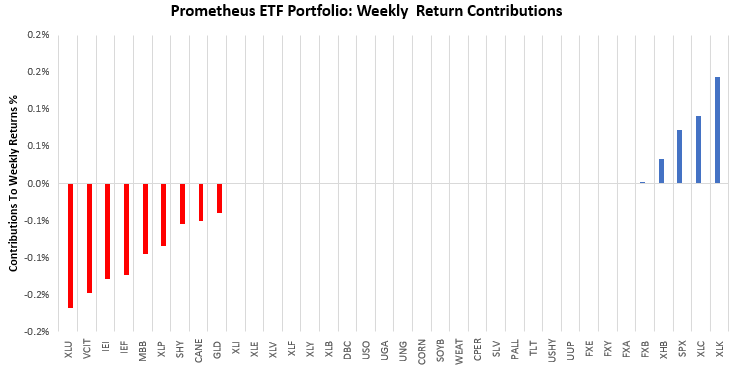
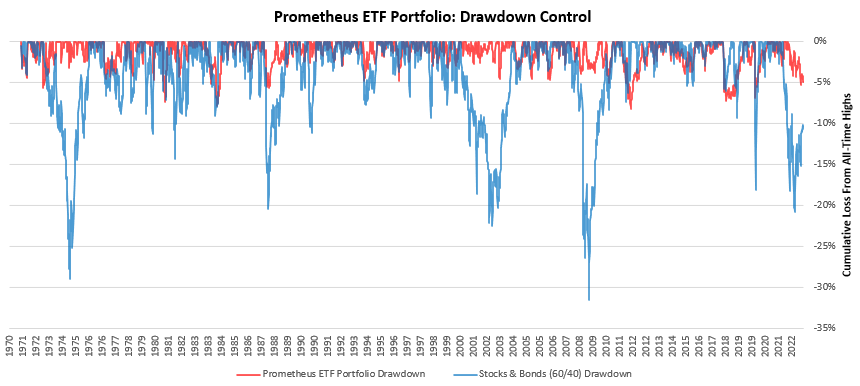
As we can see, losses are modestly skewed towards the downside, with our equity & corporate bond positions caught offside. This loss was well within our expected parameters, and we see little cause for concern at the junction. While we have seen a few consecutive losses, our systems continue to control the drawdown extremely well. We show how, despite having a choppier market performance, our drawdown control still places us close to all-time highs.
Turning to next week, our systems are looking to position the Prometheus ETF Portfolio, as shown below. The portfolio contains 13 positions heading into next week. We show these below:
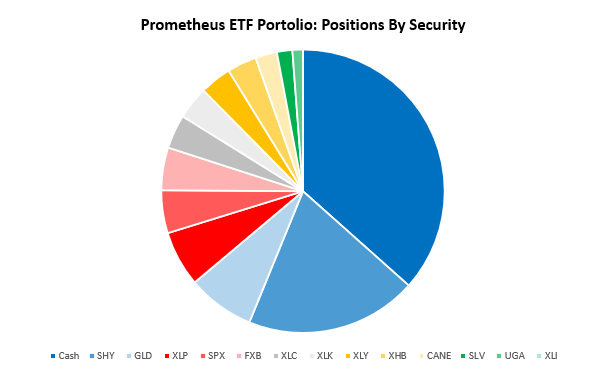
POSITIONS: Cash: 36.59% SHY : -19.6% GLD : 7.68% XLP : 6.35% SPX : 4.89% FXB : 4.87% XLC : 3.88% XLK : 3.74% XLY : 3.6% XHB : 3.37% CANE: 2.47% SLV : 1.76% UGA : 1.2% . Please note if cash position is negative it implies leverage.
Additionally, we show these positions aggregated into asset class allocations below:
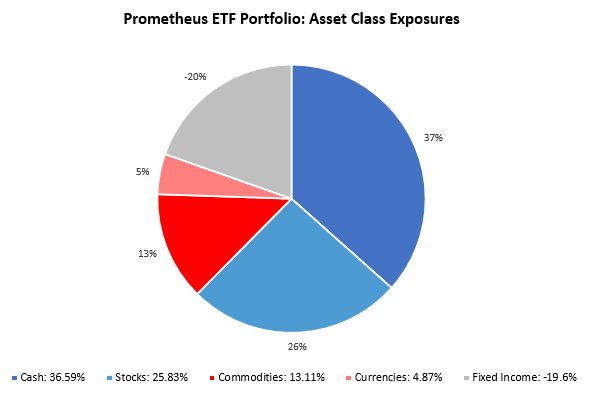
The portfolio has a net exposure (ex-cash) of 24.22%, with a gross exposure (ex-cash) of 63.41%. This allocation has an expected volatility of 5.01%, with maximum expected volatility of 10%. We think it is important to note that resilient nominal growth data, still elevated liquidity, and persistent trend factors have now moved our systems to short the 1-3 Year ETF. This is fairly different from recent positioning, where we were long duration across the curve as disinflationary forces were in play. Over time, we expect the persistence of inflationary pressures to change market pricing significantly, even as real growth continues to deteriorate. Active management matters more than it has in a long time in recent history. Until next week.