Welcome to our official publication of the Prometheus ETF Portfolio. Our primary takeaways for last week are as follows:
- Markets moved to price-in resilient nominal growth conditions, consistent with the trend in economic data.
- We expect headwinds for assets ahead as the policy liquidity drain begins to pick up its pace.
- Crosscurrents have begun to emerge in equities, with growth expectations elevated. We think staying close to the exits is important here. Dynamics continue to favor stocks versus bonds until activity decisively turns.
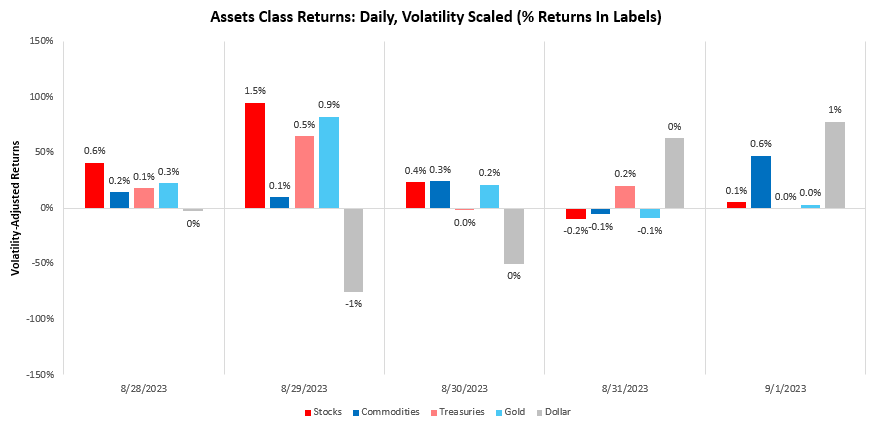
Let’s dive into the data driving our assessment. Over the last week, our systems moved to price-in rising real growth, with Stocks rising by 2.4%. We show the daily path of returns through the week:
Using our understanding of cross-asset market pricing, we can derive the market-implied odds of varying regimes of growth, inflation, and liquidity. Currently, our proprietary process suggests that we are in a period of (+) G (-) I (+) L. We show our market regime monitor below:
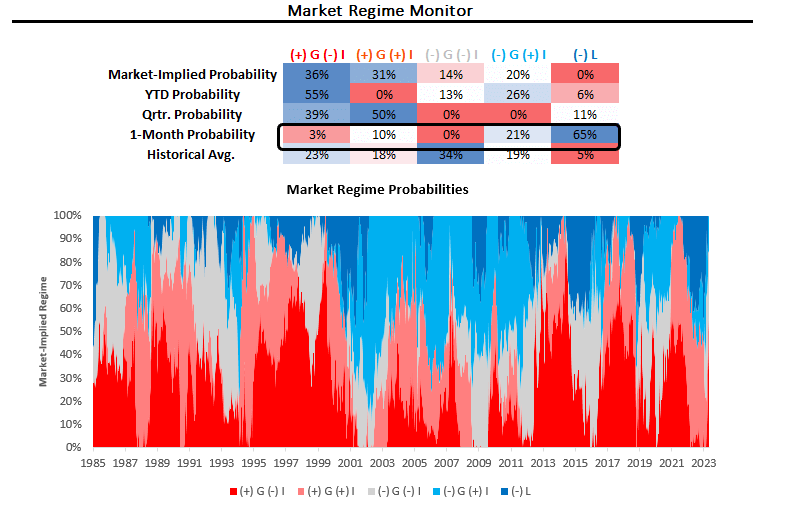
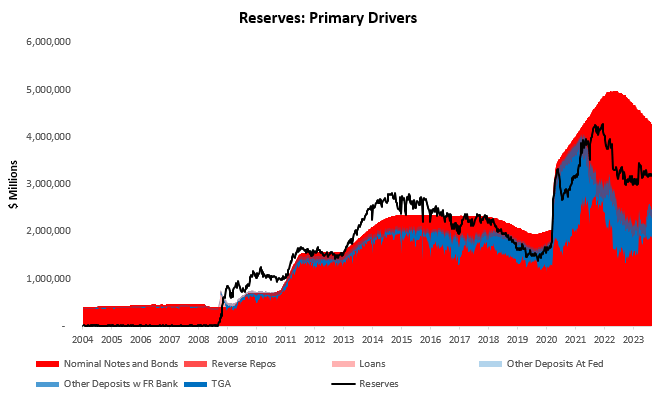
As we can see above, the most recent market pricing has been consistent with tightening liquidity, though longer-duration pricing has yet to show this. We expect this tightening of liquidity conditions to persist, driven by the resumption of reserve balance drawdown through the combination of QT & Treasury issuance. Below, we show the reserve balances held at the Fed and the primary driver of strength (in blue) and weakness (in red):
We expect this change in bank reserves to drag on all markets over the next quarter, taking us into a consistent tightening liquidity path once again. Recall all assets suffer during periods of tightening liquidity. This is likely ahead of us, we show our estimates for the path of reserves below:
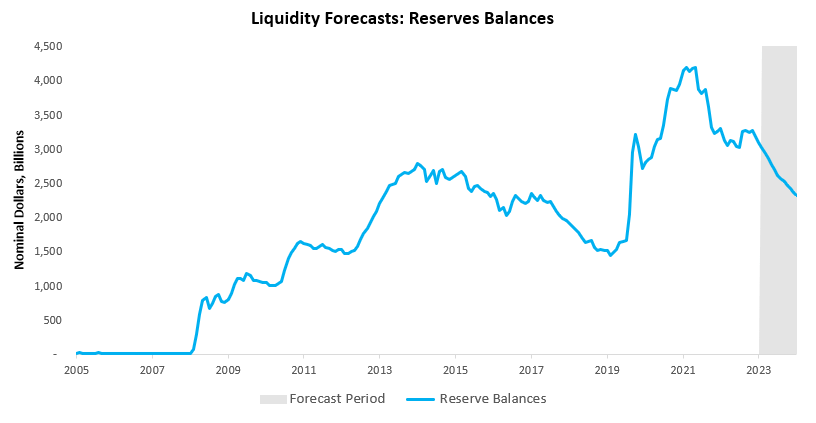
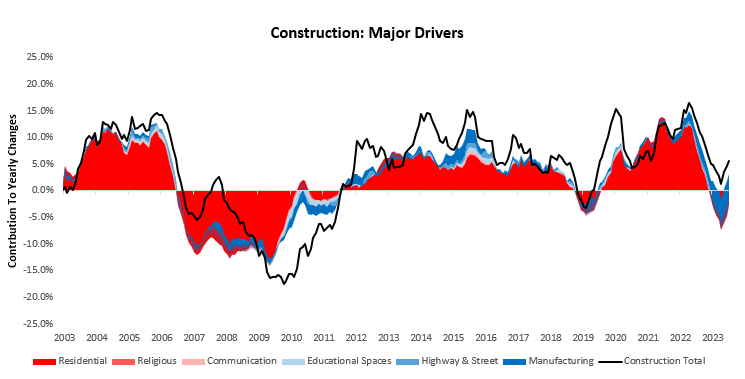
Barring changes to this path, we expect this to be a significant drag on all assets. Now, while liquidity determines returns across asset classes, growth, and inflation determine the relative returns between asset classes. Over the last week, the market reflected economic data, which showed continued resilience in economic activity. Construction spending, personal consumption, ISM Manufacturing PMIs, initial claims, and nonfarm payrolls all came in better than expected. We look through each.
The most recent data for July show construction spending increased by 0.7%, with 0.63% and 0.06% coming from residential and nonresidential spending, respectively. This data surprised consensus expectations of 0.5% and contributed to an acceleration in the twelve-month trend. Zooming out, we show the evolution of construction spending over the last year, which rose by 5.53. This was driven by a -2.7% decrease in residential spending and an 8.23% rise in nonresidential spending. Below, we drill down further to show the top 3 drivers of strength in blue (Manufacturing, Highway & Street, and Educational Spaces) and the top 3 drivers of weakness in red (Residential, Religious, and Communication):
The divergence between residential and nonresidential construction remains in play:
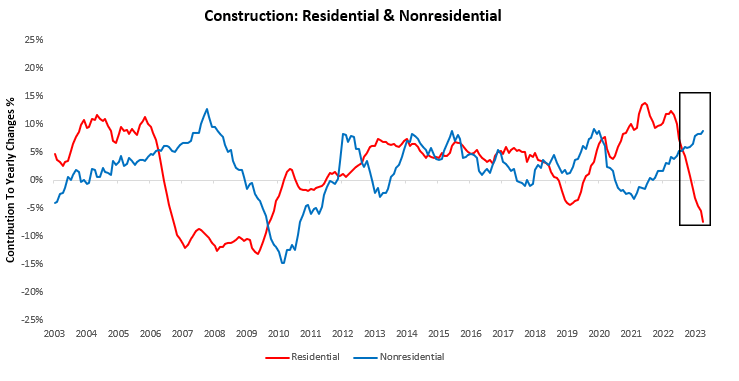
As we have detailed in prior research, this divergence is driven by manufacturing construction investment, which remains extremely elevated due to sizable investments by firms to increase semiconductor production:
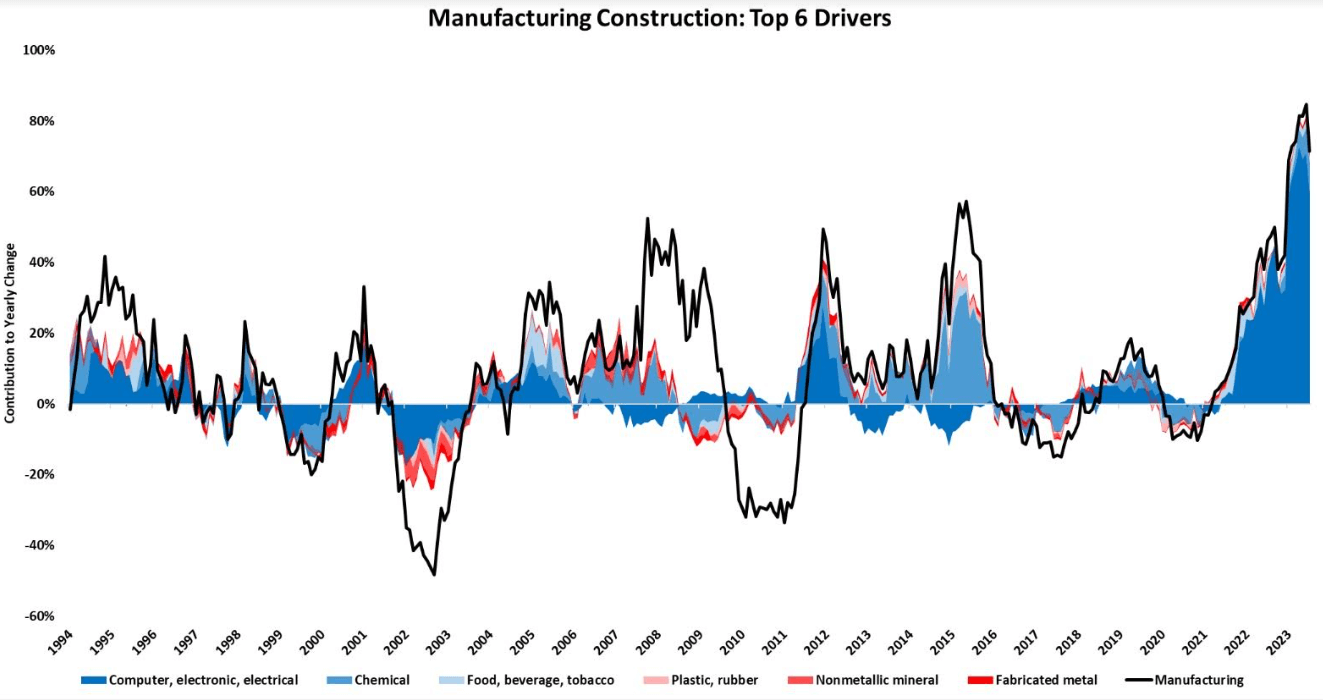
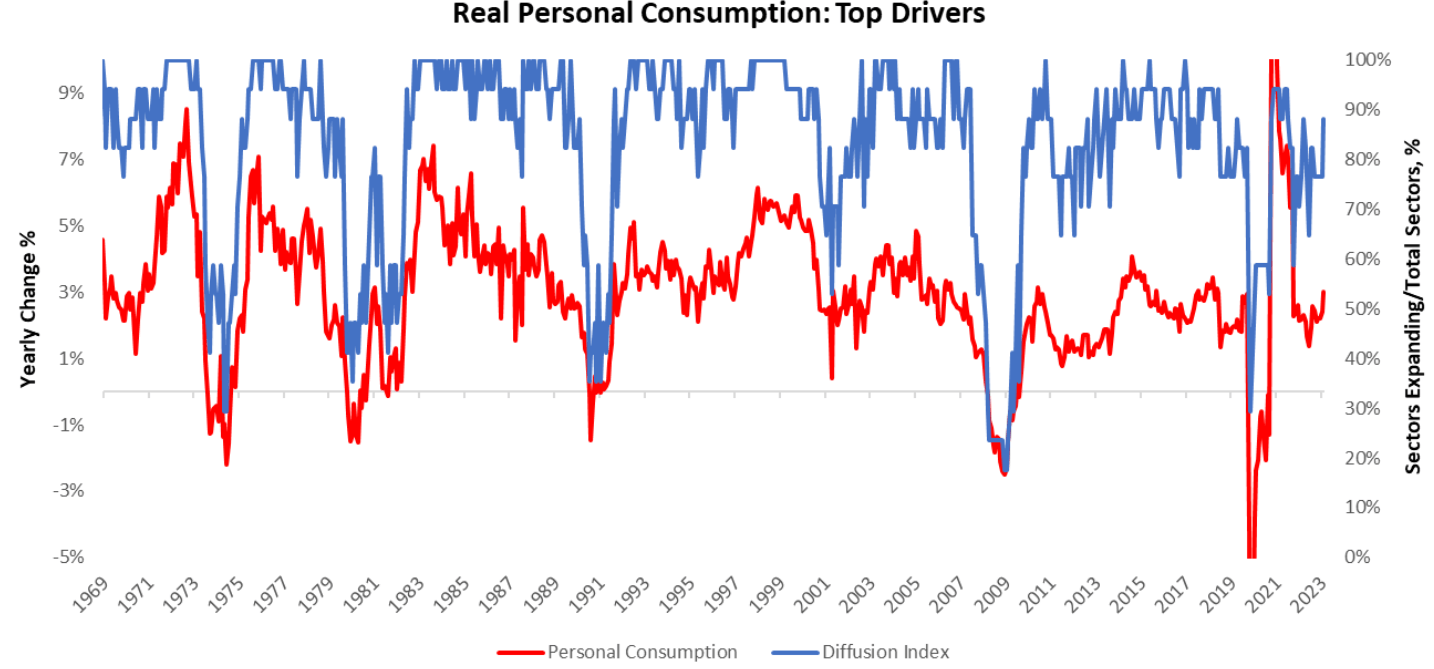
This spending is likely to remain an ongoing contributor to the resilience of nominal spending. Next, we turn to consumption, which, much like residential spending, showed continued resilience across categories:
Next, we turn to ISM manufacturing data, which sequentially improved within a weak trend. The ISM Manufacturing data showed a contractionary reading of 47.6, surprising consensus expectations of 47: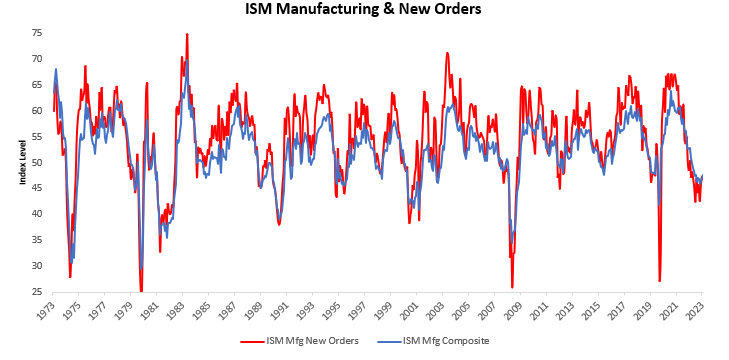
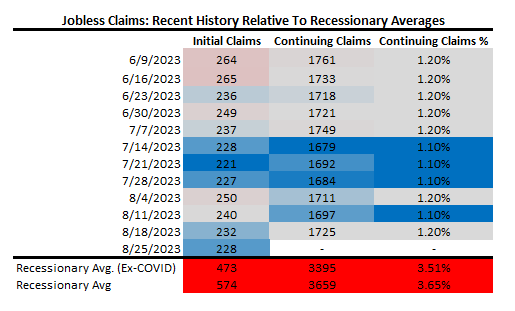
Additionally, jobless claims data continued to remain far from recessionary territory. In fact, they sequentially softened:
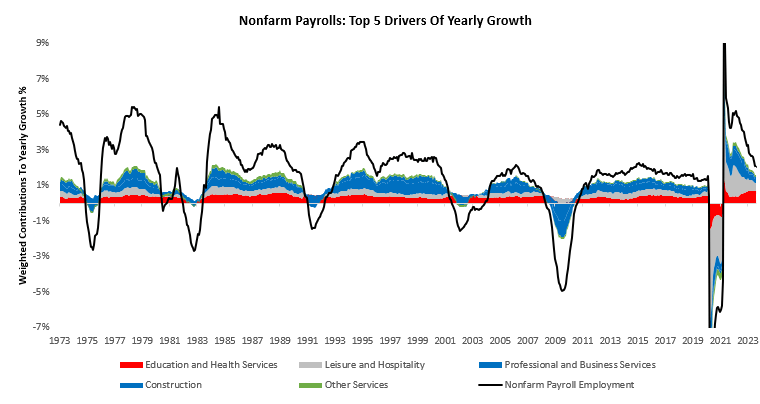
These employment conditions were further confirmed by slower-moving nonfarm payroll data. Nonfarm Payrolls increased 0.12% in August, surprising consensus expectations of 0.11%. This print contributed to a sequential deceleration in the quarterly trend relative to the yearly trend.
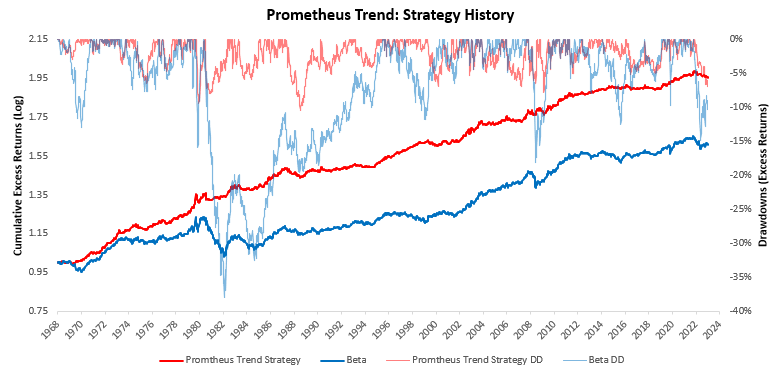
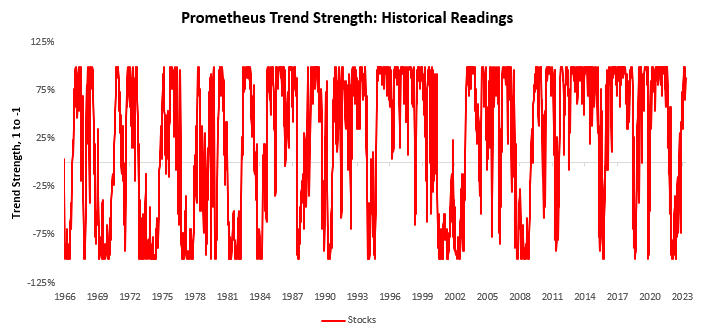
Overall, this was a week where economic resilience showed in the data, largely due to the acyclical nature of the data reported, which favored assets exposed to nominal growth. We see this in our trend measures as well. For context— we have developed a set of trend filters to help us better evaluate the sustainability of asset-class moves. As always, we have tested these trend measures over time to understand whether they can help reliably generate an edge in markets. As proof of concept, we show how these combined signals have performed relative to an underlying portfolio of the same four assets:
Currently, these signals suggest long positions in stocks, short positions in bonds, long positions in commodities, and long positions in gold.
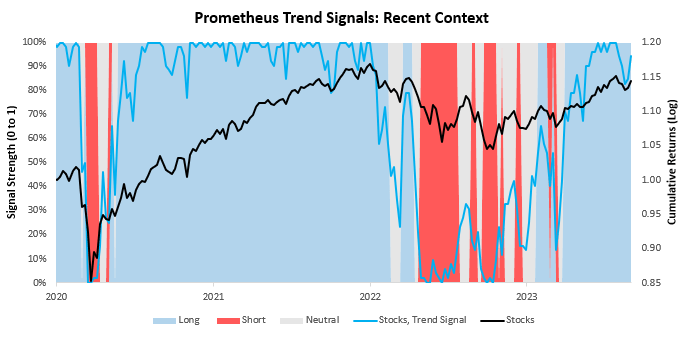
We begin by showing our signals for stocks. We show both the full signal history and the most recent signal context:
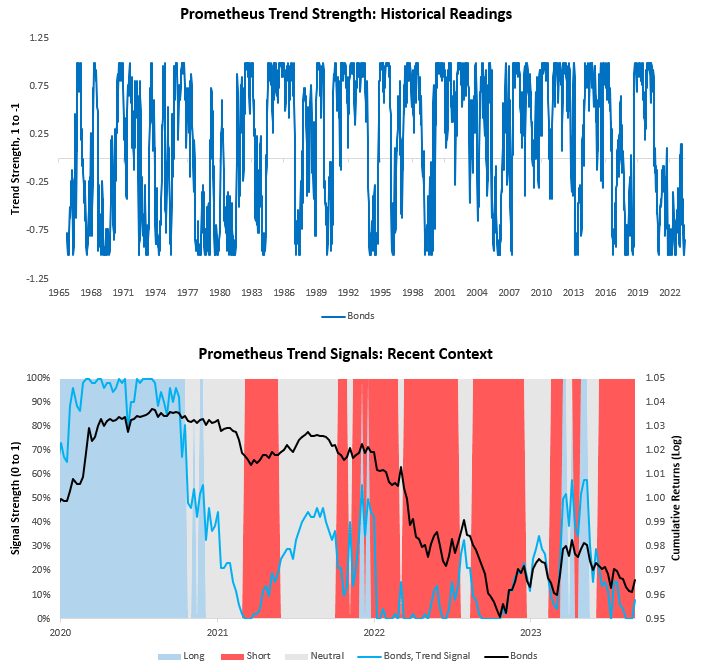
Next, we show our system’s current readings for 10-Year Treasuries:
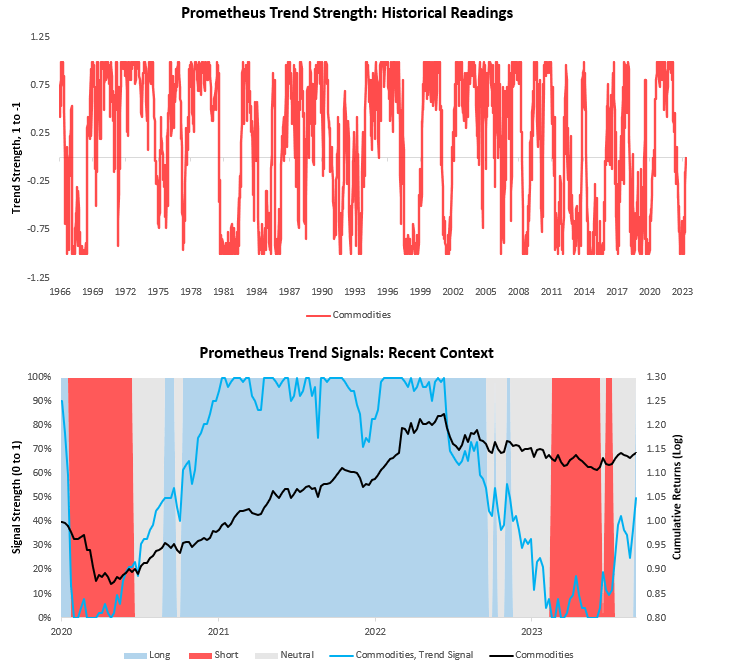
We now turn our attention to commodities:
Finally, we show our trend signals for gold:
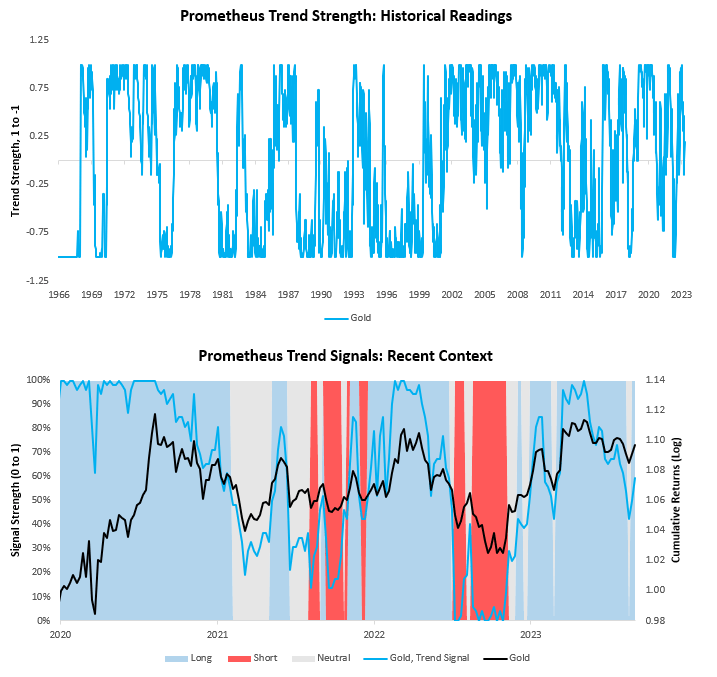
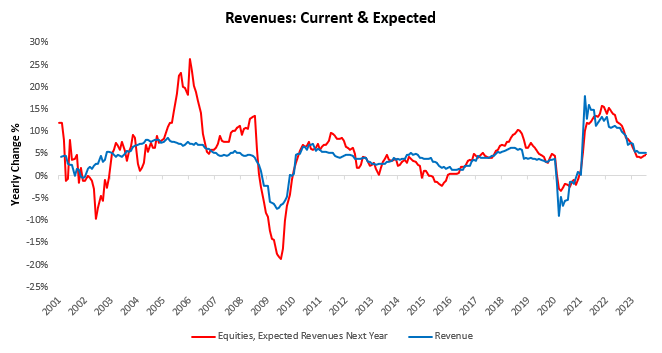
Now, while these cross-asset trends continue to signal a positive outlook for nominal growth, we think it is time to start watching for a turn in equities. Revenue expectations largely follow the path of realized revenues, and our expectation is that further deceleration in nominal GDP is in the cards after a period of brief stabilization. Thus, we think there is potential for revenue expectations to decline alongside tightening liquidity:
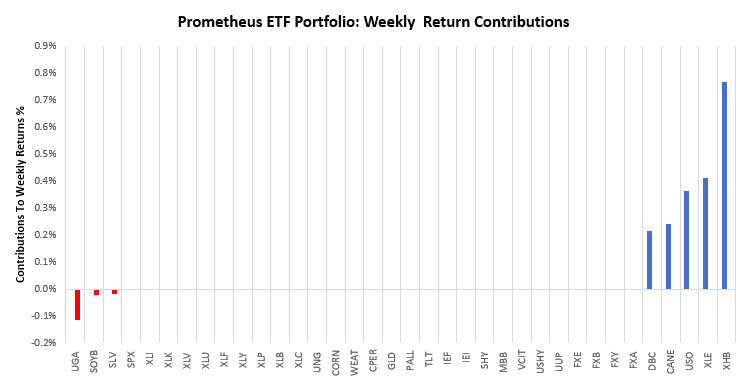
Thus, while we continue to stay positioned for nominal growth, we stay close to the exits in the event these dynamics change meaningfully in the coming weeks. In this context, our systematic Prometheus ETF Portfolio was well-positioned last week. Over the last week, the Prometheus ETF Portfolio was up by 0.99%. Below, we show the contributions to this portfolio performance across securities:
Turning to next week, our systems are looking to position the Prometheus ETF Portfolio as shown below. The portfolio contains 18 positions heading into next week. We show these below:
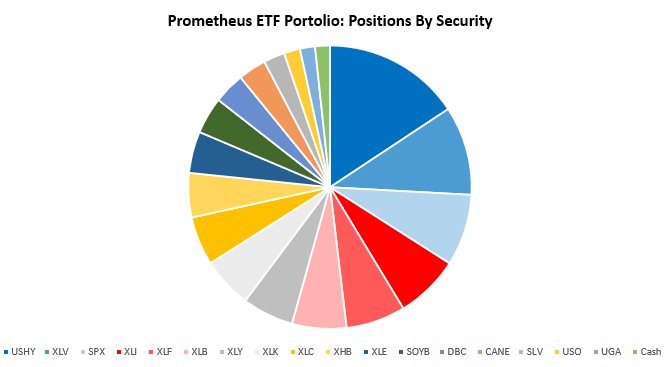
POSITIONS: USHY: 16.25% XLV : 10.51% SPX : 8.46% XLI : 7.57% XLF : 7.02% XLB : 6.42% XLY : 6.08% XLK : 5.99% XLC : 5.77% XHB : 5.24% XLE : 4.91% SOYB: 4.34% DBC : 3.68% CANE: 3.33% SLV : 2.51% USO : 1.91% UGA : 1.77% Cash: -1.75% . Please note if cash position is negative it implies leverage.
Additionally, we show these positions aggregated into asset class allocations below:

The portfolio has a net exposure (ex-cash) of 101.75%, with a gross exposure (ex-cash) of 101.75%. This allocation has an expected volatility of 15.5%, with a maximum expected volatility of 10%. Next week is relatively muted in terms of the data calendar. We will be monitoring durable goods orders on Tuesday to understand the dynamics at play in the automobile industry. Until next week.
Muchas gracias. ?Como puedo iniciar sesion?
I don’t even know how I ended up here, but I thought this post was good. I do not know who you are but certainly you are going to a famous blogger if you are not already 😉 Cheers!
Hey this is kind of of off topic but I was wondering if blogs use WYSIWYG editors or if you have to manually code with HTML. I’m starting a blog soon but have no coding knowledge so I wanted to get guidance from someone with experience. Any help would be enormously appreciated!
Hello there, You have done an incredible job. I’ll certainly digg it and personally recommend to my friends. I am sure they will be benefited from this website.
I’ve been absent for a while, but now I remember why I used to love this website. Thank you, I?¦ll try and check back more frequently. How frequently you update your site?
I truly appreciate this post. I have been looking all over for this! Thank goodness I found it on Bing. You have made my day! Thanks again!
It’s truly a great and useful piece of information. I am happy that you shared this helpful information with us. Please stay us informed like this. Thank you for sharing.
I’ve read a few good stuff here. Definitely value bookmarking for revisiting. I wonder how much effort you put to create the sort of wonderful informative website.
fantastic points altogether, you simply gained a brand new reader. What would you suggest about your post that you made some days ago? Any positive?
I discovered your blog website on google and examine a number of of your early posts. Proceed to keep up the superb operate. I simply extra up your RSS feed to my MSN Information Reader. In search of ahead to reading more from you in a while!…
F*ckin¦ amazing things here. I am very satisfied to see your post. Thanks so much and i am taking a look forward to touch you. Will you please drop me a e-mail?
Good write-up, I¦m regular visitor of one¦s web site, maintain up the nice operate, and It is going to be a regular visitor for a long time.
I know this if off topic but I’m looking into starting my own blog and was wondering what all is required to get setup? I’m assuming having a blog like yours would cost a pretty penny? I’m not very internet savvy so I’m not 100 positive. Any tips or advice would be greatly appreciated. Many thanks
Perfectly pent subject material, Really enjoyed examining.
naturally like your web site but you have to check the spelling on several of your posts. A number of them are rife with spelling issues and I find it very troublesome to tell the truth nevertheless I’ll definitely come back again.
Woah! I’m really digging the template/theme of this blog. It’s simple, yet effective. A lot of times it’s very difficult to get that “perfect balance” between usability and visual appearance. I must say you’ve done a amazing job with this. Also, the blog loads very fast for me on Chrome. Superb Blog!
obviously like your web-site however you need to test the spelling on several of your posts. Several of them are rife with spelling issues and I to find it very bothersome to tell the truth then again I will surely come back again.
hello!,I like your writing very much! share we communicate more about your post on AOL? I require a specialist on this area to solve my problem. May be that’s you! Looking forward to see you.
Loving the info on this site, you have done outstanding job on the articles.
You actually make it seem really easy along with your presentation but I in finding this topic to be really one thing that I believe I’d by no means understand. It sort of feels too complex and extremely wide for me. I am taking a look ahead for your next put up, I?¦ll try to get the hang of it!
Good post. I be taught one thing more difficult on totally different blogs everyday. It is going to all the time be stimulating to read content from different writers and practice somewhat something from their store. I’d desire to make use of some with the content material on my blog whether you don’t mind. Natually I’ll give you a hyperlink on your web blog. Thanks for sharing.
Good day! I know this is somewhat off topic but I was wondering which blog platform are you using for this site? I’m getting sick and tired of WordPress because I’ve had problems with hackers and I’m looking at options for another platform. I would be great if you could point me in the direction of a good platform.
I was looking through some of your articles on this internet site and I think this site is real instructive! Continue posting.
Having read this I thought it was very informative. I appreciate you taking the time and effort to put this article together. I once again find myself spending way to much time both reading and commenting. But so what, it was still worth it!
Yeah bookmaking this wasn’t a speculative decision outstanding post! .
Wow that was unusual. I just wrote an very long comment but after I clicked submit my comment didn’t show up. Grrrr… well I’m not writing all that over again. Anyway, just wanted to say excellent blog!
I simply needed to appreciate you once again. I do not know what I could possibly have sorted out in the absence of the type of strategies documented by you concerning such field. It absolutely was a terrifying concern in my opinion, but considering the very skilled fashion you solved that forced me to leap for delight. Now i’m happier for the information and then hope that you find out what a powerful job you are carrying out instructing the rest through your web blog. I am certain you’ve never encountered any of us.
Good day very nice website!! Guy .. Beautiful .. Amazing .. I’ll bookmark your blog and take the feeds also…I am satisfied to seek out a lot of helpful info right here in the post, we want develop more techniques in this regard, thank you for sharing. . . . . .
I love your writing style really loving this internet site.
Thanks for another excellent post. Where else could anybody get that type of info in such an ideal way of writing? I’ve a presentation next week, and I am on the look for such information.
Your style is so unique compared to many other people. Thank you for publishing when you have the opportunity,Guess I will just make this bookmarked.2
I am always looking online for articles that can help me. Thank you!
Some truly wonderful articles on this site, thank you for contribution. “A liar should have a good memory.” by Quintilian.
I got what you intend,bookmarked, very decent site.
I went over this internet site and I think you have a lot of great information, saved to favorites (:.
Hello. splendid job. I did not anticipate this. This is a fantastic story. Thanks!
Woh I love your posts, saved to fav! .
Great post, you have pointed out some excellent details , I too think this s a very fantastic website.
Hmm is anyone else having problems with the pictures on this blog loading? I’m trying to figure out if its a problem on my end or if it’s the blog. Any feedback would be greatly appreciated.
Fantastic website. Lots of useful info here. I am sending it to some friends ans also sharing in delicious. And naturally, thanks for your effort!
I have recently started a website, the information you offer on this web site has helped me tremendously. Thanks for all of your time & work. “Money is power, freedom, a cushion, the root of al evil, the sum of all blessings.” by Carl Sandburg.
Yay google is my queen aided me to find this great site! .
Hey, you used to write fantastic, but the last few posts have been kinda boringK I miss your super writings. Past several posts are just a little out of track! come on!
I am continually invstigating online for ideas that can facilitate me. Thanks!
I’m extremely impressed with your writing skills as neatly as with the layout to your blog. Is that this a paid topic or did you modify it your self? Anyway keep up the nice quality writing, it is uncommon to see a nice blog like this one today..
You made some nice points there. I looked on the internet for the issue and found most guys will agree with your blog.
whoah this blog is wonderful i love reading your articles. Keep up the good work! You know, a lot of people are searching around for this information, you could aid them greatly.
Very interesting information!Perfect just what I was searching for! “Charity is injurious unless it helps the recipient to become independent of it.” by John Davidson Rockefeller, Sr..
Great awesome issues here. I am very satisfied to look your post. Thank you so much and i am looking ahead to contact you. Will you kindly drop me a e-mail?
Hey There. I discovered your weblog the usage of msn. This is a really well written article. I will make sure to bookmark it and come back to read more of your helpful info. Thank you for the post. I will certainly return.
This design is spectacular! You certainly know how to keep a reader entertained. Between your wit and your videos, I was almost moved to start my own blog (well, almost…HaHa!) Fantastic job. I really enjoyed what you had to say, and more than that, how you presented it. Too cool!
Please let me know if you’re looking for a article author for your site. You have some really good articles and I think I would be a good asset. If you ever want to take some of the load off, I’d really like to write some content for your blog in exchange for a link back to mine. Please blast me an email if interested. Kudos!
I’ve been browsing online more than three hours today, but I never found any interesting article like yours. It is pretty value enough for me. In my view, if all website owners and bloggers made good content as you did, the internet might be much more helpful than ever before. “It’s all right to have butterflies in your stomach. Just get them to fly in formation.” by Dr. Rob Gilbert.
Some genuinely wondrous work on behalf of the owner of this site, utterly great articles.
Have you ever considered about adding a little bit more than just your articles? I mean, what you say is fundamental and everything. However just imagine if you added some great graphics or video clips to give your posts more, “pop”! Your content is excellent but with pics and clips, this blog could undeniably be one of the greatest in its field. Good blog!
Nice post. I learn something more challenging on different blogs everyday. It will always be stimulating to read content from other writers and practice a little something from their store. I’d prefer to use some with the content on my blog whether you don’t mind. Natually I’ll give you a link on your web blog. Thanks for sharing.
Its like you read my mind! You seem to know so much about this, like you wrote the book in it or something. I think that you could do with a few pics to drive the message home a bit, but instead of that, this is wonderful blog. A fantastic read. I will certainly be back.
You really make it appear really easy along with your presentation but I to find this matter to be actually one thing which I feel I would never understand. It seems too complicated and extremely wide for me. I am looking ahead for your next post, I will attempt to get the cling of it!
I real delighted to find this internet site on bing, just what I was searching for : D as well saved to fav.
I got what you intend, thanks for putting up.Woh I am lucky to find this website through google. “Wisdom doesn’t necessarily come with age. Sometimes age just shows up by itself.” by Woodrow Wilson.
Hey! Someone in my Myspace group shared this site with us so I came to check it out. I’m definitely loving the information. I’m bookmarking and will be tweeting this to my followers! Exceptional blog and fantastic style and design.
You made some first rate factors there. I seemed on the web for the difficulty and located most individuals will go along with along with your website.
Great – I should certainly pronounce, impressed with your site. I had no trouble navigating through all tabs and related information ended up being truly simple to do to access. I recently found what I hoped for before you know it at all. Quite unusual. Is likely to appreciate it for those who add forums or anything, web site theme . a tones way for your client to communicate. Excellent task.
Rattling nice design and style and wonderful subject material, nothing else we need : D.
But a smiling visitant here to share the love (:, btw great design.
Great blog here! Also your site loads up very fast! What web host are you the use of? Can I get your associate hyperlink to your host? I wish my web site loaded up as quickly as yours lol
I couldn’t resist commenting
I like this website very much so much great information.
The next time I read a blog, I hope that it doesnt disappoint me as much as this one. I mean, I know it was my choice to read, but I actually thought youd have something interesting to say. All I hear is a bunch of whining about something that you could fix if you werent too busy looking for attention.
I genuinely prize your work, Great post.
Oh my goodness! an incredible article dude. Thanks Nevertheless I am experiencing challenge with ur rss . Don’t know why Unable to subscribe to it. Is there anybody getting similar rss problem? Anybody who knows kindly respond. Thnkx
Thanks a bunch for sharing this with all of us you actually know what you are talking about! Bookmarked. Kindly also visit my web site =). We could have a link exchange contract between us!
You actually make it appear so easy along with your presentation however I find this topic to be actually one thing that I feel I’d never understand. It sort of feels too complex and extremely large for me. I am having a look ahead to your subsequent put up, I will attempt to get the cling of it!
I conceive this internet site has got very wonderful pent written content content.
Today, I went to the beachfront with my kids. I found a sea shell and gave it to my 4 year old daughter and said “You can hear the ocean if you put this to your ear.” She placed the shell to her ear and screamed. There was a hermit crab inside and it pinched her ear. She never wants to go back! LoL I know this is completely off topic but I had to tell someone!
Hi there very nice blog!! Man .. Beautiful .. Superb .. I will bookmark your blog and take the feeds also?KI’m happy to seek out so many useful information right here within the publish, we need develop more strategies on this regard, thanks for sharing. . . . . .
Do you mind if I quote a couple of your posts as long as I provide credit and sources back to your site? My blog is in the exact same niche as yours and my visitors would truly benefit from some of the information you present here. Please let me know if this ok with you. Regards!
Thanks for some other magnificent post. The place else may anyone get that kind of info in such an ideal means of writing? I’ve a presentation next week, and I’m at the search for such info.
Fantastic web site. Lots of useful info here. I am sending it to a few pals ans additionally sharing in delicious. And naturally, thank you on your sweat!
After all, what a great site and informative posts, I will upload inbound link – bookmark this web site? Regards, Reader.
whoah this blog is magnificent i love reading your articles. Keep up the good work! You know, many people are hunting around for this info, you could aid them greatly.
As soon as I discovered this web site I went on reddit to share some of the love with them.
I was looking at some of your posts on this site and I believe this site is rattling instructive! Retain posting.
I have been browsing online greater than three hours these days, yet I by no means discovered any fascinating article like yours. It’s pretty price enough for me. Personally, if all web owners and bloggers made excellent content as you probably did, the net shall be a lot more helpful than ever before.
Everything what you want to know about pills.
can you get generic lisinopril prices
A beacon of excellence in pharmaceutical care.
Can I just say what a relief to find someone who actually knows what theyre talking about on the internet. You definitely know how to bring an issue to light and make it important. More people need to read this and understand this side of the story. I cant believe youre not more popular because you definitely have the gift.
I have been absent for some time, but now I remember why I used to love this site. Thank you, I will try and check back more frequently. How frequently you update your web site?
Would you be focused on exchanging hyperlinks?
Respect to op, some good selective information.
Your style is so unique compared to many other people. Thank you for publishing when you have the opportunity,Guess I will just make this bookmarked.2
Thank you for sharing superb informations. Your web site is very cool. I’m impressed by the details that you have on this web site. It reveals how nicely you understand this subject. Bookmarked this web page, will come back for more articles. You, my friend, ROCK! I found simply the information I already searched everywhere and just could not come across. What an ideal web-site.
Some truly great info , Gladiolus I observed this. “It’s amazing what ordinary people can do if they set out without preconceived notions.” by Charles Franklin Kettering.
Great beat ! I wish to apprentice while you amend your web site, how can i subscribe for a blog web site? The account helped me a acceptable deal. I had been a little bit acquainted of this your broadcast offered bright clear concept
What side effects can this medication cause?
where to buy cytotec pills
This international pharmacy offers top-tier service globally.
Very well written article. It will be beneficial to everyone who usess it, as well as me. Keep up the good work – looking forward to more posts.
This really answered my problem, thank you!
I simply wanted to say thanks yet again. I’m not certain what I would have implemented in the absence of the entire tactics contributed by you regarding this subject matter. It became the terrifying difficulty in my circumstances, nevertheless observing this skilled form you resolved the issue forced me to weep for joy. Extremely happier for the support and believe you really know what a great job that you’re getting into instructing most people thru your website. I am sure you haven’t met any of us.
I think other site proprietors should take this website as an model, very clean and magnificent user friendly style and design, let alone the content. You’re an expert in this topic!
I think other web-site proprietors should take this website as an model, very clean and fantastic user genial style and design, as well as the content. You’re an expert in this topic!
This site truly stands out as a great example of quality web design and performance.
When I originally commented I clicked the “Notify me when new comments are added” checkbox and now each time a comment is added I get several e-mails with the same comment. Is there any way you can remove me from that service? Bless you!
A perfect blend of aesthetics and functionality makes browsing a pleasure.
Simply desire to say your article is as astonishing. The clearness to your submit is just spectacular and i could assume you’re knowledgeable in this subject. Fine with your permission let me to snatch your feed to stay up to date with impending post. Thanks 1,000,000 and please carry on the rewarding work.
It provides an excellent user experience from start to finish.
I really appreciate your piece of work, Great post.
I’m really impressed by the speed and responsiveness.
Prescription Drug Information, Interactions & Side.
can i get gabapentin
Love their range of over-the-counter products.
This is a topic close to my heart cheers, where are your contact details though?
The layout is visually appealing and very functional.
Their online refill system is straightforward.
how can i get generic clomid without a prescription
Some are medicines that help people when doctors prescribe.
I not to mention my pals were actually studying the great guides from your web site then then developed a horrible feeling I had not expressed respect to the web blog owner for those tips. These boys became absolutely happy to read through them and have in effect absolutely been tapping into those things. Thanks for being very kind as well as for opting for this kind of nice themes millions of individuals are really needing to know about. Our sincere apologies for not saying thanks to you earlier.
Mitolyn is a cutting-edge natural dietary supplement designed to support effective weight loss and improve overall wellness.
Love their spacious and well-lit premises.
buying generic cipro
I’m grateful for their around-the-clock service.
I love how user-friendly and intuitive everything feels.
The Natural Mounjaro Recipe is more than just a diet—it’s a sustainable and natural approach to weight management and overall health.
This site truly stands out as a great example of quality web design and performance.
Mitolyn is a cutting-edge natural dietary supplement designed to support effective weight loss and improve overall wellness.
I’m really impressed by the speed and responsiveness.
The Natural Mounjaro Recipe is more than just a diet—it’s a sustainable and natural approach to weight management and overall health.
The content is engaging and well-structured, keeping visitors interested.
PrimeBiome is a dietary supplement designed to support gut health by promoting a balanced microbiome, enhancing digestion, and boosting overall well-being.
I love how user-friendly and intuitive everything feels.
ProstaVive is a dietary supplement designed to promote prostate health, support urinary function, and improve overall well-being in men, especially as they age.
Admiring the time and effort you put into your site and detailed information you offer. It’s great to come across a blog every once in a while that isn’t the same old rehashed material. Excellent read! I’ve bookmarked your site and I’m including your RSS feeds to my Google account.
This site truly stands out as a great example of quality web design and performance.
The design and usability are top-notch, making everything flow smoothly.
The design and usability are top-notch, making everything flow smoothly.
I love how user-friendly and intuitive everything feels.
Wow! Thank you! I always wanted to write on my site something like that. Can I include a portion of your post to my site?
I conceive you have remarked some very interesting details, regards for the post.
I don’t even know how I ended up here, but I thought this post was great. I don’t know who you are but certainly you’re going to a famous blogger if you are not already 😉 Cheers!
Wonderful blog! I found it while searching on Yahoo News. Do you have any suggestions on how to get listed in Yahoo News? I’ve been trying for a while but I never seem to get there! Cheers
I love your writing style truly enjoying this internet site.
Nothing beats homemade pasta. The texture and flavor are just on another level compared to store-bought versions. Cooking from scratch is truly an art.
Once I initially commented I clicked the -Notify me when new comments are added- checkbox and now each time a comment is added I get four emails with the same comment. Is there any method you’ll be able to remove me from that service? Thanks!
Hello, Neat post. There’s a problem along with your website in internet explorer, would test this?K IE still is the marketplace leader and a good component of people will pass over your wonderful writing because of this problem.
Hello.This article was really motivating, especially because I was searching for thoughts on this matter last Wednesday.
Watching a sunset over the ocean is one of the most peaceful experiences in life. Nature has a way of reminding us how small but connected we all are.
Watching a sunset over the ocean is one of the most peaceful experiences in life. Nature has a way of reminding us how small but connected we all are.
Very informative and good body structure of content material, now that’s user friendly (:.
Nothing beats homemade pasta. The texture and flavor are just on another level compared to store-bought versions. Cooking from scratch is truly an art.
You actually make it seem really easy together with your presentation however I in finding this matter to be actually something that I feel I would never understand. It kind of feels too complicated and extremely vast for me. I am taking a look forward in your subsequent post, I will try to get the hold of it!
Nothing beats homemade pasta. The texture and flavor are just on another level compared to store-bought versions. Cooking from scratch is truly an art.
Christopher Nolan’s storytelling is always mind-blowing. Every movie feels like a masterpiece, and the way he plays with time and perception is just genius.
Everything is very open and very clear explanation of issues. was truly information. Your website is very useful. Thanks for sharing.
I’d forever want to be update on new blog posts on this web site, saved to fav! .
I think other website owners should take this site as an model, very clean and great user friendly style and design.
Enjoyed looking at this, very good stuff, regards. “I will do my best. That is all I can do. I ask for your help-and God’s.” by Lyndon B. Johnson.
As a Newbie, I am permanently searching online for articles that can help me. Thank you
I was curious if you ever thought of changing the structure of your blog? Its very well written; I love what youve got to say. But maybe you could a little more in the way of content so people could connect with it better. Youve got an awful lot of text for only having 1 or two images. Maybe you could space it out better?
When I originally commented I clicked the “Notify me when new comments are added” checkbox and now each time a comment is added I get four emails with the same comment. Is there any way you can remove people from that service? Thanks!
Very interesting information!Perfect just what I was searching for!
Hi , I do believe this is an excellent blog. I stumbled upon it on Yahoo , i will come back once again. Money and freedom is the best way to change, may you be rich and help other people.
Hello! I’m at work browsing your blog from my new iphone! Just wanted to say I love reading through your blog and look forward to all your posts! Carry on the great work!
Have you ever considered about including a little bit more than just your articles? I mean, what you say is fundamental and everything. However just imagine if you added some great pictures or video clips to give your posts more, “pop”! Your content is excellent but with images and videos, this site could certainly be one of the best in its niche. Great blog!
I’d always want to be update on new posts on this site, bookmarked! .
You are my inhalation, I own few web logs and sometimes run out from post :). “Fiat justitia et pereat mundus.Let justice be done, though the world perish.” by Ferdinand I.
I’m now not certain the place you’re getting your info, however good topic. I needs to spend a while finding out more or understanding more. Thank you for wonderful information I was looking for this information for my mission.
I have been examinating out some of your posts and i must say clever stuff. I will make sure to bookmark your website.
Mitolyn is a cutting-edge natural dietary supplement designed to support effective weight loss and improve overall wellness.
Today, while I was at work, my sister stole my iphone and tested to see if it can survive a twenty five foot drop, just so she can be a youtube sensation. My apple ipad is now destroyed and she has 83 views. I know this is completely off topic but I had to share it with someone!
Attractive section of content. I just stumbled upon your blog and in accession capital to assert that I acquire actually enjoyed account your blog posts. Any way I’ll be subscribing to your augment and even I achievement you access consistently rapidly.
Hi there this is kind of of off topic but I was wondering if blogs use WYSIWYG editors or if you have to manually code with HTML. I’m starting a blog soon but have no coding skills so I wanted to get advice from someone with experience. Any help would be greatly appreciated!
I have been absent for a while, but now I remember why I used to love this web site. Thanks , I will try and check back more often. How frequently you update your web site?
PrimeBiome is a dietary supplement designed to support gut health by promoting a balanced microbiome, enhancing digestion, and boosting overall well-being.
PrimeBiome is a dietary supplement designed to support gut health by promoting a balanced microbiome, enhancing digestion, and boosting overall well-being.
Woh I love your articles, saved to fav! .
The Natural Mounjaro Recipe is more than just a diet—it’s a sustainable and natural approach to weight management and overall health.
Great site you have here but I was curious about if you knew of any discussion boards that cover the same topics talked about here? I’d really like to be a part of community where I can get feedback from other knowledgeable individuals that share the same interest. If you have any recommendations, please let me know. Cheers!
The Natural Mounjaro Recipe is more than just a diet—it’s a sustainable and natural approach to weight management and overall health.
I like what you guys are up also. Such intelligent work and reporting! Carry on the excellent works guys I’ve incorporated you guys to my blogroll. I think it will improve the value of my website :).
Hello there, I discovered your web site via Google at the same time as searching for a related subject, your web site got here up, it appears to be like great. I have bookmarked it in my google bookmarks.
There is apparently a bundle to realize about this. I believe you made some good points in features also.
I’ve read a few just right stuff here. Definitely value bookmarking for revisiting. I wonder how so much attempt you set to make one of these excellent informative web site.
PrimeBiome is a dietary supplement designed to support gut health by promoting a balanced microbiome, enhancing digestion, and boosting overall well-being.
PrimeBiome is a dietary supplement designed to support gut health by promoting a balanced microbiome, enhancing digestion, and boosting overall well-being.
Hello, i read your blog from time to time and i own a similar one and i was just curious if you get a lot of spam responses? If so how do you stop it, any plugin or anything you can advise? I get so much lately it’s driving me crazy so any support is very much appreciated.
What i don’t understood is in reality how you are not really a lot more neatly-liked than you might be now. You’re so intelligent. You understand thus significantly on the subject of this subject, made me in my view imagine it from numerous varied angles. Its like men and women are not interested until it?¦s something to do with Girl gaga! Your own stuffs excellent. Always maintain it up!
ProDentim is a cutting-edge oral health supplement designed to improve dental and gum health by leveraging natural probiotics and nutrientes.
Very interesting info !Perfect just what I was looking for!
The Natural Mounjaro Recipe is more than just a diet—it’s a sustainable and natural approach to weight management and overall health.
Spot on with this write-up, I actually assume this web site wants way more consideration. I’ll in all probability be again to learn rather more, thanks for that info.
I reckon something truly interesting about your blog so I saved to my bookmarks.
Exactly what I was looking for, thankyou for posting.
I and my guys were reading the good helpful tips from your website then immediately got a horrible feeling I never expressed respect to the website owner for those techniques. These young boys are already for that reason warmed to learn them and already have in fact been taking pleasure in these things. We appreciate you really being simply accommodating and then for obtaining some ideal subject areas millions of individuals are really needing to be aware of. My sincere apologies for not saying thanks to earlier.
Thanks for some other wonderful post. Where else could anyone get that kind of information in such a perfect approach of writing? I’ve a presentation next week, and I am at the look for such information.
Thanks for sharing excellent informations. Your web-site is very cool. I am impressed by the details that you’ve on this blog. It reveals how nicely you perceive this subject. Bookmarked this website page, will come back for extra articles. You, my friend, ROCK! I found simply the info I already searched everywhere and simply could not come across. What an ideal website.
I used to be more than happy to search out this internet-site.I needed to thanks for your time for this glorious learn!! I positively having fun with each little bit of it and I have you bookmarked to take a look at new stuff you weblog post.
You have brought up a very fantastic details , regards for the post.
After I initially commented I clicked the -Notify me when new feedback are added- checkbox and now each time a remark is added I get four emails with the same comment. Is there any approach you may take away me from that service? Thanks!
Heya i am for the first time here. I came across this board and I find It truly useful & it helped me out a lot. I hope to give something back and help others like you aided me.
Thanks so much for giving everyone an extraordinarily breathtaking opportunity to read articles and blog posts from this blog. It is often very brilliant and stuffed with a good time for me and my office acquaintances to search the blog at minimum thrice in 7 days to study the new issues you have got. Of course, I’m so actually fulfilled for the outstanding guidelines you serve. Some 2 points in this post are in reality the most suitable I have had.
Magnificent goods from you, man. I have remember your stuff previous to and you’re just extremely great. I really like what you have acquired here, really like what you’re saying and the best way wherein you say it. You are making it entertaining and you continue to take care of to keep it wise. I can not wait to read much more from you. This is really a tremendous web site.
Today, I went to the beachfront with my children. I found a sea shell and gave it to my 4 year old daughter and said “You can hear the ocean if you put this to your ear.” She placed the shell to her ear and screamed. There was a hermit crab inside and it pinched her ear. She never wants to go back! LoL I know this is entirely off topic but I had to tell someone!
Hello, Neat post. There’s an issue together with your website in web explorer, might check thisK IE nonetheless is the marketplace leader and a large component of other folks will miss your magnificent writing because of this problem.
I’ve been browsing online more than 3 hours as of late, but I never found any interesting article like yours. It?¦s beautiful worth sufficient for me. Personally, if all website owners and bloggers made just right content material as you did, the internet will likely be a lot more useful than ever before.
I conceive you have observed some very interesting details , thanks for the post.
Very interesting details you have mentioned, regards for putting up.
Oh my goodness! an amazing article dude. Thanks Nevertheless I’m experiencing difficulty with ur rss . Don’t know why Unable to subscribe to it. Is there anybody getting similar rss drawback? Anybody who is aware of kindly respond. Thnkx
You actually make it appear really easy along with your presentation however I find this topic to be really one thing that I feel I’d never understand. It sort of feels too complex and extremely large for me. I’m taking a look forward for your subsequent publish, I?¦ll attempt to get the grasp of it!
F*ckin’ tremendous things here. I am very glad to see your post. Thanks a lot and i am looking forward to contact you. Will you kindly drop me a mail?
Outstanding post however I was wanting to know if you could write a litte more on this topic? I’d be very grateful if you could elaborate a little bit further. Kudos!
I do agree with all of the ideas you have presented in your post. They are very convincing and will definitely work. Still, the posts are very short for starters. Could you please extend them a little from next time? Thanks for the post.
Just desire to say your article is as amazing. The clarity in your post is simply excellent and i could suppose you’re a professional on this subject. Well with your permission let me to grasp your RSS feed to keep updated with impending post. Thank you one million and please carry on the gratifying work.
Pretty nice post. I just stumbled upon your weblog and wanted to say that I’ve really enjoyed browsing your blog posts. In any case I’ll be subscribing to your feed and I hope you write again very soon!
Wow! Thank you! I permanently needed to write on my site something like that. Can I include a fragment of your post to my blog?
I have read some excellent stuff here. Certainly worth bookmarking for revisiting. I wonder how a lot effort you put to make this kind of wonderful informative website.
Have you ever considered about adding a little bit more than just your articles? I mean, what you say is fundamental and all. Nevertheless just imagine if you added some great photos or videos to give your posts more, “pop”! Your content is excellent but with pics and videos, this site could definitely be one of the best in its niche. Fantastic blog!
Virtue, they say, lies in the middle, but who among us can truly say where the middle is? Is it a fixed point, or does it shift with time, perception, and context? Perhaps the middle is not a place but a way of moving, a constant balancing act between excess and deficiency. Maybe to be virtuous is not to reach the middle but to dance around it with grace.
Time is often called the soul of motion, the great measure of change, but what if it is merely an illusion? What if we are not moving forward but simply circling the same points, like the smoke from a burning fire, curling back onto itself, repeating patterns we fail to recognize? Maybe the past and future are just two sides of the same moment, and all we ever have is now.
Heya i am for the first time here. I came across this board and I find It truly useful & it helped me out a lot. I hope to give something back and help others like you helped me.
WONDERFUL Post.thanks for share..more wait .. …
All knowledge, it is said, comes from experience, but does that not mean that the more we experience, the wiser we become? If wisdom is the understanding of life, then should we not chase every experience we can, taste every flavor, walk every path, and embrace every feeling? Perhaps the greatest tragedy is to live cautiously, never fully opening oneself to the richness of being.
Great V I should definitely pronounce, impressed with your site. I had no trouble navigating through all the tabs as well as related information ended up being truly simple to do to access. I recently found what I hoped for before you know it at all. Reasonably unusual. Is likely to appreciate it for those who add forums or anything, web site theme . a tones way for your client to communicate. Excellent task..
This web site can be a stroll-by for the entire info you wanted about this and didn’t know who to ask. Glimpse right here, and also you’ll definitely uncover it.
Just wanna admit that this is very beneficial, Thanks for taking your time to write this.
If everything in this universe has a cause, then surely the cause of my hunger must be the divine order of things aligning to guide me toward the ultimate pleasure of a well-timed meal. Could it be that desire itself is a cosmic signal, a way for nature to communicate with us, pushing us toward the fulfillment of our potential? Perhaps the true philosopher is not the one who ignores his desires, but the one who understands their deeper meaning.
The essence of existence is like smoke, always shifting, always changing, yet somehow always present. It moves with the wind of thought, expanding and contracting, never quite settling but never truly disappearing. Perhaps to exist is simply to flow, to let oneself be carried by the great current of being without resistance.
Man is said to seek happiness above all else, but what if true happiness comes only when we stop searching for it? It is like trying to catch the wind with our hands—the harder we try, the more it slips through our fingers. Perhaps happiness is not a destination but a state of allowing, of surrendering to the present and realizing that we already have everything we need.
Even the gods, if they exist, must laugh from time to time. Perhaps what we call tragedy is merely comedy from a higher perspective, a joke we are too caught up in to understand. Maybe the wisest among us are not the ones who take life the most seriously, but those who can laugh at its absurdity and find joy even in the darkest moments.
I believe you have mentioned some very interesting details , regards for the post.
You have remarked very interesting points! ps decent website . “I hate music, especially when it’s played.” by Jimmy Durante.
I really appreciate this post. I have been looking all over for this! Thank goodness I found it on Bing. You have made my day! Thank you again
Even the gods, if they exist, must laugh from time to time. Perhaps what we call tragedy is merely comedy from a higher perspective, a joke we are too caught up in to understand. Maybe the wisest among us are not the ones who take life the most seriously, but those who can laugh at its absurdity and find joy even in the darkest moments.
Thanks for another informative website. Where else could I get that type of information written in such an ideal way? I have a project that I am just now working on, and I’ve been on the look out for such information.
The cosmos is said to be an ordered place, ruled by laws and principles, yet within that order exists chaos, unpredictability, and the unexpected. Perhaps true balance is not about eliminating chaos but embracing it, learning to see the beauty in disorder, the harmony within the unpredictable. Maybe to truly understand the universe, we must stop trying to control it and simply become one with its rhythm.
Hi my family member! I wish to say that this post is awesome, nice written and come with almost all vital infos. I would like to look extra posts like this .
Hi! I’m at work browsing your blog from my new iphone 4! Just wanted to say I love reading through your blog and look forward to all your posts! Keep up the excellent work!
The cosmos is said to be an ordered place, ruled by laws and principles, yet within that order exists chaos, unpredictability, and the unexpected. Perhaps true balance is not about eliminating chaos but embracing it, learning to see the beauty in disorder, the harmony within the unpredictable. Maybe to truly understand the universe, we must stop trying to control it and simply become one with its rhythm.
Magnificent goods from you, man. I’ve understand your stuff previous to and you are just too wonderful. I actually like what you’ve acquired here, certainly like what you’re stating and the way in which you say it. You make it entertaining and you still take care of to keep it wise. I can not wait to read far more from you. This is really a wonderful site.
After study a few of the blog posts on your website now, and I truly like your way of blogging. I bookmarked it to my bookmark website list and will be checking back soon. Pls check out my web site as well and let me know what you think.
Thanks for the sensible critique. Me & my neighbor were just preparing to do some research about this. We got a grab a book from our local library but I think I learned more clear from this post. I’m very glad to see such excellent info being shared freely out there.
Heya i’m for the first time here. I came across this board and I in finding It really useful & it helped me out a lot. I’m hoping to offer one thing again and aid others such as you aided me.
My spouse and I absolutely love your blog and find the majority of your post’s to be exactly what I’m looking for. Do you offer guest writers to write content in your case? I wouldn’t mind creating a post or elaborating on some of the subjects you write about here. Again, awesome web site!
Perfect piece of work you have done, this site is really cool with wonderful information.
I adore gathering utile info, this post has got me even more info! .
O Pix My Dollar é um aplicativo de microtarefas: você realiza atividades simples no celular e acumula recompensas, que podem ser convertidas em dinheiro.
O Pix My Dollar é um aplicativo de microtarefas: você realiza atividades simples no celular e acumula recompensas, que podem ser convertidas em dinheiro.
hello there and thanks in your information – I have certainly picked up something new from proper here. I did however experience some technical issues the use of this website, since I skilled to reload the site a lot of times previous to I may just get it to load properly. I had been wondering in case your hosting is OK? Not that I’m complaining, but slow loading circumstances occasions will sometimes affect your placement in google and can injury your quality score if advertising and ***********|advertising|advertising|advertising and *********** with Adwords. Anyway I am adding this RSS to my e-mail and could look out for a lot extra of your respective interesting content. Ensure that you update this once more very soon..
Se você gosta de fazer compras online e quer pagar menos sem abrir mão da qualidade, o Cupom da Vez é a solução ideal!
Excellent web site. Plenty of helpful info here. I am sending it to some buddies ans additionally sharing in delicious. And certainly, thanks on your sweat!
I really appreciate this post. I have been looking all over for this! Thank goodness I found it on Bing. You have made my day! Thx again
O Pix My Dollar é um aplicativo de microtarefas: você realiza atividades simples no celular e acumula recompensas, que podem ser convertidas em dinheiro.
I always was interested in this topic and still am, appreciate it for posting.
O Pix My Dollar é um aplicativo de microtarefas: você realiza atividades simples no celular e acumula recompensas, que podem ser convertidas em dinheiro.
Thanks , I’ve recently been searching for information approximately this subject for ages and yours is the greatest I’ve discovered till now. However, what concerning the conclusion? Are you sure about the supply?
I likewise believe therefore, perfectly indited post! .
O Pix My Dollar é um aplicativo de microtarefas: você realiza atividades simples no celular e acumula recompensas, que podem ser convertidas em dinheiro.
The potential within all things is a mystery that fascinates me endlessly. A tiny seed already contains within it the entire blueprint of a towering tree, waiting for the right moment to emerge. Does the seed know what it will become? Do we? Or are we all simply waiting for the right conditions to awaken into what we have always been destined to be?
Hello. excellent job. I did not expect this. This is a excellent story. Thanks!
You have brought up a very excellent points, appreciate it for the post.
It’s actually a nice and helpful piece of info. I am glad that you shared this helpful info with us. Please keep us informed like this. Thanks for sharing.
Thankyou for this fantastic post, I am glad I noticed this web site on yahoo.
Wow, amazing weblog format! How long have you been blogging for? you make running a blog glance easy. The total glance of your web site is excellent, as neatly as the content!
Those are yours alright! . We at least need to get these people stealing images to start blogging! They probably just did a image search and grabbed them. They look good though!
Have you ever considered creating an ebook or guest authoring on other sites? I have a blog centered on the same information you discuss and would really like to have you share some stories/information. I know my viewers would enjoy your work. If you’re even remotely interested, feel free to shoot me an e-mail.
Attractive section of content. I just stumbled upon your site and in accession capital to assert that I acquire actually enjoyed account your blog posts. Anyway I will be subscribing to your augment and even I achievement you access consistently rapidly.
Virtue, they say, lies in the middle, but who among us can truly say where the middle is? Is it a fixed point, or does it shift with time, perception, and context? Perhaps the middle is not a place but a way of moving, a constant balancing act between excess and deficiency. Maybe to be virtuous is not to reach the middle but to dance around it with grace.
Even the gods, if they exist, must laugh from time to time. Perhaps what we call tragedy is merely comedy from a higher perspective, a joke we are too caught up in to understand. Maybe the wisest among us are not the ones who take life the most seriously, but those who can laugh at its absurdity and find joy even in the darkest moments.
Hey! Do you know if they make any plugins to assist with SEO? I’m trying to get my blog to rank for some targeted keywords but I’m not seeing very good gains. If you know of any please share. Kudos!
Terrific work! This is the type of information that should be shared around the internet. Shame on the search engines for not positioning this post higher! Come on over and visit my web site . Thanks =)
Great write-up, I’m regular visitor of one’s website, maintain up the excellent operate, and It’s going to be a regular visitor for a lengthy time.
Glad to be one of the visitors on this amazing site : D.
Hi, i believe that i noticed you visited my weblog thus i got here to “go back the choose”.I’m attempting to to find things to improve my website!I suppose its ok to use some of your concepts!!
Wow! This could be one particular of the most helpful blogs We’ve ever arrive across on this subject. Basically Excellent. I am also an expert in this topic so I can understand your effort.
I’m also writing to make you be aware of what a notable experience my cousin’s daughter obtained browsing your webblog. She realized so many details, not to mention how it is like to possess an ideal teaching mood to get folks completely understand a variety of tricky issues. You undoubtedly exceeded my expectations. Thanks for offering the precious, trusted, revealing and even unique tips about that topic to Emily.
Have you ever thought about writing an e-book or guest authoring on other sites? I have a blog based on the same information you discuss and would really like to have you share some stories/information. I know my visitors would value your work. If you are even remotely interested, feel free to shoot me an e-mail.
Greetings! I know this is kinda off topic however I’d figured I’d ask. Would you be interested in trading links or maybe guest authoring a blog article or vice-versa? My blog goes over a lot of the same subjects as yours and I feel we could greatly benefit from each other. If you are interested feel free to send me an e-mail. I look forward to hearing from you! Excellent blog by the way!
I am not real fantastic with English but I find this really leisurely to translate.
Hiya, I am really glad I have found this info. Today bloggers publish just about gossips and web and this is really irritating. A good website with interesting content, that is what I need. Thank you for keeping this web-site, I’ll be visiting it. Do you do newsletters? Cant find it.
I have been reading out some of your stories and i can claim pretty clever stuff. I will definitely bookmark your website.
Hey very nice website!! Guy .. Beautiful .. Amazing .. I’ll bookmark your web site and take the feeds alsoKI am happy to search out so many helpful info here within the post, we need develop more techniques on this regard, thanks for sharing. . . . . .
Just a smiling visitant here to share the love (:, btw great style.
What’s Going down i am new to this, I stumbled upon this I have found It positively helpful and it has helped me out loads. I hope to contribute & help other users like its helped me. Great job.
Hey very cool blog!! Guy .. Excellent .. Wonderful .. I will bookmark your site and take the feeds also…I’m happy to seek out a lot of useful info right here within the post, we want work out extra techniques in this regard, thank you for sharing. . . . . .
Very interesting subject, thanks for posting. “What passes for optimism is most often the effect of an intellectual error.” by Raymond Claud Ferdinan Aron.
Excellent read, I just passed this onto a friend who was doing some research on that. And he just bought me lunch because I found it for him smile Thus let me rephrase that: Thank you for lunch!
Good website! I truly love how it is simple on my eyes and the data are well written. I am wondering how I might be notified whenever a new post has been made. I have subscribed to your RSS which must do the trick! Have a nice day!
Can I just say what a relief to find someone who actually knows what theyre talking about on the internet. You definitely know how to bring an issue to light and make it important. More people need to read this and understand this side of the story. I cant believe youre not more popular because you definitely have the gift.
I haven’t checked in here for some time as I thought it was getting boring, but the last several posts are great quality so I guess I’ll add you back to my everyday bloglist. You deserve it my friend 🙂
Valuable information. Lucky me I found your site by accident, and I am shocked why this accident did not happened earlier! I bookmarked it.
Perfect piece of work you have done, this site is really cool with wonderful information.
My spouse and i felt so satisfied when Raymond could deal with his analysis through the entire precious recommendations he had from your web page. It’s not at all simplistic just to be giving out concepts most people may have been trying to sell. And we all acknowledge we have the website owner to be grateful to because of that. The main explanations you have made, the simple web site menu, the relationships you can make it easier to engender – it’s got many great, and it is leading our son and the family consider that that concept is exciting, and that is tremendously fundamental. Thank you for everything!
Hello there, I found your blog via Google while searching for a related topic, your web site came up, it looks good. I have bookmarked it in my google bookmarks.
Wow, incredible weblog structure! How lengthy have you ever been running a blog for? you made running a blog glance easy. The overall look of your website is great, let alone the content material!
I have been reading out many of your posts and i can state pretty clever stuff. I will surely bookmark your site.
Thank you for sharing excellent informations. Your web site is very cool. I am impressed by the details that you’ve on this web site. It reveals how nicely you understand this subject. Bookmarked this website page, will come back for more articles. You, my pal, ROCK! I found simply the info I already searched all over the place and just could not come across. What a great web-site.
An interesting discussion is worth comment. I feel that you must write extra on this subject, it may not be a taboo subject but usually persons are not enough to talk on such topics. To the next. Cheers
I like this site so much, bookmarked. “I don’t care what is written about me so long as it isn’t true.” by Dorothy Parker.
Very interesting details you have observed, appreciate it for putting up.
The following time I learn a blog, I hope that it doesnt disappoint me as a lot as this one. I imply, I know it was my option to learn, however I truly thought youd have one thing attention-grabbing to say. All I hear is a bunch of whining about one thing that you could possibly fix for those who werent too busy looking for attention.
Hello there, You have done an incredible job. I’ll definitely digg it and personally suggest to my friends. I’m sure they’ll be benefited from this website.
Some genuinely interesting information, well written and broadly speaking user pleasant.
Great post. I am facing a couple of these problems.
Some genuinely nice and utilitarian information on this website , also I think the style and design contains great features.
I like this site so much, saved to fav.
Time is often called the soul of motion, the great measure of change, but what if it is merely an illusion? What if we are not moving forward but simply circling the same points, like the smoke from a burning fire, curling back onto itself, repeating patterns we fail to recognize? Maybe the past and future are just two sides of the same moment, and all we ever have is now.
Hi there! Quick question that’s totally off topic. Do you know how to make your site mobile friendly? My weblog looks weird when viewing from my iphone 4. I’m trying to find a template or plugin that might be able to fix this problem. If you have any recommendations, please share. With thanks!
I loved as much as you will receive carried out right here. The sketch is tasteful, your authored subject matter stylish. nonetheless, you command get got an nervousness over that you wish be delivering the following. unwell unquestionably come more formerly again as exactly the same nearly very often inside case you shield this increase.
Great – I should definitely pronounce, impressed with your web site. I had no trouble navigating through all tabs as well as related information ended up being truly simple to do to access. I recently found what I hoped for before you know it in the least. Reasonably unusual. Is likely to appreciate it for those who add forums or something, web site theme . a tones way for your client to communicate. Nice task.
I like the helpful information you provide in your articles. I will bookmark your weblog and check again here frequently. I am quite certain I will learn many new stuff right here! Good luck for the next!
Write more, thats all I have to say. Literally, it seems as though you relied on the video to make your point. You obviously know what youre talking about, why throw away your intelligence on just posting videos to your blog when you could be giving us something enlightening to read?
I truly appreciate this post. I’ve been looking everywhere for this! Thank goodness I found it on Bing. You have made my day! Thanks again!
I got what you mean , regards for posting.Woh I am thankful to find this website through google.
Usually I do not read article on blogs, but I wish to say that this write-up very forced me to try and do it! Your writing style has been surprised me. Thanks, quite nice post.
As a Newbie, I am constantly exploring online for articles that can be of assistance to me. Thank you
It’s appropriate time to make some plans for the future and it’s time to be happy. I have read this post and if I could I desire to suggest you some interesting things or advice. Maybe you can write next articles referring to this article. I want to read more things about it!
Fantastic site. A lot of useful information here. I am sending it to a few friends ans also sharing in delicious. And of course, thanks to your effort!
Wohh just what I was searching for, regards for putting up.
Magnificent beat ! I wish to apprentice while you amend your web site, how can i subscribe for a blog website? The account aided me a acceptable deal. I had been tiny bit acquainted of this your broadcast provided bright clear idea
This blog is definitely rather handy since I’m at the moment creating an internet floral website – although I am only starting out therefore it’s really fairly small, nothing like this site. Can link to a few of the posts here as they are quite. Thanks much. Zoey Olsen
Please let me know if you’re looking for a author for your site. You have some really great articles and I think I would be a good asset. If you ever want to take some of the load off, I’d really like to write some articles for your blog in exchange for a link back to mine. Please send me an e-mail if interested. Many thanks!
I really like your blog.. very nice colors & theme. Did you design this website yourself or did you hire someone to do it for you? Plz answer back as I’m looking to construct my own blog and would like to find out where u got this from. appreciate it
Enjoyed studying this, very good stuff, thanks. “It is in justice that the ordering of society is centered.” by Aristotle.
Rattling wonderful info can be found on weblog.
I just could not go away your website prior to suggesting that I extremely enjoyed the standard information an individual supply in your visitors? Is gonna be back frequently in order to check out new posts
Those are yours alright! . We at least need to get these people stealing images to start blogging! They probably just did a image search and grabbed them. They look good though!
Hello, i think that i saw you visited my site so i got here to “go back the want”.I’m trying to to find issues to improve my web site!I suppose its good enough to make use of some of your ideas!!
Keep working ,terrific job!
Howdy! Quick question that’s totally off topic. Do you know how to make your site mobile friendly? My weblog looks weird when viewing from my apple iphone. I’m trying to find a template or plugin that might be able to correct this problem. If you have any suggestions, please share. Appreciate it!
whoah this blog is wonderful i really like reading your articles. Stay up the good work! You understand, a lot of people are hunting around for this information, you could help them greatly.
I admire your work, regards for all the great articles.
The Natural Mounjaro Recipe is more than just a diet—it’s a sustainable and natural approach to weight management and overall health.
Admiring the time and effort you put into your website and in depth information you offer. It’s awesome to come across a blog every once in a while that isn’t the same out of date rehashed information. Great read! I’ve bookmarked your site and I’m including your RSS feeds to my Google account.
The Natural Mounjaro Recipe is more than just a diet—it’s a sustainable and natural approach to weight management and overall health.
Mitolyn is a cutting-edge natural dietary supplement designed to support effective weight loss and improve overall wellness.
Thank you for the sensible critique. Me & my neighbor were just preparing to do a little research about this. We got a grab a book from our local library but I think I learned more clear from this post. I’m very glad to see such great info being shared freely out there.
PrimeBiome is a dietary supplement designed to support gut health by promoting a balanced microbiome, enhancing digestion, and boosting overall well-being.
I got good info from your blog
ProDentim is a chewable oral probiotic supplement formulated with a unique mix of probiotics, prebiotics, herbs, and nutrients.
Perfect work you have done, this website is really cool with good information.
very good submit, i definitely love this website, keep on it
This really answered my problem, thank you!
wonderful post, very informative. I ponder why the opposite experts of this sector don’t understand this. You must continue your writing. I am confident, you’ve a great readers’ base already!
Unquestionably believe that which you stated. Your favorite justification seemed to be on the internet the simplest thing to be aware of. I say to you, I certainly get irked while people think about worries that they plainly don’t know about. You managed to hit the nail upon the top and defined out the whole thing without having side effect , people could take a signal. Will probably be back to get more. Thanks
I love foregathering utile info, this post has got me even more info! .
Pretty nice post. I just stumbled upon your blog and wanted to say that I have truly enjoyed browsing your blog posts. After all I will be subscribing to your feed and I hope you write again soon!
With havin so much content do you ever run into any issues of plagorism or copyright violation? My site has a lot of completely unique content I’ve either written myself or outsourced but it appears a lot of it is popping it up all over the web without my agreement. Do you know any ways to help stop content from being stolen? I’d genuinely appreciate it.
Thanks for another magnificent post. Where else could anybody get that type of info in such an ideal way of writing? I have a presentation next week, and I am on the look for such information.
You got a very wonderful website, Gladiola I discovered it through yahoo.
I am impressed with this site, very I am a fan.
Would love to incessantly get updated great web blog! .
Can I just say what a relief to find someone who actually knows what theyre talking about on the internet. You definitely know how to bring an issue to light and make it important. More people need to read this and understand this side of the story. I cant believe youre not more popular because you definitely have the gift.
I love your blog.. very nice colors & theme. Did you create this website yourself? Plz reply back as I’m looking to create my own blog and would like to know wheere u got this from. thanks
you have a great blog here! would you like to make some invite posts on my blog?
It is appropriate time to make some plans for the future and it is time to be happy. I’ve learn this put up and if I could I wish to recommend you few attention-grabbing things or advice. Maybe you can write subsequent articles referring to this article. I want to read more things about it!
Compre visualizações e espectadores reais para suas lives no YouTube, Instagram, Twitch, TikTok e Facebook. Aumente seu engajamento e credibilidade online com serviços seguros e confiáveis. Impulsione suas transmissões ao vivo hoje!
I have been browsing online more than 3 hours nowadays, but I by no means discovered any interesting article like yours. It’s beautiful price enough for me. Personally, if all website owners and bloggers made just right content material as you probably did, the net can be a lot more useful than ever before.
I would like to thnkx for the efforts you have put in writing this blog. I am hoping the same high-grade blog post from you in the upcoming as well. In fact your creative writing abilities has inspired me to get my own blog now. Really the blogging is spreading its wings quickly. Your write up is a good example of it.
You have mentioned very interesting details! ps nice internet site.
Thank you for the auspicious writeup. It if truth be told was a amusement account it. Look complicated to more delivered agreeable from you! By the way, how could we be in contact?
When I originally commented I clicked the -Notify me when new feedback are added- checkbox and now each time a remark is added I get 4 emails with the identical comment. Is there any means you can remove me from that service? Thanks!
I was looking through some of your content on this site and I believe this website is very instructive! Keep putting up.
I have been absent for a while, but now I remember why I used to love this site. Thanks , I will try and check back more often. How frequently you update your site?
Very interesting points you have observed, thankyou for posting. “The biggest fool may come out with a bit of sense when you least expect it.” by Eden Phillpotts.
Greetings! Very helpful advice on this article! It is the little changes that make the biggest changes. Thanks a lot for sharing!
This web site is really a walk-through for all of the info you wanted about this and didn’t know who to ask. Glimpse here, and you’ll definitely discover it.
My spouse and I absolutely love your blog and find the majority of your post’s to be just what I’m looking for. Would you offer guest writers to write content for you personally? I wouldn’t mind composing a post or elaborating on most of the subjects you write about here. Again, awesome weblog!
Very interesting information!Perfect just what I was searching for!
very nice publish, i certainly love this website, keep on it
hi!,I like your writing so much! share we communicate more about your article on AOL? I need a specialist on this area to solve my problem. Maybe that’s you! Looking forward to see you.
A large percentage of of what you assert happens to be astonishingly appropriate and it makes me ponder why I hadn’t looked at this in this light previously. Your piece truly did turn the light on for me personally as far as this particular topic goes. Nevertheless at this time there is actually one particular position I am not really too comfy with so while I make an effort to reconcile that with the central theme of your position, let me see what all the rest of the readers have to point out.Well done.
Thanx for the effort, keep up the good work Great work, I am going to start a small Blog Engine course work using your site I hope you enjoy blogging with the popular BlogEngine.net.Thethoughts you express are really awesome. Hope you will right some more posts.
The Salt Trick is a natural technique that involves using specific salts, such as Blue Salt, to enhance male performance
Merely a smiling visitant here to share the love (:, btw outstanding design and style.
Wonderful blog! I found it while surfing around on Yahoo News. Do you have any suggestions on how to get listed in Yahoo News? I’ve been trying for a while but I never seem to get there! Many thanks
Hello there! I know this is somewhat off topic but I was wondering if you knew where I could get a captcha plugin for my comment form? I’m using the same blog platform as yours and I’m having difficulty finding one? Thanks a lot!
ProDentim is a chewable oral probiotic supplement formulated with a unique mix of probiotics, prebiotics, herbs, and nutrients.
The Ice Water Hack has been gaining popularity as a simple method to aid weight loss. After reading about its potential benefits, I decided to give it a shot and see how it worked for me. Here’s what I found!
Mitolyn is a cutting-edge natural dietary supplement designed to support effective weight loss and improve overall wellness.
Great beat ! I wish to apprentice even as you amend your web site, how could i subscribe for a blog web site? The account helped me a applicable deal. I had been tiny bit familiar of this your broadcast offered shiny clear concept
Mitolyn is a cutting-edge natural dietary supplement designed to support effective weight loss and improve overall wellness.
I love looking at and I believe this website got some genuinely utilitarian stuff on it! .
Woah! I’m really loving the template/theme of this site. It’s simple, yet effective. A lot of times it’s hard to get that “perfect balance” between superb usability and visual appeal. I must say you’ve done a superb job with this. Also, the blog loads very quick for me on Firefox. Superb Blog!
Excellent read, I just passed this onto a friend who was doing some research on that. And he just bought me lunch since I found it for him smile So let me rephrase that: Thanks for lunch! “There are places and moments in which one is so completely alone that one sees the world entire.” by Jules Renard.
Quietum Plus uses a powerful blend of herbs, vitamins, and minerals to target the root causes of hearing problems — improving blood circulation, reducing inflammation, and strengthening the tiny nerves in your ears.
Today, while I was at work, my cousin stole my iphone and tested to see if it can survive a 30 foot drop, just so she can be a youtube sensation. My iPad is now destroyed and she has 83 views. I know this is entirely off topic but I had to share it with someone!
Somebody essentially help to make seriously posts I would state. This is the very first time I frequented your website page and thus far? I surprised with the research you made to create this particular publish amazing. Great job!
you will have an excellent blog here! would you wish to make some invite posts on my weblog?
As a Newbie, I am continuously searching online for articles that can be of assistance to me. Thank you
Hey, I think your site might be having browser compatibility issues. When I look at your website in Firefox, it looks fine but when opening in Internet Explorer, it has some overlapping. I just wanted to give you a quick heads up! Other then that, great blog!
I?¦ve been exploring for a little bit for any high-quality articles or blog posts on this kind of space . Exploring in Yahoo I eventually stumbled upon this web site. Reading this info So i am glad to exhibit that I have a very excellent uncanny feeling I found out just what I needed. I most no doubt will make certain to don?¦t overlook this site and provides it a glance regularly.
Hello! I just would like to give a huge thumbs up for the great info you have here on this post. I will be coming back to your blog for more soon.
fantastic post.Ne’er knew this, thanks for letting me know.
Nice post. I learn something more challenging on different blogs everyday. It will always be stimulating to read content from other writers and practice a little something from their store. I’d prefer to use some with the content on my blog whether you don’t mind. Natually I’ll give you a link on your web blog. Thanks for sharing.
certainly like your website however you have to take a look at the spelling on several of your posts. Many of them are rife with spelling problems and I in finding it very bothersome to inform the truth on the other hand I’ll surely come again again.
Lift detox funciona
Hello there, I found your blog via Google while looking for a related topic, your website came up, it looks great. I’ve bookmarked it in my google bookmarks.
You could definitely see your enthusiasm in the work you write. The world hopes for even more passionate writers like you who are not afraid to say how they believe. Always follow your heart.
I got good info from your blog
Would love to forever get updated great website! .
This is the right blog for anyone who wants to find out about this topic. You realize so much its almost hard to argue with you (not that I actually would want…HaHa). You definitely put a new spin on a topic thats been written about for years. Great stuff, just great!
Very nice post. I just stumbled upon your weblog and wanted to say that I’ve truly enjoyed browsing your blog posts. After all I will be subscribing to your rss feed and I hope you write again soon!
Good web site! I really love how it is easy on my eyes and the data are well written. I am wondering how I could be notified whenever a new post has been made. I’ve subscribed to your feed which must do the trick! Have a nice day!
I very delighted to find this internet site on bing, just what I was searching for : D as well saved to my bookmarks.
Some really great info , Glad I detected this.
This blog is definitely rather handy since I’m at the moment creating an internet floral website – although I am only starting out therefore it’s really fairly small, nothing like this site. Can link to a few of the posts here as they are quite. Thanks much. Zoey Olsen
Hi, Neat post. There’s an issue with your web site in internet explorer, might test this?K IE nonetheless is the marketplace chief and a good component to folks will miss your magnificent writing due to this problem.
I am continuously browsing online for posts that can benefit me. Thanks!
I like this web site because so much useful stuff on here : D.
Thanks for the good writeup. It in fact was once a entertainment account it. Look complex to far introduced agreeable from you! However, how could we be in contact?
I will immediately take hold of your rss feed as I can’t in finding your email subscription link or e-newsletter service. Do you’ve any? Please let me realize so that I may subscribe. Thanks.
Thanks for all your work on this web page. Kate takes pleasure in carrying out research and it’s easy to understand why. All of us learn all relating to the dynamic mode you convey valuable guidance by means of your blog and as well as inspire participation from the others on that issue so my girl is in fact understanding a lot. Take pleasure in the rest of the year. Your doing a powerful job.
Just wanna remark that you have a very nice site, I enjoy the design it really stands out.
Awsome info and right to the point. I don’t know if this is truly the best place to ask but do you guys have any ideea where to employ some professional writers? Thanks 🙂
Hi there, You have done a great job. I will definitely digg it and personally recommend to my friends. I’m confident they will be benefited from this site.
I couldn’t resist commenting
I have recently started a website, the information you provide on this web site has helped me tremendously. Thank you for all of your time & work.
I will right away take hold of your rss feed as I can not find your e-mail subscription link or e-newsletter service. Do you’ve any? Please permit me realize in order that I could subscribe. Thanks.
I am glad to be a visitant of this double dyed weblog! , thankyou for this rare info ! .
Valuable info. Fortunate me I found your web site by accident, and I am surprised why this accident did not came about in advance! I bookmarked it.
I found your blog web site on google and test just a few of your early posts. Continue to maintain up the very good operate. I just extra up your RSS feed to my MSN Information Reader. Searching for ahead to studying more from you in a while!…
Howdy! This is my first comment here so I just wanted to give a quick shout out and tell you I really enjoy reading your articles. Can you suggest any other blogs/websites/forums that go over the same subjects? Thanks for your time!
You made some respectable factors there. I looked on the internet for the issue and located most people will associate with along with your website.
I was just looking for this info for a while. After six hours of continuous Googleing, at last I got it in your site. I wonder what is the lack of Google strategy that don’t rank this type of informative websites in top of the list. Normally the top sites are full of garbage.
I cherished as much as you will receive performed right here. The comic strip is tasteful, your authored material stylish. however, you command get got an edginess over that you want be delivering the following. in poor health indubitably come further until now once more since exactly the same nearly a lot ceaselessly inside of case you shield this hike.
That is the correct weblog for anybody who desires to find out about this topic. You realize a lot its nearly arduous to argue with you (not that I actually would want…HaHa). You undoubtedly put a new spin on a subject thats been written about for years. Great stuff, just great!
I like this website very much so much great info .
Some truly fantastic information, Glad I noticed this.
Utterly pent subject matter, thank you for selective information. “No human thing is of serious importance.” by Plato.
great points altogether, you just won a new reader. What might you recommend about your put up that you made some days in the past? Any sure?
Mitolyn is a cutting-edge natural dietary supplement designed to support effective weight loss and improve overall wellness.
Good info. Lucky me I reach on your website by accident, I bookmarked it.
I have been surfing online greater than 3 hours nowadays, yet I never discovered any interesting article like yours. It is beautiful value sufficient for me. In my view, if all webmasters and bloggers made just right content material as you probably did, the net can be a lot more helpful than ever before.
The Natural Mounjaro Recipe is more than just a diet—it’s a sustainable and natural approach to weight management and overall health.
The Natural Mounjaro Recipe is more than just a diet—it’s a sustainable and natural approach to weight management and overall health.
The Natural Mounjaro Recipe is more than just a diet—it’s a sustainable and natural approach to weight management and overall health.
It’s actually a cool and helpful piece of info. I’m glad that you shared this useful information with us. Please keep us up to date like this. Thanks for sharing.
Loving the information on this website , you have done great job on the articles.
Normally I don’t read post on blogs, however I wish to say that this write-up very forced me to check out and do it! Your writing style has been amazed me. Thanks, quite great article.
Hi, Neat post. There is a problem together with your website in internet explorer, could check thisK IE nonetheless is the marketplace leader and a big component to folks will omit your wonderful writing due to this problem.
I’ve read some good stuff here. Definitely value bookmarking for revisiting. I wonder how much attempt you place to create any such fantastic informative site.
Thank you for sharing with us, I conceive this website truly stands out : D.
Great V I should certainly pronounce, impressed with your web site. I had no trouble navigating through all the tabs and related information ended up being truly simple to do to access. I recently found what I hoped for before you know it in the least. Reasonably unusual. Is likely to appreciate it for those who add forums or something, web site theme . a tones way for your client to communicate. Excellent task..
whoah this blog is magnificent i love reading your posts. Keep up the good work! You know, many people are hunting around for this info, you could aid them greatly.
Great wordpress blog here.. It’s hard to find quality writing like yours these days. I really appreciate people like you! take care
I just could not depart your web site prior to suggesting that I really enjoyed the standard information a person provide for your visitors? Is gonna be back often in order to check up on new posts
Thank you for the sensible critique. Me and my neighbor were just preparing to do a little research on this. We got a grab a book from our local library but I think I learned more clear from this post. I’m very glad to see such magnificent info being shared freely out there.
hello there and thank you for your info – I have certainly picked up something new from right here. I did however expertise some technical issues using this site, as I experienced to reload the website lots of times previous to I could get it to load properly. I had been wondering if your hosting is OK? Not that I’m complaining, but sluggish loading instances times will often affect your placement in google and can damage your quality score if advertising and marketing with Adwords. Well I am adding this RSS to my email and could look out for a lot more of your respective interesting content. Make sure you update this again very soon..
fantastic post.Never knew this, appreciate it for letting me know.
Greetings! I know this is kinda off topic but I’d figured I’d ask. Would you be interested in trading links or maybe guest authoring a blog post or vice-versa? My site goes over a lot of the same topics as yours and I believe we could greatly benefit from each other. If you’re interested feel free to shoot me an email. I look forward to hearing from you! Awesome blog by the way!
I enjoy the efforts you have put in this, regards for all the great posts.
Purdentix
I’ve been exploring for a little bit for any high quality articles or weblog posts in this kind of house . Exploring in Yahoo I ultimately stumbled upon this web site. Reading this information So i am happy to show that I have an incredibly excellent uncanny feeling I discovered exactly what I needed. I so much undoubtedly will make certain to do not forget this website and give it a look regularly.
Thanks for one’s marvelous posting! I definitely enjoyed reading it, you happen to be a great author.I will make sure to bookmark your blog and will eventually come back later in life. I want to encourage you to definitely continue your great writing, have a nice evening!
Simply wanna remark on few general things, The website design and style is perfect, the subject material is really superb : D.
Simply desire to say your article is as amazing. The clearness in your post is just excellent and i can assume you are an expert on this subject. Fine with your permission allow me to grab your RSS feed to keep up to date with forthcoming post. Thanks a million and please continue the rewarding work.
Hi there! I’m at work browsing your blog from my new apple iphone! Just wanted to say I love reading through your blog and look forward to all your posts! Keep up the excellent work!
I have recently started a website, the info you provide on this web site has helped me greatly. Thanks for all of your time & work.
I’m just writing to let you know of the really good experience our daughter went through using the blog. She learned a wide variety of things, not to mention how it is like to have an excellent teaching nature to let other folks without problems have an understanding of specified grueling matters. You undoubtedly surpassed her expectations. Thank you for churning out such useful, trusted, educational and even cool guidance on this topic to Lizeth.
Greetings! Very helpful advice on this article! It is the little changes that make the biggest changes. Thanks a lot for sharing!
You made some decent points there. I seemed on the web for the issue and found most people will go along with together with your website.
There is noticeably a bundle to know about this. I assume you made certain nice points in features also.
Hello.This post was really motivating, particularly since I was investigating for thoughts on this matter last Friday.
You have brought up a very great details, thanks for the post.
Hello very nice web site!! Man .. Excellent .. Superb .. I’ll bookmark your web site and take the feeds additionally?KI am satisfied to search out a lot of useful information right here in the put up, we need work out extra strategies in this regard, thank you for sharing. . . . . .
I regard something really special in this site.
You have remarked very interesting points! ps nice internet site.
I really appreciate this post. I have been looking everywhere for this! Thank goodness I found it on Bing. You’ve made my day! Thanks again
I envy your work, regards for all the great articles.
I believe you have noted some very interesting details , thanks for the post.
whoah this blog is excellent i love reading your articles. Keep up the good work! You know, a lot of people are hunting around for this information, you could aid them greatly.
Very nice post and right to the point. I don’t know if this is in fact the best place to ask but do you people have any thoughts on where to employ some professional writers? Thank you 🙂
Good info. Lucky me I reach on your website by accident, I bookmarked it.
I wish to show appreciation to this writer for rescuing me from this particular circumstance. Because of exploring through the the net and meeting principles which were not powerful, I thought my life was gone. Living minus the approaches to the issues you have resolved by way of your report is a critical case, as well as those which might have in a negative way damaged my entire career if I hadn’t come across your web site. The training and kindness in dealing with all the details was vital. I’m not sure what I would have done if I had not discovered such a solution like this. I’m able to now look forward to my future. Thanks for your time very much for the professional and sensible help. I won’t think twice to suggest your web sites to anybody who ought to have guide about this matter.
It’s perfect time to make a few plans for the longer term and it is time to be happy. I have learn this post and if I may just I want to counsel you few interesting issues or suggestions. Perhaps you can write subsequent articles regarding this article. I want to read even more issues approximately it!
I am continuously browsing online for tips that can facilitate me. Thanks!
Greetings from Carolina! I’m bored to death at work so I decided to browse your blog on my iphone during lunch break. I enjoy the information you present here and can’t wait to take a look when I get home. I’m shocked at how fast your blog loaded on my cell phone .. I’m not even using WIFI, just 3G .. Anyhow, good blog!
You really make it appear really easy together with your presentation but I to find this topic to be actually something which I think I’d by no means understand. It kind of feels too complex and very large for me. I’m looking forward to your next put up, I will try to get the hang of it!
I know this if off topic but I’m looking into starting my own blog and was wondering what all is needed to get set up? I’m assuming having a blog like yours would cost a pretty penny? I’m not very internet smart so I’m not 100 sure. Any tips or advice would be greatly appreciated. Appreciate it
I like what you guys are up too. Such smart work and reporting! Carry on the excellent works guys I¦ve incorporated you guys to my blogroll. I think it’ll improve the value of my website 🙂
I am continuously looking online for tips that can benefit me. Thanks!
I am lucky that I observed this web blog, precisely the right info that I was looking for! .
I wanted to thank you for this great read!! I definitely enjoying every little bit of it I have you bookmarked to check out new stuff you post…
Very interesting topic, appreciate it for posting.
Hey very cool blog!! Man .. Beautiful .. Superb .. I’ll bookmark your web site and take the feeds also…I’m satisfied to search out numerous useful info right here in the put up, we want develop more techniques on this regard, thanks for sharing.
Purdentix review
Thanks a lot for sharing this with all of us you really recognise what you’re talking about! Bookmarked. Please also visit my web site =). We could have a hyperlink change contract among us!
Terrific post however I was wanting to know if you could write a litte more on this subject? I’d be very grateful if you could elaborate a little bit further. Thanks!
certainly like your website however you need to take a look at the spelling on several of your posts. A number of them are rife with spelling problems and I to find it very bothersome to inform the reality however I will certainly come again again.
Lovely just what I was searching for.Thanks to the author for taking his clock time on this one.
I have been browsing on-line more than three hours nowadays, but I never discovered any attention-grabbing article like yours. It is pretty price enough for me. In my opinion, if all website owners and bloggers made good content material as you did, the internet will probably be much more useful than ever before.
Hey, you used to write excellent, but the last several posts have been kinda boring?K I miss your great writings. Past several posts are just a little bit out of track! come on!
I am lucky that I noticed this site, exactly the right info that I was looking for! .
Very efficiently written post. It will be supportive to anyone who usess it, including myself. Keep up the good work – i will definitely read more posts.
I’m really enjoying the design and layout of your site. It’s a very easy on the eyes which makes it much more pleasant for me to come here and visit more often. Did you hire out a developer to create your theme? Exceptional work!
I’d have to examine with you here. Which is not one thing I usually do! I take pleasure in reading a post that may make folks think. Additionally, thanks for permitting me to comment!
It’s actually a great and helpful piece of info. I am satisfied that you shared this helpful information with us. Please keep us informed like this. Thanks for sharing.
Great wordpress blog here.. It’s hard to find quality writing like yours these days. I really appreciate people like you! take care
I love it when people come together and share opinions, great blog, keep it up.
It’s really a nice and useful piece of information. I’m glad that you shared this helpful information with us. Please keep us up to date like this. Thanks for sharing.
I am not very good with English but I get hold this real leisurely to interpret.
Pretty nice post. I just stumbled upon your blog and wanted to say that I have truly enjoyed surfing around your blog posts. After all I’ll be subscribing to your rss feed and I hope you write again soon!
Some genuinely wonderful information, Sword lily I detected this.
You really make it seem so easy with your presentation but I find this matter to be actually something that I think I would never understand. It seems too complicated and extremely broad for me. I’m looking forward for your next post, I will try to get the hang of it!
I beloved as much as you will receive carried out proper here. The caricature is tasteful, your authored material stylish. nevertheless, you command get bought an nervousness over that you wish be turning in the following. ill indisputably come further before again since precisely the same nearly a lot often inside case you protect this increase.
obviously like your website however you need to check the spelling on quite a few of your posts. Many of them are rife with spelling issues and I in finding it very troublesome to inform the truth however I will definitely come again again.
Very well written article. It will be supportive to anyone who employess it, as well as yours truly :). Keep doing what you are doing – can’r wait to read more posts.
I savor, result in I discovered just what I was having a look for. You have ended my four day lengthy hunt! God Bless you man. Have a great day. Bye
Can I just say what a aid to find somebody who actually is aware of what theyre speaking about on the internet. You undoubtedly know how to carry a difficulty to mild and make it important. Extra people must learn this and understand this side of the story. I cant imagine youre not more in style since you undoubtedly have the gift.
I was wondering if you ever thought of changing the page layout of your site? Its very well written; I love what youve got to say. But maybe you could a little more in the way of content so people could connect with it better. Youve got an awful lot of text for only having one or two pictures. Maybe you could space it out better?
It’s actually a great and useful piece of info. I am happy that you shared this helpful info with us. Please stay us informed like this. Thank you for sharing.
I like this website so much, saved to my bookmarks.
Hello just wanted to give you a quick heads up. The text in your content seem to be running off the screen in Chrome. I’m not sure if this is a format issue or something to do with internet browser compatibility but I figured I’d post to let you know. The layout look great though! Hope you get the issue fixed soon. Cheers
I real happy to find this site on bing, just what I was searching for : D also bookmarked.
I wanted to draft you a tiny word to give thanks again about the marvelous information you have shown at this time. It has been quite unbelievably open-handed of you to make publicly what many people would have offered for sale for an electronic book to generate some dough for themselves, chiefly considering the fact that you could possibly have done it if you ever desired. The solutions additionally acted to be a good way to understand that other individuals have similar keenness much like my personal own to know the truth significantly more with respect to this issue. I know there are lots of more fun occasions up front for people who looked at your blog post.
Nice post. I learn something more challenging on different blogs everyday. It will always be stimulating to read content from other writers and practice a little something from their store. I’d prefer to use some with the content on my blog whether you don’t mind. Natually I’ll give you a link on your web blog. Thanks for sharing.
Great post and straight to the point. I don’t know if this is actually the best place to ask but do you folks have any thoughts on where to employ some professional writers? Thanks 🙂
What’s Happening i’m new to this, I stumbled upon this I have found It absolutely helpful and it has aided me out loads. I hope to contribute & help other users like its helped me. Great job.
Pretty nice post. I just stumbled upon your weblog and wished to say that I’ve truly enjoyed surfing around your blog posts. In any case I will be subscribing to your feed and I hope you write again very soon!
I believe this website contains some real excellent info for everyone : D.
I know this if off topic but I’m looking into starting my own blog and was wondering what all is needed to get setup? I’m assuming having a blog like yours would cost a pretty penny? I’m not very web savvy so I’m not 100 sure. Any tips or advice would be greatly appreciated. Many thanks
I’ve recently started a web site, the information you offer on this web site has helped me greatly. Thank you for all of your time & work.
I don’t even know how I ended up here, but I thought this post was good. I do not know who you are but certainly you are going to a famous blogger if you aren’t already 😉 Cheers!
I carry on listening to the rumor lecture about getting free online grant applications so I have been looking around for the most excellent site to get one. Could you advise me please, where could i find some?
I want studying and I think this website got some really utilitarian stuff on it! .
Thanks for one’s marvelous posting! I definitely enjoyed reading it, you could be a great author.I will be sure to bookmark your blog and will often come back from now on. I want to encourage you to ultimately continue your great work, have a nice weekend!
I’ve been exploring for a bit for any high-quality articles or weblog posts in this kind of house . Exploring in Yahoo I ultimately stumbled upon this website. Reading this info So i am happy to convey that I’ve an incredibly excellent uncanny feeling I found out exactly what I needed. I most definitely will make certain to don’t fail to remember this web site and give it a look regularly.
excellent post, very informative. I wonder why the other experts of this sector do not notice this. You must continue your writing. I am confident, you have a huge readers’ base already!
Woh I love your articles, saved to bookmarks! .
I want looking at and I conceive this website got some genuinely useful stuff on it! .
F*ckin¦ awesome things here. I am very satisfied to peer your article. Thanks a lot and i am taking a look forward to contact you. Will you please drop me a mail?
I view something really interesting about your website so I bookmarked.
Hi my friend! I wish to say that this article is amazing, nice written and include almost all important infos. I would like to see more posts like this.
Thanx for the effort, keep up the good work Great work, I am going to start a small Blog Engine course work using your site I hope you enjoy blogging with the popular BlogEngine.net.Thethoughts you express are really awesome. Hope you will right some more posts.
After examine a number of of the blog posts in your web site now, and I actually like your way of blogging. I bookmarked it to my bookmark website checklist and will probably be checking back soon. Pls try my web site as nicely and let me know what you think.
Does your site have a contact page? I’m having trouble locating it but, I’d like to send you an e-mail. I’ve got some suggestions for your blog you might be interested in hearing. Either way, great site and I look forward to seeing it expand over time.
Mitolyn is a cutting-edge natural dietary supplement designed to support effective weight loss and improve overall wellness.
The Natural Mounjaro Recipe is more than just a diet—it’s a sustainable and natural approach to weight management and overall health.
Wow that was strange. I just wrote an really long comment but after I clicked submit my comment didn’t appear. Grrrr… well I’m not writing all that over again. Anyhow, just wanted to say great blog!
Hi my loved one! I want to say that this article is amazing, nice written and come with almost all important infos. I would like to peer extra posts like this .
You made some nice points there. I looked on the internet for the issue and found most guys will consent with your site.
I was wondering if you ever considered changing the layout of your website? Its very well written; I love what youve got to say. But maybe you could a little more in the way of content so people could connect with it better. Youve got an awful lot of text for only having 1 or 2 pictures. Maybe you could space it out better?
I like this website so much, saved to favorites.
great post.Ne’er knew this, thanks for letting me know.
You really make it appear so easy with your presentation however I in finding this topic to be really one thing that I think I’d by no means understand. It sort of feels too complicated and extremely broad for me. I am looking ahead for your subsequent post, I will try to get the cling of it!
I am really enjoying the theme/design of your website. Do you ever run into any internet browser compatibility issues? A number of my blog readers have complained about my website not operating correctly in Explorer but looks great in Chrome. Do you have any suggestions to help fix this issue?
Have you ever thought about adding a little bit more than just your articles? I mean, what you say is important and all. However just imagine if you added some great graphics or video clips to give your posts more, “pop”! Your content is excellent but with pics and video clips, this blog could undeniably be one of the greatest in its niche. Great blog!
I have been browsing on-line more than three hours today, yet I never found any interesting article like yours. It¦s lovely value enough for me. Personally, if all site owners and bloggers made good content material as you did, the internet will probably be a lot more useful than ever before.
I have been browsing online greater than three hours today, but I by no means discovered any attention-grabbing article like yours. It’s lovely value sufficient for me. In my opinion, if all web owners and bloggers made good content material as you probably did, the web will likely be much more useful than ever before. “I finally realized that being grateful to my body was key to giving more love to myself.” by Oprah Winfrey.
I¦ll immediately grasp your rss as I can’t in finding your email subscription hyperlink or newsletter service. Do you’ve any? Please let me realize so that I may subscribe. Thanks.
Hi, Neat post. There’s a problem with your web site in internet explorer, might test this… IE nonetheless is the market leader and a large component to people will omit your fantastic writing due to this problem.
I’m really inspired with your writing talents as well as with the structure on your weblog. Is that this a paid subject or did you modify it your self? Either way stay up the excellent quality writing, it’s rare to peer a great blog like this one today..
Somebody essentially help to make seriously articles I would state. This is the very first time I frequented your website page and thus far? I surprised with the research you made to create this particular publish extraordinary. Excellent job!
Admiring the time and energy you put into your site and in depth information you provide. It’s awesome to come across a blog every once in a while that isn’t the same unwanted rehashed information. Fantastic read! I’ve bookmarked your site and I’m including your RSS feeds to my Google account.
Howdy very cool website!! Guy .. Excellent .. Superb .. I will bookmark your blog and take the feeds additionallyKI am satisfied to find a lot of helpful information right here within the put up, we’d like work out more strategies in this regard, thank you for sharing. . . . . .
You have noted very interesting points! ps nice site.
I do not even know the way I stopped up here, but I thought this put up used to be good. I do not recognize who you might be however certainly you are going to a well-known blogger if you happen to are not already 😉 Cheers!
You actually make it appear so easy together with your presentation however I to find this matter to be really one thing that I believe I’d by no means understand. It kind of feels too complex and very vast for me. I’m looking forward to your subsequent submit, I will attempt to get the dangle of it!
Hey there, I think your site might be having browser compatibility issues. When I look at your blog in Chrome, it looks fine but when opening in Internet Explorer, it has some overlapping. I just wanted to give you a quick heads up! Other then that, amazing blog!
Howdy! Do you know if they make any plugins to help with SEO? I’m trying to get my blog to rank for some targeted keywords but I’m not seeing very good results. If you know of any please share. Many thanks!
You are my intake, I have few web logs and often run out from to post .
I like meeting utile info, this post has got me even more info! .
Good day! I could have sworn I’ve been to this site before but after reading through some of the post I realized it’s new to me. Nonetheless, I’m definitely glad I found it and I’ll be book-marking and checking back often!
As a Newbie, I am permanently searching online for articles that can benefit me. Thank you
Your house is valueble for me. Thanks!…
Mitolyn is a cutting-edge natural dietary supplement designed to support effective weight loss and improve overall wellness.
I like this website very much, Its a rattling nice position to read and incur info .
You have mentioned very interesting details! ps decent site.
I feel that is one of the so much important information for me. And i’m happy reading your article. However should commentary on some common things, The web site style is ideal, the articles is truly nice : D. Good task, cheers
I regard something truly interesting about your web site so I saved to my bookmarks.
I genuinely enjoy reading through on this site, it has fantastic articles. “And all the winds go sighing, For sweet things dying.” by Christina Georgina Rossetti.
The Natural Mounjaro Recipe is more than just a diet—it’s a sustainable and natural approach to weight management and overall health.
Usually I do not read post on blogs, however I would like to say that this write-up very pressured me to check out and do it! Your writing taste has been amazed me. Thanks, very nice article.
I do not even know how I ended up here, but I thought this post was great. I do not know who you are but definitely you are going to a famous blogger if you aren’t already 😉 Cheers!
This was exactly what I was looking for—thanks for writing it! https://spyandmonitor.com
I found your blog site on google and test a few of your early posts. Continue to maintain up the very good operate. I simply additional up your RSS feed to my MSN Information Reader. Looking for forward to studying extra from you afterward!…
I think you have remarked some very interesting points, regards for the post.
Hi there, simply changed into aware of your blog thru Google, and located that it is really informative. I’m gonna be careful for brussels. I’ll be grateful when you continue this in future. Numerous other people might be benefited from your writing. Cheers!
It’s the best time to make some plans for the future and it’s time to be happy. I have read this post and if I could I want to suggest you few interesting things or suggestions. Perhaps you could write next articles referring to this article. I want to read even more things about it!
https://digitalforensicsquad.com/
Greetings! Very helpful advice on this article! It is the little changes that make the biggest changes. Thanks a lot for sharing!
Wow! This can be one particular of the most useful blogs We have ever arrive across on this subject. Actually Excellent. I’m also a specialist in this topic so I can understand your effort.
I was just searching for this info for some time. After six hours of continuous Googleing, finally I got it in your web site. I wonder what is the lack of Google strategy that do not rank this kind of informative web sites in top of the list. Normally the top sites are full of garbage.
I was examining some of your posts on this website and I conceive this internet site is rattling instructive! Retain putting up.
Very fantastic info can be found on website.
Nice read, I just passed this onto a colleague who was doing a little research on that. And he just bought me lunch as I found it for him smile Thus let me rephrase that: Thanks for lunch! “Any man would be forsworn to gain a kingdom.” by Roger Zelazny.
Lovely just what I was looking for.Thanks to the author for taking his time on this one.
Great V I should certainly pronounce, impressed with your website. I had no trouble navigating through all the tabs and related information ended up being truly simple to do to access. I recently found what I hoped for before you know it in the least. Quite unusual. Is likely to appreciate it for those who add forums or anything, web site theme . a tones way for your customer to communicate. Excellent task..
This is the precise blog for anyone who wants to find out about this topic. You understand so much its virtually arduous to argue with you (not that I truly would need…HaHa). You definitely put a brand new spin on a topic thats been written about for years. Nice stuff, just nice!
You actually make it appear really easy together with your presentation however I find this topic to be actually something which I believe I’d by no means understand. It kind of feels too complex and very large for me. I’m having a look forward for your subsequent put up, I¦ll attempt to get the grasp of it!
I like what you guys are up too. Such smart work and reporting! Carry on the excellent works guys I have incorporated you guys to my blogroll. I think it’ll improve the value of my website :).
I would like to thnkx for the efforts you have put in writing this blog. I am hoping the same high-grade blog post from you in the upcoming as well. In fact your creative writing abilities has inspired me to get my own blog now. Really the blogging is spreading its wings quickly. Your write up is a good example of it.
Very great post. I simply stumbled upon your weblog and wanted to say that I’ve truly enjoyed surfing around your weblog posts. After all I’ll be subscribing to your rss feed and I hope you write once more soon!
Hey there, I think your site might be having browser
compatibility issues. When I look at your website in Ie, it looks fine but when opening in Internet Explorer, it has some overlapping.
I just wanted to give you a quick heads up! Other then that, terrific
blog!
I like this blog very much, Its a rattling nice berth to read and receive info . “There’s nothing I’m afraid of like scared people.” by Robert Frost.
You really make it seem so easy with your presentation but I find this topic to be actually something that I think I would never understand. It seems too complicated and extremely broad for me. I’m looking forward for your next post, I’ll try to get the hang of it!
Nice post. I learn something more challenging on different blogs everyday. It will always be stimulating to read content from other writers and practice a little something from their store. I’d prefer to use some with the content on my blog whether you don’t mind. Natually I’ll give you a link on your web blog. Thanks for sharing.
There are some interesting points in time on this article but I don’t know if I see all of them middle to heart. There may be some validity but I will take maintain opinion till I look into it further. Good article , thanks and we wish extra! Added to FeedBurner as nicely
Hi , I do believe this is an excellent blog. I stumbled upon it on Yahoo , i will come back once again. Money and freedom is the best way to change, may you be rich and help other people.
Write more, thats all I have to say. Literally, it seems as though you relied on the video to make your point. You clearly know what youre talking about, why waste your intelligence on just posting videos to your weblog when you could be giving us something enlightening to read?
I’ll immediately take hold of your rss as I can’t find your e-mail subscription hyperlink or newsletter service. Do you have any? Kindly permit me realize so that I could subscribe. Thanks.
Can I just say what a relief to search out somebody who actually is aware of what theyre speaking about on the internet. You undoubtedly know learn how to deliver an issue to mild and make it important. Extra people have to read this and perceive this facet of the story. I cant imagine youre not more fashionable since you positively have the gift.
I’ve been browsing on-line more than three hours today, yet I by no means discovered any attention-grabbing article like yours. It’s beautiful worth enough for me. In my opinion, if all website owners and bloggers made excellent content as you probably did, the web will be a lot more helpful than ever before.
I’ll right away grab your rss feed as I can not to find your email subscription link or e-newsletter service. Do you have any? Kindly permit me realize so that I may just subscribe. Thanks.
I love the efforts you have put in this, thanks for all the great blog posts.
As I website owner I believe the articles here is very great, regards for your efforts.
I got what you mean , thanks for posting.Woh I am lucky to find this website through google. “It is a very hard undertaking to seek to please everybody.” by Publilius Syrus.
I like this post, enjoyed this one thank you for posting. “What is a thousand years Time is short for one who thinks, endless for one who yearns.” by Alain.
Thanks for your marvelous posting! I truly enjoyed reading it, you can be a great author.I will always bookmark your blog and will often come back very soon. I want to encourage that you continue your great posts, have a nice day!
An impressive share, I just given this onto a colleague who was doing a little analysis on this. And he in fact bought me breakfast because I found it for him.. smile. So let me reword that: Thnx for the treat! But yeah Thnkx for spending the time to discuss this, I feel strongly about it and love reading more on this topic. If possible, as you become expertise, would you mind updating your blog with more details? It is highly helpful for me. Big thumb up for this blog post!
Hepatoburn is a premium liver support and metabolic enhancement supplement. The liver plays a critical role in detoxification, metabolism, and fat processing. When the liver is overloaded with toxins or functioning poorly, it can slow down metabolism, cause fatigue, and contribute to weight gain
Hi there! Someone in my Facebook group shared this site with us so I came to give it a look. I’m definitely loving the information. I’m bookmarking and will be tweeting this to my followers! Excellent blog and superb design and style.
Thank you for sharing with us, I think this website genuinely stands out : D.
Tonic Greens is an all-natural immune-boosting supplement designed to support your overall wellness with the power of antioxidants, vitamins, and superfoods. It comes in a convenient powdered form that you can easily mix with water, juice, or your favorite smoothie.
Hi , I do believe this is an excellent blog. I stumbled upon it on Yahoo , i will come back once again. Money and freedom is the best way to change, may you be rich and help other people.
Magnificent items from you, man. I’ve understand your stuff prior to and you are simply extremely wonderful. I really like what you’ve acquired here, certainly like what you are stating and the best way through which you are saying it. You’re making it entertaining and you still take care of to stay it smart. I can not wait to read far more from you. That is actually a terrific website.
Your style is so unique compared to many other people. Thank you for publishing when you have the opportunity,Guess I will just make this bookmarked.2
Nerve Calm is an advanced nerve support formula that combines a synergistic blend of essential vitamins, minerals, and herbal extracts.
An impressive share, I just given this onto a colleague who was doing a little analysis on this. And he in fact bought me breakfast because I found it for him.. smile. So let me reword that: Thnx for the treat! But yeah Thnkx for spending the time to discuss this, I feel strongly about it and love reading more on this topic. If possible, as you become expertise, would you mind updating your blog with more details? It is highly helpful for me. Big thumb up for this blog post!
I wanted to thank you for this great read!! I definitely enjoying every little bit of it I have you bookmarked to check out new stuff you post…
Hi! I know this is kind of off topic but I was wondering which blog platform are you using for this website? I’m getting fed up of WordPress because I’ve had problems with hackers and I’m looking at options for another platform. I would be awesome if you could point me in the direction of a good platform.
But a smiling visitant here to share the love (:, btw great layout.
Hiya, I’m really glad I have found this information. Today bloggers publish only about gossips and net and this is really irritating. A good website with exciting content, that’s what I need. Thank you for keeping this website, I’ll be visiting it. Do you do newsletters? Cant find it.
I have been browsing online more than 3 hours as of late, yet I by no means found any fascinating article like yours. It is lovely worth enough for me. In my opinion, if all webmasters and bloggers made excellent content as you probably did, the internet might be much more helpful than ever before.
Hi! I’m at work browsing your blog from my new iphone 4! Just wanted to say I love reading your blog and look forward to all your posts! Carry on the excellent work!
very good publish, i definitely love this website, carry on it
I¦ve learn some excellent stuff here. Definitely value bookmarking for revisiting. I wonder how a lot attempt you set to make this type of excellent informative site.
Those are yours alright! . We at least need to get these people stealing images to start blogging! They probably just did a image search and grabbed them. They look good though!
Its not my first time to go to see this web site, i am
visiting this web page dailly and obtain fastidious facts from here all
the time.
Hello there, I found your blog via Google while searching for a related topic, your web site came up, it looks good. I have bookmarked it in my google bookmarks.
Hello.This post was extremely motivating, particularly since I was browsing for thoughts on this issue last Monday.
I¦ve been exploring for a bit for any high quality articles or weblog posts in this sort of house . Exploring in Yahoo I ultimately stumbled upon this site. Reading this information So i¦m glad to show that I have a very excellent uncanny feeling I discovered just what I needed. I so much indubitably will make certain to do not overlook this website and provides it a glance regularly.
I have read a few good stuff here. Definitely worth bookmarking for revisiting. I wonder how a lot effort you set to create such a fantastic informative site.
Wow, amazing weblog structure! How long have you ever been running a blog for? you make blogging glance easy. The overall look of your website is excellent, let alone the content!
I am continuously searching online for posts that can assist me. Thank you!
Thank you for another informative site. Where else could I get that type of info written in such a perfect way? I’ve a project that I’m just now working on, and I’ve been on the look out for such information.
I must convey my passion for your kindness for persons who really need assistance with this one field. Your real commitment to passing the message all around ended up being rather important and has surely allowed some individuals just like me to achieve their dreams. This valuable recommendations signifies so much to me and even more to my office colleagues. Warm regards; from everyone of us.
Fantastic web site. Plenty of useful information here. I?¦m sending it to several friends ans also sharing in delicious. And obviously, thank you on your effort!
I was just seeking this info for some time. After six hours of continuous Googleing, at last I got it in your website. I wonder what’s the lack of Google strategy that do not rank this type of informative sites in top of the list. Generally the top websites are full of garbage.
You made some nice points there. I looked on the internet for the issue and found most guys will go along with with your blog.
Hi! This is my first visit to your blog! We are a group of volunteers and starting a new initiative in a community in the same niche. Your blog provided us beneficial information to work on. You have done a extraordinary job!
I have learn a few just right stuff here. Definitely value bookmarking for revisiting. I surprise how so much effort you place to make such a fantastic informative site.
Hi my family member! I wish to say that this article is awesome, nice written and include approximately all important infos. I would like to look more posts like this.
You got a very superb website, Glad I noticed it through yahoo.
I do not even understand how I finished up right here, however I believed this post used to be good. I don’t know who you are however definitely you’re going to a famous blogger in the event you aren’t already 😉 Cheers!
Wow! Thank you! I constantly needed to write on my website something like that. Can I implement a part of your post to my blog?
where can i buy clomid pill where can i buy clomid price can i order cheap clomiphene without rx can i buy generic clomid without dr prescription cost cheap clomiphene without rx get cheap clomid without a prescription can you buy cheap clomiphene for sale
Wow, awesome blog layout! How long have you been blogging for? you make blogging look easy. The overall look of your website is great, as well as the content!
Definitely believe that which you said. Your favorite justification appeared to be on the net the simplest thing to be aware of. I say to you, I definitely get irked while people think about worries that they plainly don’t know about. You managed to hit the nail upon the top as well as defined out the whole thing without having side-effects , people could take a signal. Will likely be back to get more. Thanks
Hey there! I’m at work browsing your blog from my new iphone 4! Just wanted to say I love reading through your blog and look forward to all your posts! Carry on the great work!
whoah this blog is wonderful i really like reading your articles. Stay up the good work! You recognize, a lot of persons are hunting round for this info, you could aid them greatly.
Sweet blog! I found it while browsing on Yahoo News. Do you have any suggestions on how to get listed in Yahoo News? I’ve been trying for a while but I never seem to get there! Thanks
Together with everything that appears to be developing inside this particular subject matter, your points of view are somewhat stimulating. However, I am sorry, but I can not subscribe to your whole strategy, all be it exciting none the less. It seems to me that your opinions are not totally validated and in simple fact you are yourself not really fully certain of the assertion. In any case I did appreciate looking at it.
The thoroughness in this section is noteworthy.
Hello! This is kind of off topic but I need some guidance from an established blog. Is it difficult to set up your own blog? I’m not very techincal but I can figure things out pretty quick. I’m thinking about setting up my own but I’m not sure where to begin. Do you have any points or suggestions? Many thanks
The Pink Salt Trick is a minimalist but effective morning routine: Just drink a glass of lukewarm water mixed with a pinch of Himalayan pink salt as soon as you wake up.
In this grand scheme of things you actually secure a B- with regard to effort and hard work. Exactly where you confused everybody was first in all the particulars. As they say, the devil is in the details… And that couldn’t be more accurate in this article. Having said that, allow me say to you what exactly did work. Your authoring is certainly quite convincing and that is probably why I am taking an effort to comment. I do not make it a regular habit of doing that. 2nd, whilst I can certainly see a leaps in reasoning you come up with, I am definitely not certain of just how you appear to unite your points which inturn make your conclusion. For the moment I will subscribe to your point but hope in the future you link your facts better.
The Pink Salt Trick is a minimalist but effective morning routine: Just drink a glass of lukewarm water mixed with a pinch of Himalayan pink salt as soon as you wake up.
Hello there, just became alert to your blog through Google, and found that it is truly informative. I’m gonna watch out for brussels. I’ll appreciate if you continue this in future. Lots of people will be benefited from your writing. Cheers!
whoah this blog is fantastic i love reading your posts. Keep up the great work! You know, a lot of people are looking around for this info, you could help them greatly.
I have been absent for some time, but now I remember why I used to love this website. Thank you, I’ll try and check back more frequently. How frequently you update your web site?
An impressive share, I just given this onto a colleague who was doing a little analysis on this. And he in fact bought me breakfast because I found it for him.. smile. So let me reword that: Thnx for the treat! But yeah Thnkx for spending the time to discuss this, I feel strongly about it and love reading more on this topic. If possible, as you become expertise, would you mind updating your blog with more details? It is highly helpful for me. Big thumb up for this blog post!
This is the kind of post I find helpful.
Rattling nice design and great content, hardly anything else we want : D.
Nearly all of the things you point out happens to be astonishingly appropriate and that makes me ponder the reason why I hadn’t looked at this with this light previously. This particular piece truly did turn the light on for me personally as far as this topic goes. But there is actually just one position I am not necessarily too cozy with and while I try to reconcile that with the actual central theme of your point, let me observe what the rest of your subscribers have to point out.Nicely done.
Thank you for sharing excellent informations. Your web site is so cool. I am impressed by the details that you’ve on this web site. It reveals how nicely you understand this subject. Bookmarked this web page, will come back for more articles. You, my friend, ROCK! I found simply the info I already searched everywhere and simply couldn’t come across. What a perfect web site.
I am curious to find out what blog platform you have been working with? I’m having some small security problems with my latest website and I’d like to find something more risk-free. Do you have any recommendations?
order azithromycin 250mg pill – sumycin 500mg usa flagyl generic
Your place is valueble for me. Thanks!…
Very interesting details you have noted, thankyou for putting up.
purchase semaglutide generic – order periactin 4mg order cyproheptadine 4mg without prescription
You completed various nice points there. I did a search on the subject matter and found most persons will agree with your blog.
of course like your web-site but you need to check the spelling on several of your posts. Many of them are rife with spelling issues and I find it very troublesome to tell the truth nevertheless I’ll definitely come back again.
Hello, you used to write great, but the last several posts have been kinda boring… I miss your super writings. Past few posts are just a little out of track! come on!
Hello. splendid job. I did not anticipate this. This is a splendid story. Thanks!
Some genuinely interesting details you have written.Assisted me a lot, just what I was looking for : D.
I am typically to running a blog and i really recognize your content. The article has actually peaks my interest. I am going to bookmark your website and maintain checking for brand spanking new information.
motilium cost – tetracycline 500mg tablet cyclobenzaprine brand
Youre so cool! I dont suppose Ive learn anything like this before. So nice to search out any person with some unique thoughts on this subject. realy thanks for beginning this up. this web site is one thing that’s needed on the web, somebody with a bit of originality. useful job for bringing something new to the web!
Hello.This article was really interesting, especially since I was investigating for thoughts on this matter last Saturday.
Dead composed subject material, regards for selective information. “You can do very little with faith, but you can do nothing without it.” by Samuel Butler.
Pretty! This was a really wonderful post. Thank you for your provided information.
Normally I do not read post on blogs, however I wish to say that this write-up very forced me to try and do it! Your writing taste has been amazed me. Thanks, quite great post.
Everything is very open and very clear explanation of issues. was truly information. Your website is very useful. Thanks for sharing.
I haven’t checked in here for some time because I thought it was getting boring, but the last few posts are great quality so I guess I will add you back to my daily bloglist. You deserve it my friend 🙂
Tried the https://www.cornbreadhemp.com/collections/thc-gummies from Cornbread Hemp. I went with the thoroughly spectrum ones — the ones with a teeny THC. Took sole before bed. The mouthful is exquisite, considerate of rough but not gross. After beside an hour, I felt more relaxed. Not knocked forbidden or anything, unbiased calm adequately to fall asleep without overthinking. No grogginess in the morning, which I was distraught about. They’re not seedy, but if you’ve had vex unwinding at dusk, this superiority remedy
Wow! This could be one particular of the most beneficial blogs We have ever arrive across on this subject. Actually Excellent. I am also a specialist in this topic so I can understand your effort.
Howdy! I know this is kinda off topic nevertheless I’d figured I’d ask. Would you be interested in trading links or maybe guest writing a blog article or vice-versa? My blog covers a lot of the same topics as yours and I believe we could greatly benefit from each other. If you might be interested feel free to send me an email. I look forward to hearing from you! Awesome blog by the way!
I like this weblog very much, Its a rattling nice situation to read and obtain info . “There is no exercise better for the heart than reaching down and lifting people up.” by John Andrew Holmes.
Oh my goodness! an amazing article dude. Thank you However I’m experiencing subject with ur rss . Don’t know why Unable to subscribe to it. Is there anyone getting identical rss downside? Anyone who is aware of kindly respond. Thnkx
Hi, just required you to know I he added your site to my Google bookmarks due to your layout. But seriously, I believe your internet site has 1 in the freshest theme I??ve came across. It extremely helps make reading your blog significantly easier.
I discovered your blog site on google and check a few of your early posts. Continue to keep up the very good operate. I just additional up your RSS feed to my MSN News Reader. Seeking forward to reading more from you later on!…
It’s actually a nice and useful piece of info. I’m happy that you simply shared this helpful information with us. Please stay us up to date like this. Thank you for sharing.
I like this website very much, Its a rattling nice spot to read and receive information. “One man’s religion is another man’s belly laugh.” by Robert Anson Heinlein.
As I site possessor I believe the content matter here is rattling magnificent , appreciate it for your hard work. You should keep it up forever! Good Luck.
Hey there! I know this is kinda off topic nevertheless I’d figured I’d ask. Would you be interested in trading links or maybe guest writing a blog post or vice-versa? My site covers a lot of the same subjects as yours and I feel we could greatly benefit from each other. If you happen to be interested feel free to send me an email. I look forward to hearing from you! Superb blog by the way!
I was more than happy to seek out this web-site.I needed to thanks for your time for this excellent learn!! I positively having fun with each little little bit of it and I have you bookmarked to take a look at new stuff you blog post.
Thanks for another informative site. Where else could I get that type of information written in such a perfect way? I have a project that I am just now working on, and I have been on the look out for such info.
Appreciate it for this fantastic post, I am glad I noticed this web site on yahoo.
I think this web site holds some really fantastic info for everyone. “Loving someone is easy but losing someone is hard.” by Shelby Harthcock.
Oh my goodness! an amazing article dude. Thanks However I am experiencing subject with ur rss . Don’t know why Unable to subscribe to it. Is there anybody getting equivalent rss drawback? Anybody who is aware of kindly respond. Thnkx
Thanks for the good writeup. It in fact was once a amusement account it. Glance complex to more brought agreeable from you! However, how can we be in contact?
I have not checked in here for a while because I thought it was getting boring, but the last several posts are great quality so I guess I will add you back to my everyday bloglist. You deserve it my friend 🙂
You have observed very interesting points! ps decent web site.
You actually make it appear really easy together with your presentation however I to find this matter to be actually something which I think I’d by no means understand. It sort of feels too complicated and extremely large for me. I am looking forward to your next submit, I will attempt to get the dangle of it!
I do not even know how I ended up here, but I thought this post was great. I don’t know who you are but certainly you are going to a famous blogger if you are not already 😉 Cheers!
Wow! This can be one particular of the most beneficial blogs We have ever arrive across on this subject. Basically Great. I’m also a specialist in this topic therefore I can understand your hard work.
I’d must examine with you here. Which isn’t one thing I normally do! I get pleasure from reading a put up that will make individuals think. Also, thanks for permitting me to comment!
I’m not sure where you are getting your info, but great topic. I needs to spend some time learning much more or understanding more. Thanks for wonderful info I was looking for this information for my mission.
This is a very good tips especially to those new to blogosphere, brief and accurate information… Thanks for sharing this one. A must read article.
Simply desire to say your article is as astounding. The clearness in your post is simply excellent and i can suppose you are an expert in this subject. Well with your permission let me to grab your RSS feed to keep up to date with drawing close post. Thank you 1,000,000 and please continue the rewarding work.
Hey, I think your website might be having browser compatibility issues. When I look at your blog site in Safari, it looks fine but when opening in Internet Explorer, it has some overlapping. I just wanted to give you a quick heads up! Other then that, excellent blog!
The very root of your writing while appearing reasonable initially, did not sit perfectly with me personally after some time. Someplace throughout the sentences you actually managed to make me a believer unfortunately only for a while. I however have a problem with your jumps in assumptions and one would do well to help fill in all those breaks. In the event you can accomplish that, I could undoubtedly end up being impressed.
Wonderful website you have here but I was curious about if you knew of any user discussion forums that cover the same topics discussed here? I’d really love to be a part of online community where I can get feedback from other experienced people that share the same interest. If you have any recommendations, please let me know. Many thanks!
buy amoxil paypal – combivent uk order combivent 100mcg generic
I conceive this site contains very good written subject matter content.
I am glad to be a visitant of this thoroughgoing weblog! , thanks for this rare information! .
Thank you for the auspicious writeup. It in fact was a amusement account it. Look advanced to more added agreeable from you! By the way, how could we communicate?
You completed various nice points there. I did a search on the subject and found mainly persons will have the same opinion with your blog.
F*ckin’ tremendous things here. I’m very glad to see your article. Thanks a lot and i’m looking forward to contact you. Will you please drop me a e-mail?
Excellent read, I just passed this onto a friend who was doing some research on that. And he actually bought me lunch since I found it for him smile Therefore let me rephrase that: Thanks for lunch! “He who walks in another’s tracks leaves no footprints.” by Joan Brannon.
I like this site because so much utile stuff on here : D.
I’m still learning from you, but I’m improving myself. I absolutely liked reading all that is written on your website.Keep the stories coming. I liked it!
whoah this blog is great i love reading your posts. Keep up the great work! You know, many people are searching around for this info, you could aid them greatly.
Awsome post and right to the point. I don’t know if this is truly the best place to ask but do you folks have any thoughts on where to hire some professional writers? Thank you 🙂
Excellent post. I was checking constantly this blog and I’m impressed! Extremely helpful info specially the last part 🙂 I care for such info a lot. I was seeking this particular info for a long time. Thank you and good luck.
I am thankful that I detected this web site, exactly the right info that I was looking for! .