Welcome to our official publication of the Prometheus ETF Portfolio. Our primary takeaways for last week are as follows:
- Nominal growth pricing dominates price action and remains supported by private-sector liquidity.
- Markets continue to price interest rate cuts.
- Stocks are likely to continue to outperform bonds if nominal growth dynamics persist.
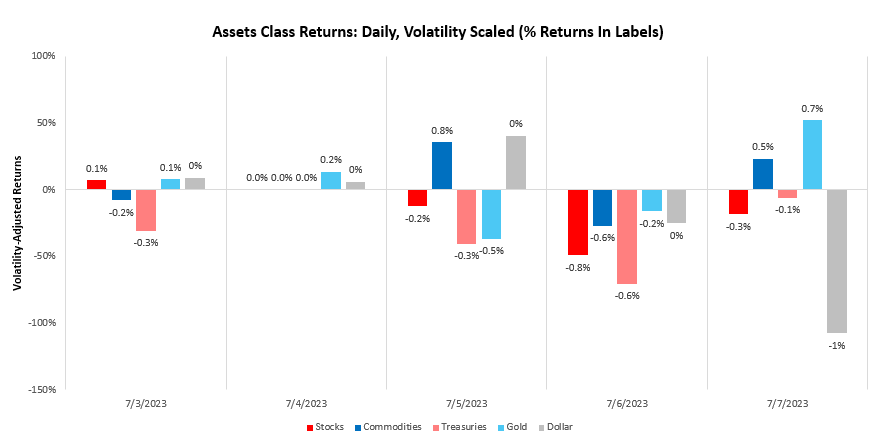
Over the last week, our systems moved to price tightening liquidity, with stocks falling by -0.62%. We show the daily path of returns through the week:
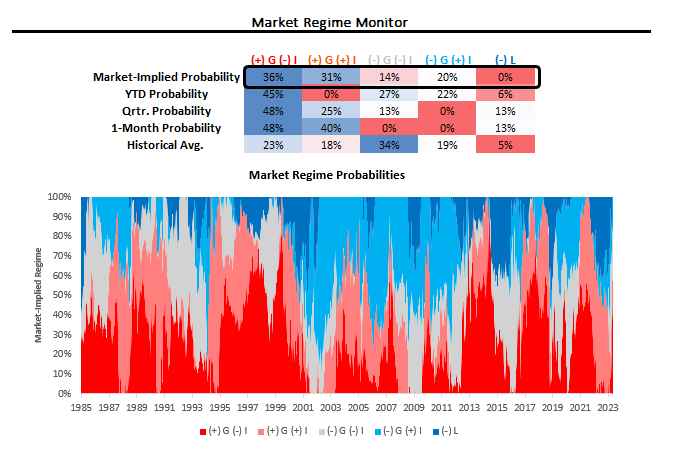
Using our understanding of cross-asset market pricing, we can derive the market-implied odds of varying regimes of growth, inflation, and liquidity. Currently, our proprietary process suggests that we are in a period of (+) G (-) I. We show our market regime monitor below:
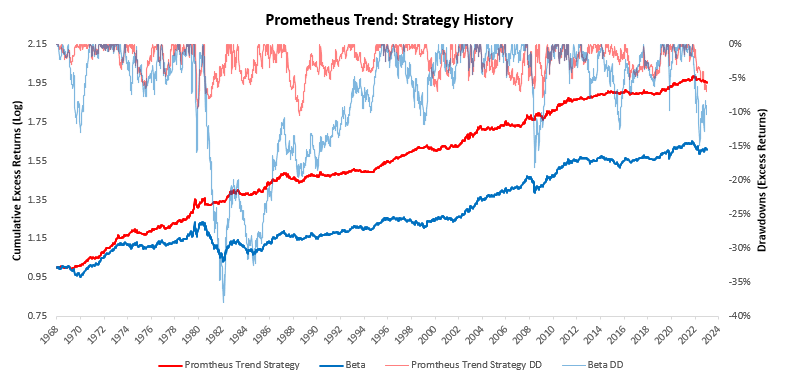
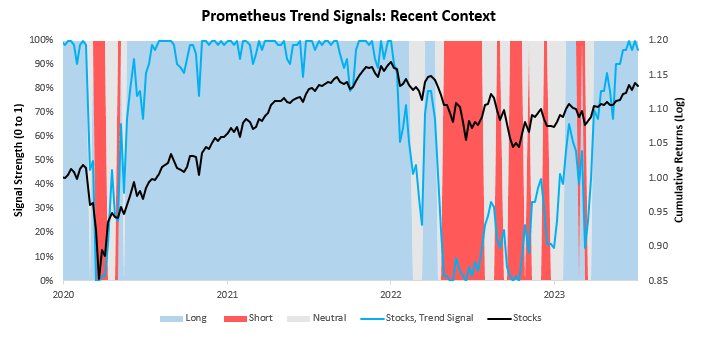
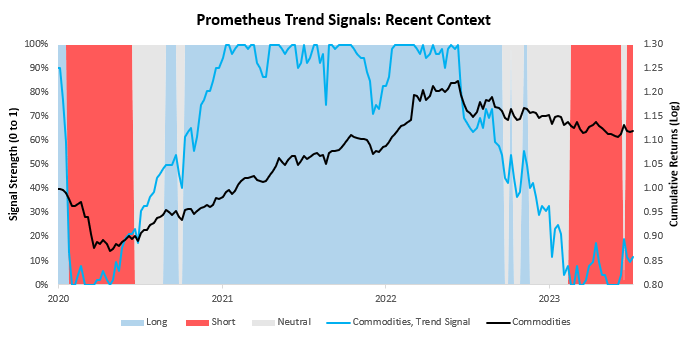
This market pricing remains consistent with a strong trend in equity markets, despite weakness this last week. For context— we have developed a set of trend filters to help us better evaluate the sustainability of asset-class moves. As always, we have tested these trend measures over time to understand whether they can help reliably generate an edge in markets. As proof of concept, we show how these combined signals have performed relative to an underlying portfolio of the same four assets. Currently, these signals suggest long positions in stocks, short positions in bonds, short positions in commodities, and long positions in gold.
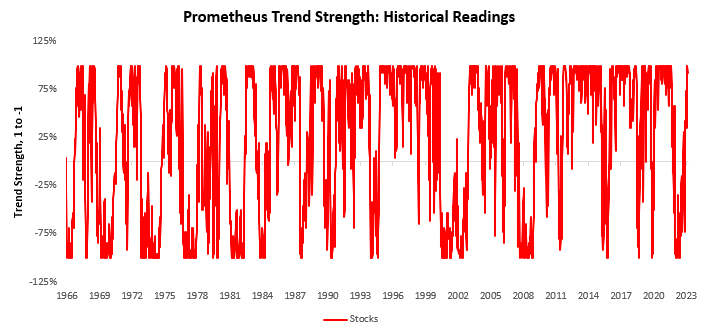
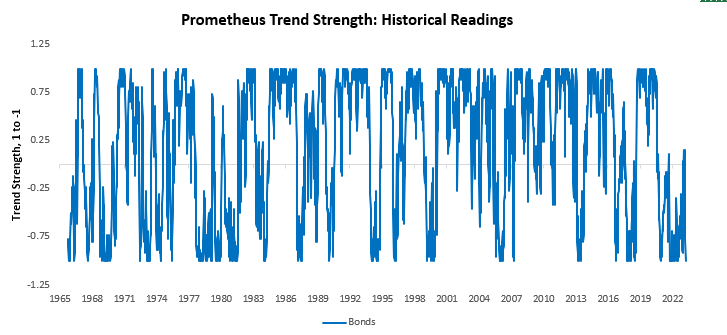
We begin by showing our signals for stocks. We show both the full signal history and the most recent signal context:
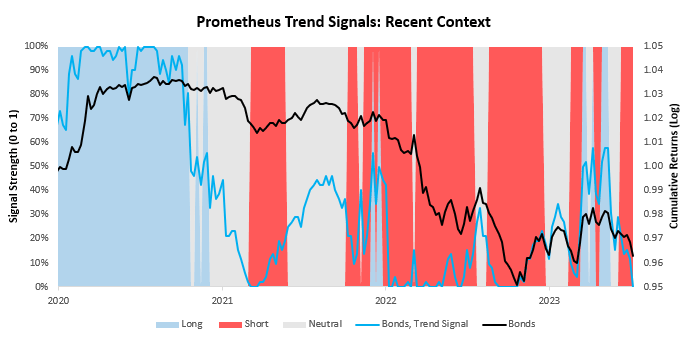
Next, we show our system’s current readings for 10-Year Treasuries:
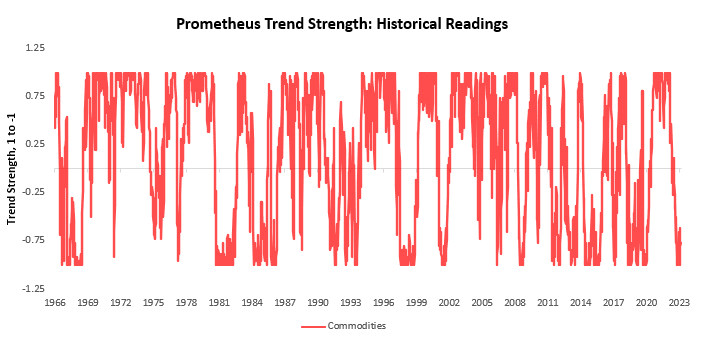
We now turn our attention to commodities:
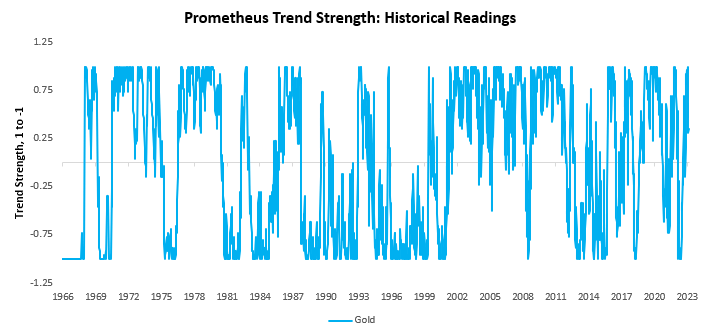
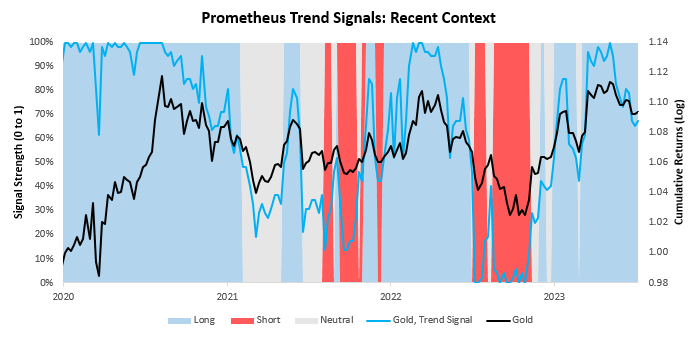
Finally, we show our trend signals for gold:
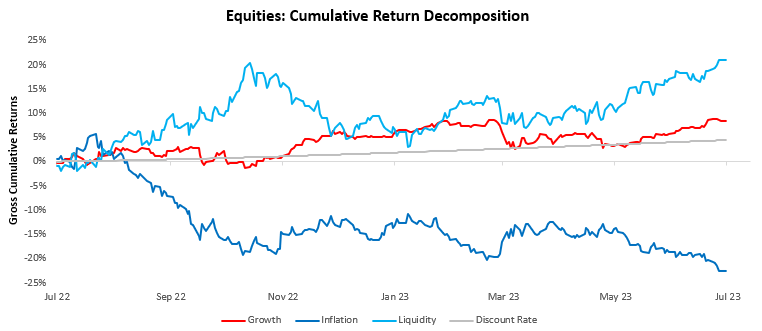
Overall, markets continue to price rising growth conditions within a backdrop of rising private sector liquidity. We show how this has driven equities higher:
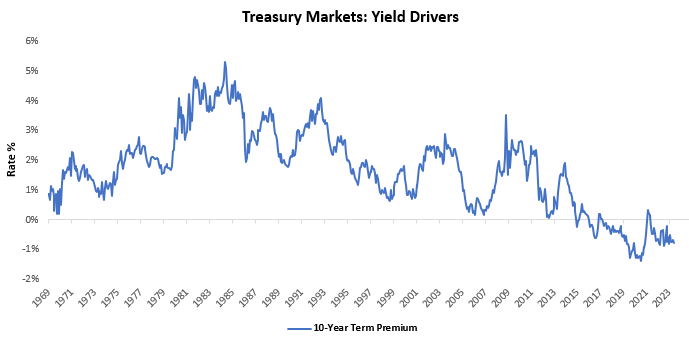
At the same time, policy liquidity remains tight, as evidenced by term premia:
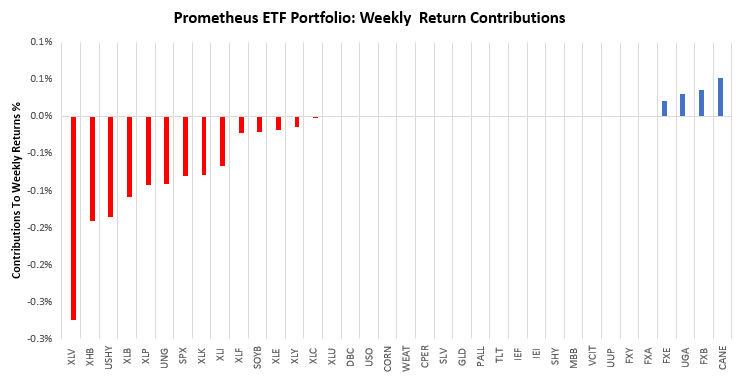
Overall, the picture remains one where pro-cyclical liquidity dominates markets. In this context, our strategies were long equities. Over the last week, the Prometheus ETF Portfolio was down by -1.01%. Below, we show the contributions to this portfolio performance across securities:
Turning to next week, our systems are looking to position the Prometheus ETF Portfolio as shown below. The portfolio contains 16 positions heading into next week. We show these below:

POSITIONS: IEI : -22.1% SOYB: 9.11% CANE: 8.51% FXE : 8.1% SPX : 6.91% Cash: -6.65% XLI : 6.06% XLF : 5.83% FXB : 5.82% XLB : 5.29% XLC : 5.02% XLY : 5.02% XLK : 5% USO : 4.8% XHB : 4.59% UGA : 4.48% . Please note if cash position is negative it implies leverage.
Additionally, we show these positions aggregated into asset class allocations below:
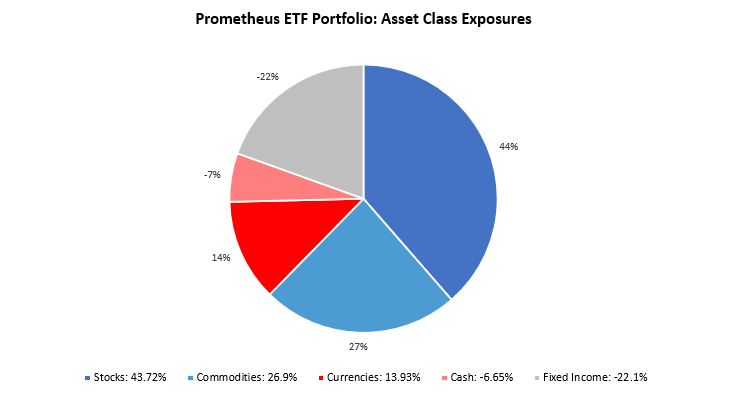
The portfolio has a net exposure (ex-cash) of 62.45%, with a gross exposure (ex-cash) of 106.65%. This allocation has an expected volatility of 12.89%, with a maximum expected volatility of 20%.
Hey, everyone!
Check this out if you’re into smart money moves!
2024 finance tips
Happy budgeting!
Hi, guys!
No way!
bl4nkcode learning platform
See you later!
Hey there!
I can’t belive my eyes!
bl4nkcode coding guides
Bye, everyone!
I’m extremely inspired along with your writing skills
and also with the format to your weblog. Is that this a paid topic or did you customize it yourself?
Anyway stay up the nice quality writing, it’s rare to see a great blog like this one nowadays.
Beehiiv!