Welcome to our official publication of the Prometheus ETF Portfolio. Our primary takeaways for last week are as follows:
- Markets have moved to price-rising real growth and increasing liquidity.
- A significant portion of these moves comes from markets pricing easier monetary conditions via lower real interest rates. We see this as incongruent with the current inflationary dynamic.
- Our systems are moving to position the Prometheus ETF Portfolio to benefit from resilient nominal growth and reversals in treasury and fixed-income markets.
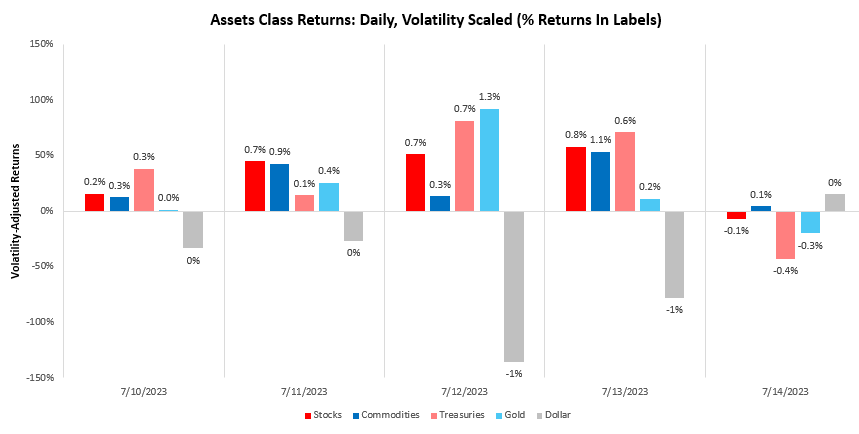
Over the last week, our systems moved to price-rising real growth, with stocks rising by 2.42%. We show the daily path of returns through the week:
While Treasuries also put up good returns this week, we think it is important to contextualize these returns within the bigger picture. The Treasury market remains in drawdown over the last year, with weakness across the curve:
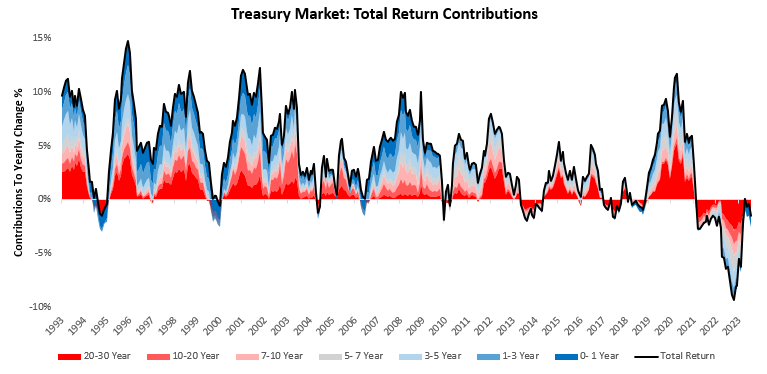
As we can see, returns improved since last year but remain subdued. A significant portion of this slowing of Treasury weakness has come from the compression in breakeven inflation rates. Below, we show 5-year breakevens, which closely coincide with the weighted average maturity of outstanding US debt, allowing us a picture that is fairly representative of pricing across the aggregate treasury market:
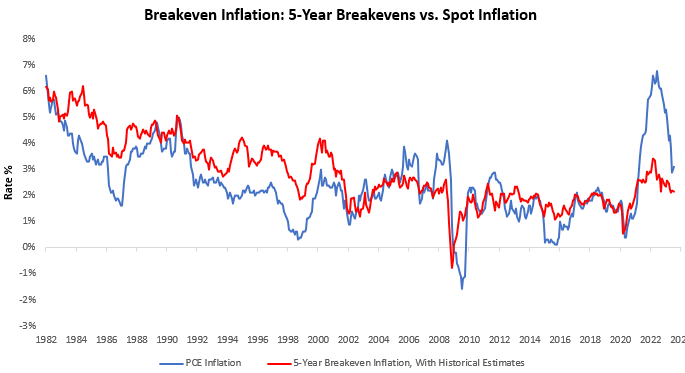
As we can see above, 5-year breakevens have declined 1.26% since their 2022 highs and now sit at 2.16%. Looking ahead, with a significant drop off in nominal activity, it looks unlikely that breakevens will be the marginal mover of Treasuries. In fact, if nominal spending remains resilient, they could reprice higher.
On the other hand, Treasuries across the curve continue to price rate cuts. We show this below:
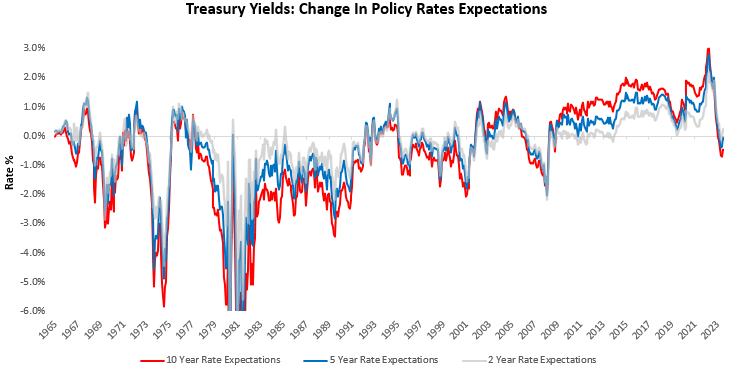
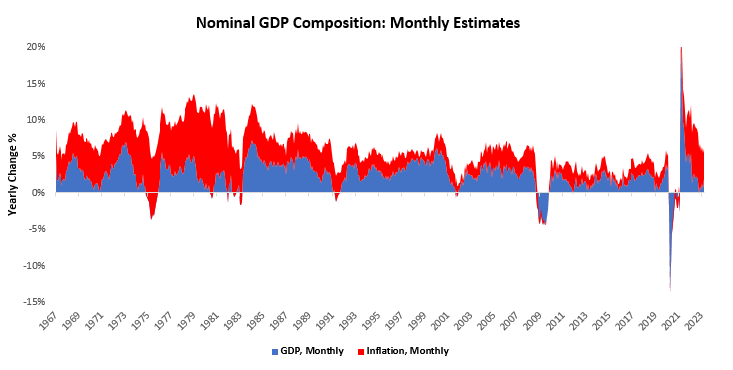
Given current nominal spending (shown below), it is more likely that expectations of interest rate cuts of priced away rather than further disinflation is to be priced in. Our latest estimates place nominal GDP at 4.27% versus one year prior:
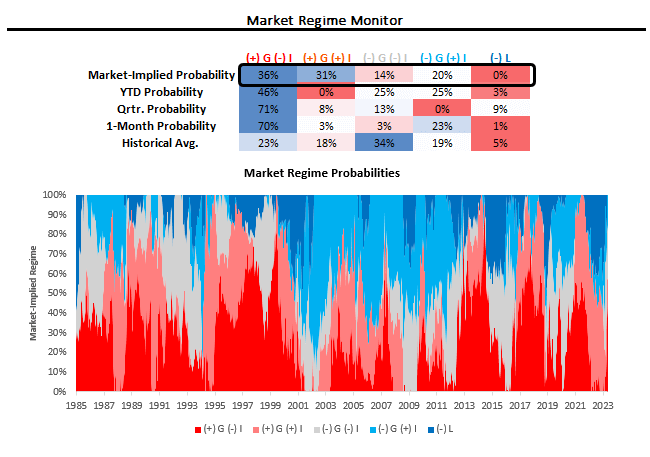
Additionally, our market measures continue to show markets pricing heightened odds of nominal growth and positive liquidity. Using our understanding of cross-asset market pricing, we can derive the market-implied odds of varying regimes of growth, inflation, and liquidity. Currently, our proprietary process suggests that we are in a period of (+) G (-) I. We show our market regime monitor below:
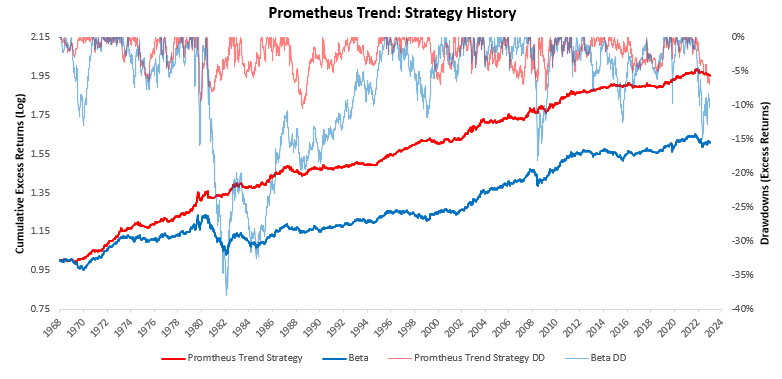
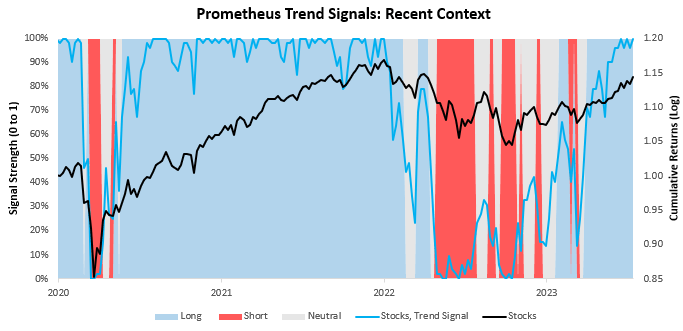
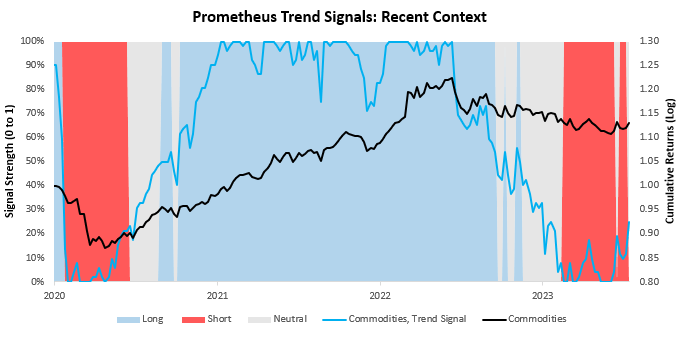
For further context— we have developed a set of trend filters to help us better evaluate the sustainability of asset-class moves. As always, we have tested these trend measures over time to understand whether they can help reliably generate an edge in markets. As proof of concept, we show how these combined signals have performed relative to an underlying portfolio of the same four assets. Currently, these signals suggest long positions in stocks, short positions in bonds, flat positions in commodities, and long positions in gold.
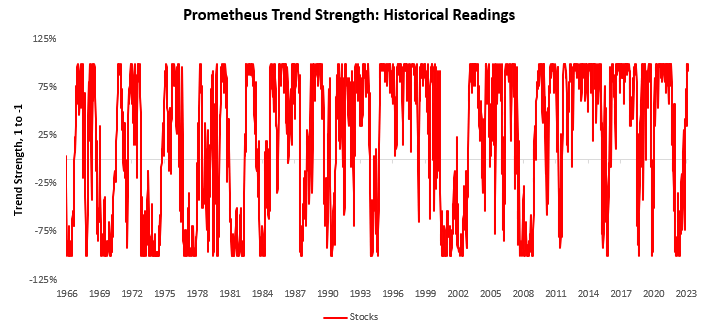
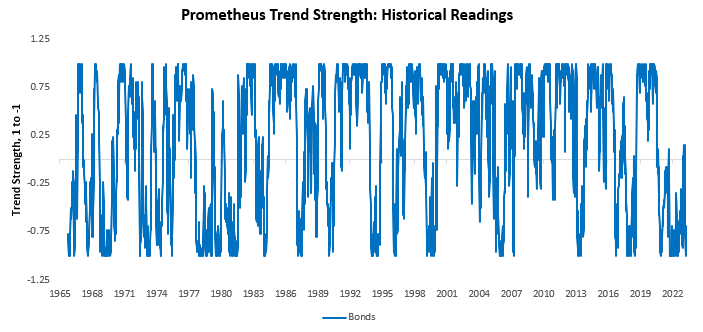
We begin by showing our signals for stocks. We show both the full signal history and the most recent signal context:
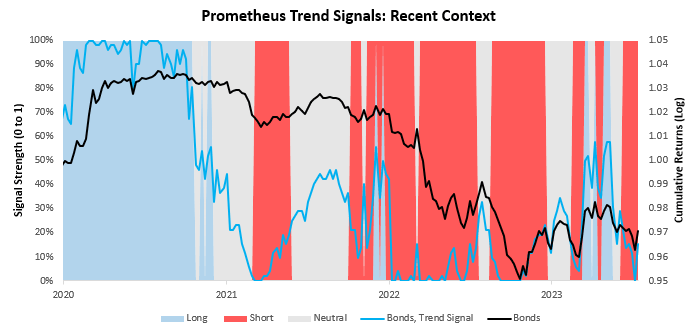
Next, we show our system’s current readings for 10-Year Treasuries:
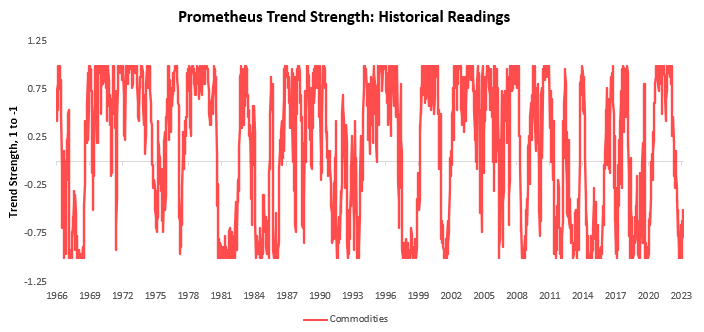
We now turn our attention to commodities:
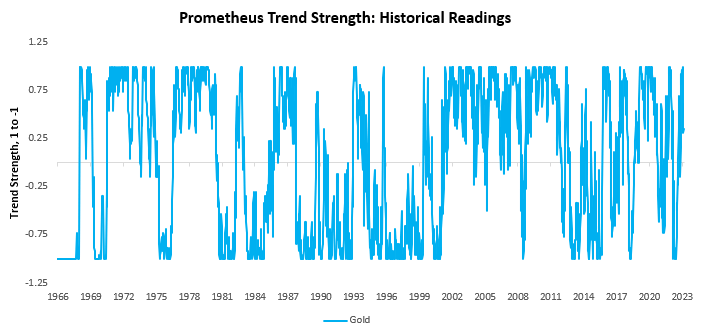
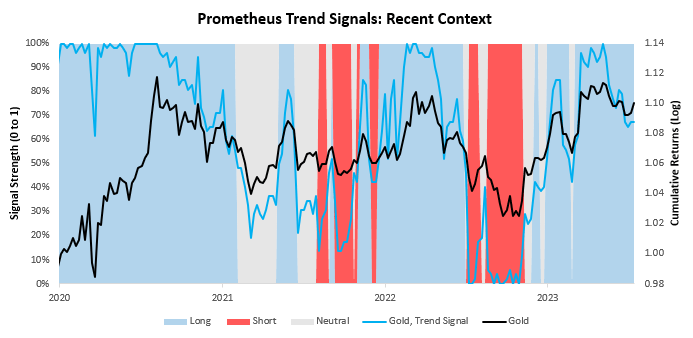
 Finally, we show our trend signals for gold:
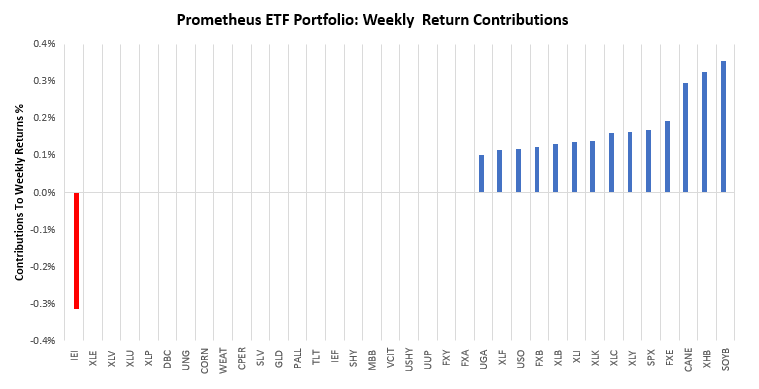
Our trend measures confirm the picture implied by current economic activity, resilient nominal spending, and elevated liquidity. Last week, we were well-positioned for these trends. Over the last week, the Prometheus ETF Portfolio was up by 2.21%. Below, we show the contributions to this portfolio performance across securities:
Turning to next week, our systems are looking to position the Prometheus ETF Portfolio as shown below. The portfolio contains 25 positions heading into next week. We show these below:
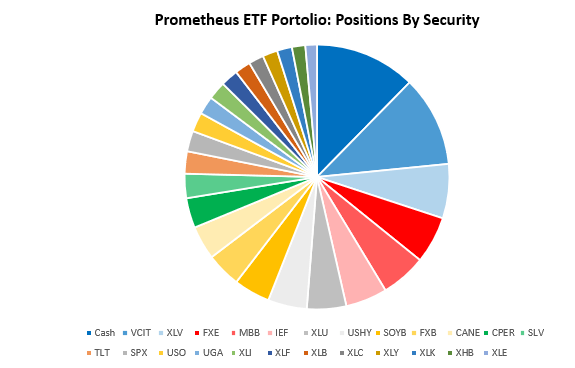
POSITIONS: Cash: -16.37% VCIT: -14.72% XLV : -8.81% FXE : 7.63% MBB : -7.36% IEF : -6.76% XLU : -6.37% USHY: 6.31% SOYB: 5.88% FXB : 5.61% CANE: 5.46% CPER: 4.86% SLV : 3.94% TLT : -3.61% SPX : 3.34% USO : 3.14% UGA : 2.94% XLI : 2.94% XLF : 2.82% XLB : 2.56% XLC : 2.43% XLY : 2.42% XLK : 2.42% XHB : 2.16% XLE : 1.87% . Please note if cash position is negative it implies leverage.
Additionally, we show these positions aggregated into asset class allocations below:

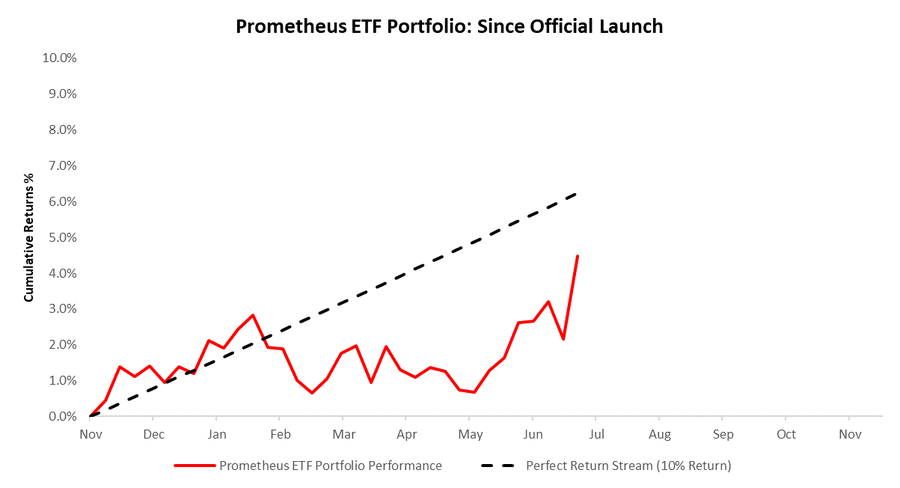
The portfolio has a net exposure (ex-cash) of 21.12%, with a gross exposure (ex-cash) of 116.37%. This allocation has an expected volatility of 8.05%, with maximum expected volatility of 20%. Finally, for context, we show the performance of the strategy since we launched last year. Our return stream hasn’t been perfect but has been doing its job of delivering consistent returns at a low level of risk. 53% of months since launch have been positive:
In the coming week, we will receive data on spending, production, and residential construction. Barring a significant downside shock coming from higher savings rates, we do not expect nominal spending to deteriorate, production to be weak, and residential construction to show some degree of mean reversion. The scenario that would hurt our positioning the most is significantly negative data retail sales. We don’t see that as likely this week. Overall, the likelihood of achieving maximum volatility is modest. Until next week.
I greatly appreciate and want to thank you all for the hard work that is given out for free. Is there anywhere I can go and see what the past performance of your work has been? Thank you in advance for your response.
Brent Chavez
Hi Brent,
Please find the return stream since inception. We also have the simulated return stream going back to the 1970s, which contains the same characteristics and may help with further contextualization.
The best place for health consultations.
can you get lisinopril tablets
A pharmacy I wholeheartedly recommend to others.
I’m always informed about potential medication interactions.
cheap cipro online
Their international health campaigns are revolutionary.
I love the convenient location of this pharmacy.
cost of cytotec price
Get warning information here.
They consistently exceed global healthcare expectations.
where to buy generic lisinopril
Their international team is incredibly knowledgeable.
I trust them with all my medication needs.
can you get generic clomid no prescription
Appreciate their commitment to maintaining global healthcare standards.
where to buy generic clomiphene without dr prescription buying clomiphene no prescription clomiphene generic can i get generic clomid without a prescription can i purchase clomid for sale how can i get clomiphene tablets where to get generic clomiphene without prescription
This is a keynote which is near to my fundamentals… Diverse thanks! Quite where can I lay one’s hands on the acquaintance details due to the fact that questions?
More content pieces like this would create the интернет better.
order azithromycin sale – sumycin 250mg ca flagyl 200mg sale
buy semaglutide cheap – semaglutide 14mg drug periactin 4 mg price
domperidone 10mg price – generic domperidone flexeril 15mg without prescription
inderal 10mg price – how to get methotrexate without a prescription cost methotrexate
amoxil canada – cost diovan 80mg order combivent 100 mcg pill
buy zithromax online – buy tinidazole sale bystolic 20mg price