
If you haven’t already, check out Episode 3 of the Prometheus Podcast! For this episode, we have a formidable guest- Mr. Blonde. Mr. Blonde is an independent macro strategist who chooses to remain anonymous. With significant experience on both the buy-side & sell-side- his equity-centric research is timely, precise, and pragmatic. This year, he’s done an excellent job expecting the bear market in stocks & the ensuing bear market rally. In a wide-ranging discussion, our Founder, Aahan Menon, helps Mr. Blonde take you through a masterclass in macro-equity investing. This episode is a must-listen for anyone investing or trading equities actively. Enjoy!
Last week, markets largely moved to price stagflationary nominal growth, extending the market-implied probability of this regime and cementing its market dominance. We show our market regime monitor below:
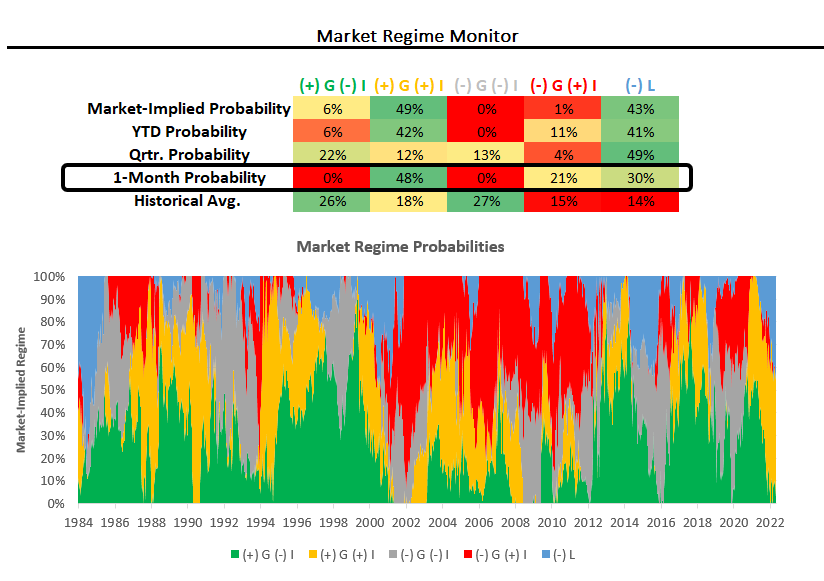
As a refresher- using our understanding of asset markets, we can estimate the current market-implied regime in terms of growth, inflation, and liquidity:
(+) G (-) I: Rising Growth & Falling Inflation
(+) G (+) I: Rising Growth & Rising Inflation
(-) G (-) I: Falling Growth & Falling Inflation
(-) G (+) I: Falling Growth & Rising Inflation
(-) L: Tightening Liquidity
Our systems continue to flag the current environment as one of stagflationary nominal growth & tightening liquidity. Consistent with this, commodities continued to power through last week:
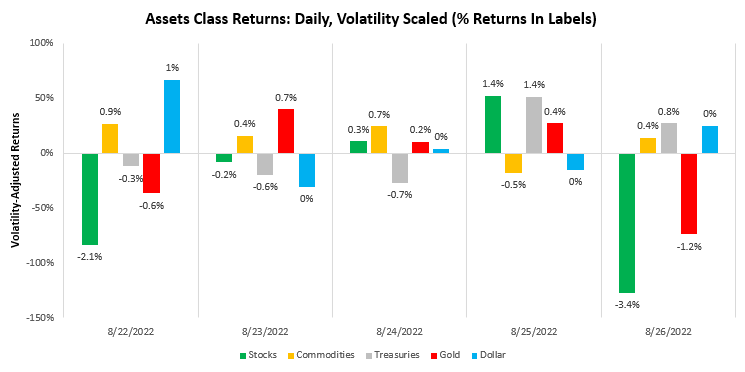
This commodity strength came despite Fed Chairman Powell’s hawkish commentary from Jackson Hole. From our perspective, this policy messaging was fairly inevitable, given the current relationship between the labor market (extremely tight) & inflation (significantly elevated). The question for us is now whether the Fed can remain resolute in its will to fight inflation. While Chair Powell has confirmed that the Fed is willing to see the tightening of financial conditions, lower spending, & weaker labor markets as a sacrifice to achieve low and stable inflation we wonder whether the Fed will actually be able to tolerate the pain caused by these sacrifices and stay the path. Our approach is not to make decisions based on what the Fed will say or do but to find the self-reinforcing conditions that will likely lead the way to their eventual choices. Consistent with this idea, we focus not on what the Fed will do but on what economic and financial data will force them to do.
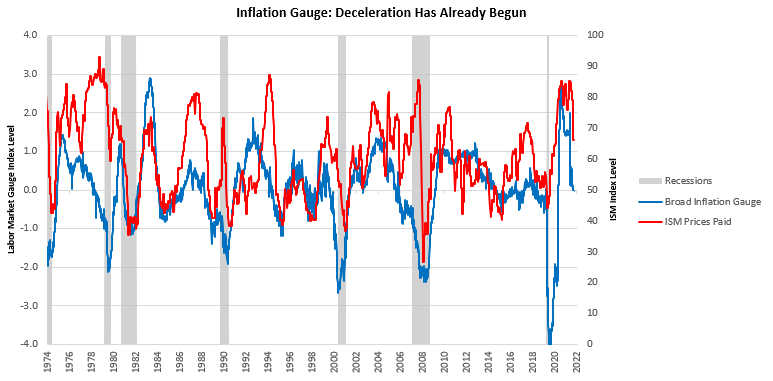
Currently, our systems are painting a picture of weak forward-looking real growth- mainly coming from the deterioration in the return on capital & the rising cost of capital. Liquidity continues to dry as the Fed & Treasury embark on a historic tightening of US Sovereign liabilities. By our measures, the inflation impulse has already begun to slow this led us to have a period of long Treasury exposure as markets presented an emerging opportunity. Our systems views are also reinforced by the slowing in ISM Prices paid data. We show this below:
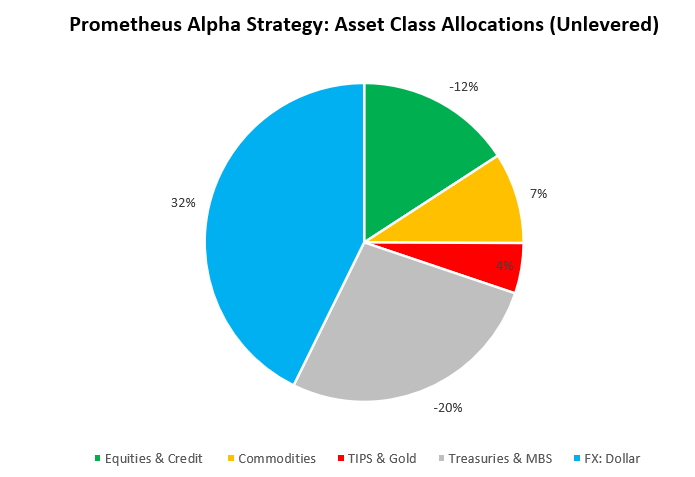
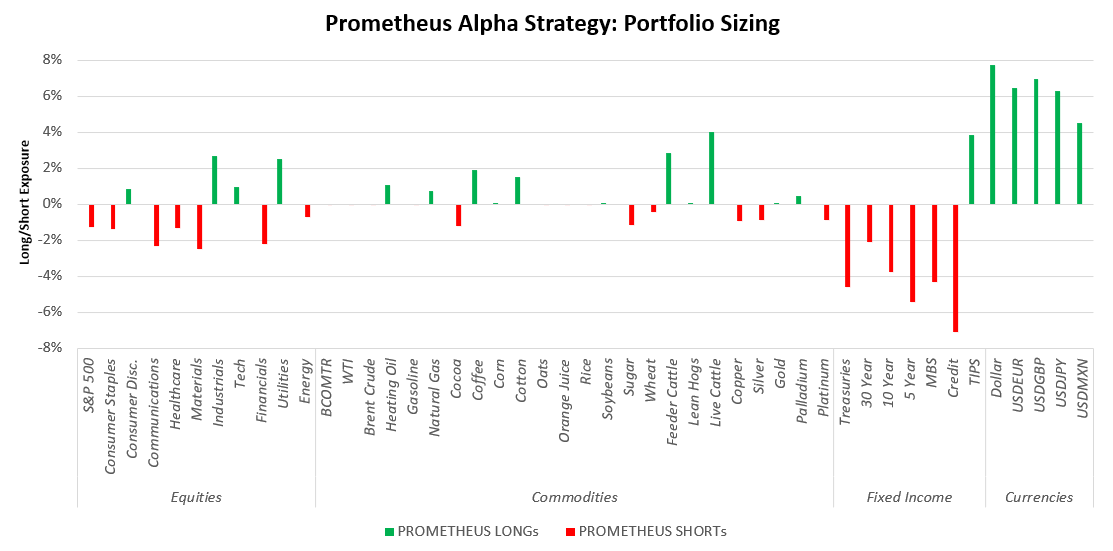
However, market regime dynamics have not been conducive to continuing this exposure & since our systems once again flipped to short Treasuries last week. Our inflation gauges continue to tell us of a slowdown, but market pricing matters when it comes to triggering aggressive risk-taking. Market prices are changing positions, representing market participants trying to optimize assets and liabilities based on an evolving set of conditions. Therefore, while our fundamental tracking creates pressures to trigger positions, we wait for our timing tools to confirm these exposures. Resultantly, our Alpha Strategy is positioned as follows at the asset class level heading into next week:
We show this at the security level:
Before we dive into the outlook driving these positions, we show the upcoming data calendar relevant to our systematic tracking of conditions:
-
Monday: Dallas Fed Mfg
-
Tuesday: FHFA HPI
-
Wednesday: MBA Mortgage Apps, ADP Employment, MNI PMI
-
Thursday: Jobless Claims, S&P Mfg PMI, ISM Mfg
-
Friday: Nonfarm Payrolls, Unemployment Rate, Durable Goods Orders, Factory Orders
Now, let’s put this data in the context of our systematic outlook. Below are the top developments that stand out to us:
i. A weakening labor market will cause the next leg lower in the economy. While it is often touted that the labor market is a lagging economic indicator, we think it is central to economic activity. This is particularly true today, with labor market growth driving the bulk of real income. Below, we show our attribution of real income to its constituent sources:
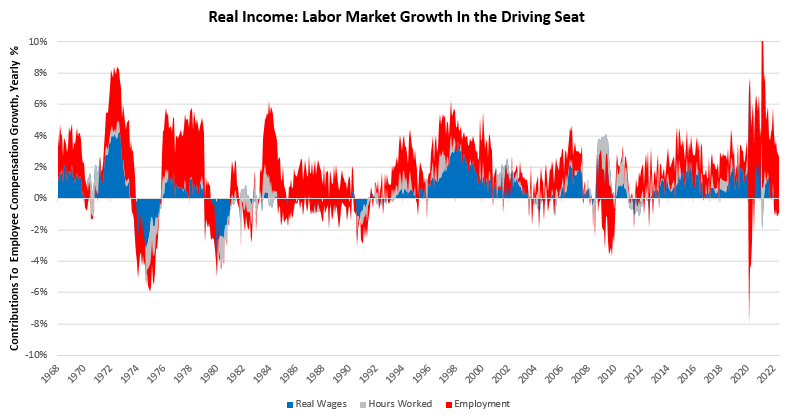
Labor incomes can be expanded by higher wages, more hours worked, or more employment. Above, we can see that the primary driver of real employee income today is the expansion of the labor force. Labor incomes can be expanded by higher wages, more hours worked, or more employment. However, the levels of employment today are stretched to historic highs, and we are beginning to see the initial phases of deterioration, which is captured in our proprietary labor impulse gauge:
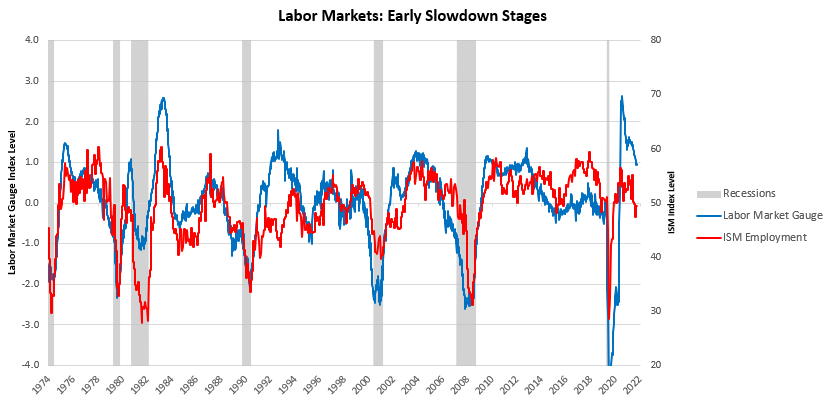
While indeed, the labor market remains tight on a secular basis, we think it is underappreciated how quickly a self-reinforcing labor and spending contraction can move:
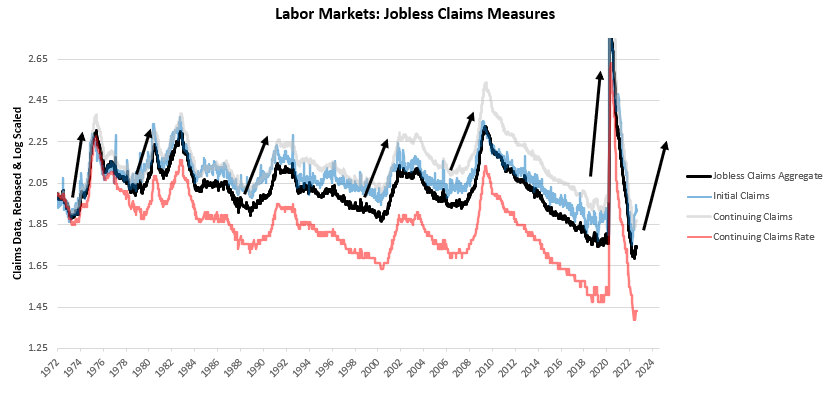
Above, we highlight periods of labor market weakening, which should be noted in the relatively short period over which unemployment spikes. Furthermore, these moves are extremely large- the average change in Jobless Claims across the board is 4 to 5 larger during recessionary periods than during expansions. The labor market moves faster than people expect, and this is because job losses create self-reinforcing pressure on production and spending. Taking this information into context, we will be watching this week’s non-farm payroll data carefully to see any deterioration in the growth rate of employment, & ADP data will help inform this picture as well. On the current trajectory, the pressure on real spending remains strong.
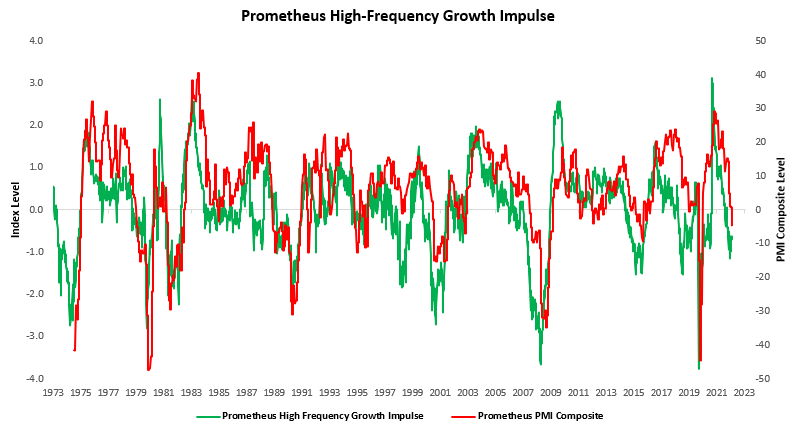
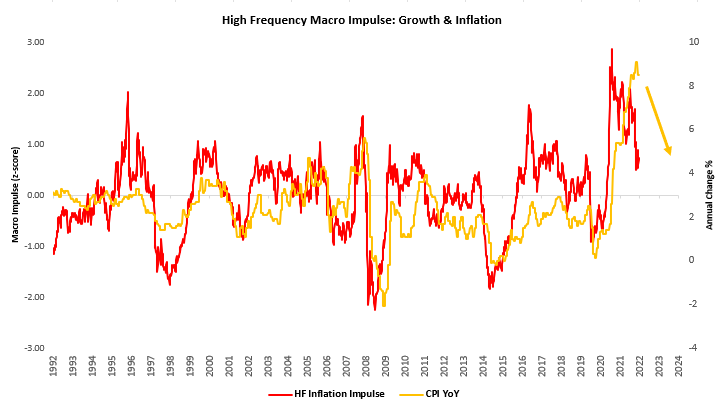
ii. PMI data is unlikely to slow its weakening. This coming week, markets are likely to anchor on ISM Manufacturing data, which our systems expect to deteriorate both on a cyclically & sequential basis. Cyclically, our proprietary high-frequency growth impulse indicator continues to paint a problematic environment for PMIs. Below, we show our high-frequency growth impulse versus our PMI Composite (which aggregates all US PMI data into one measure):
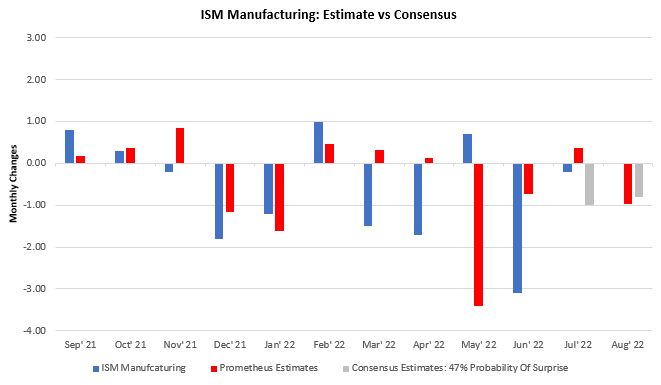
Furthermore, our systems estimate the ISM manufacturing data is likely to decelerate on a sequential basis, i.e., the data will come in below the prior level. Our estimates are roughly in line with consensus expectations, and therefore we do not expect any major surprises (though downside surprises would be welcome given our positioning):
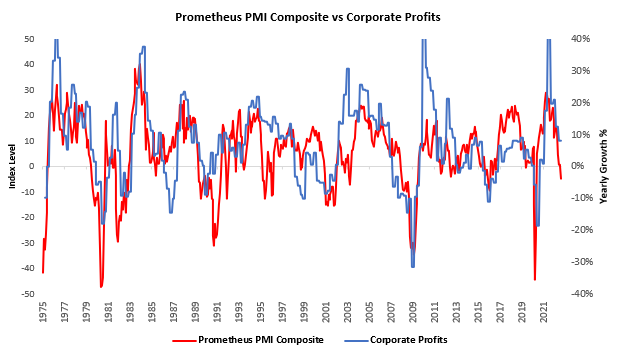
We estimate data prints not to trade them but rather to manage risks of existing positions. Given our outlook for PMIs, our outlook for corporate profitability further weakens, as PMIs have typically been suitable directional gauges of the profits cycle:
This increasing pressure on the profit cycle further pressures future employment; as the outlook for profitability deteriorates, the higher the likelihood that businesses begin to lay off workers. We wait and watch, but the pressures continue to build.
iii. The future of inflation will depend on the balance between the commodities impulse and the trend in shelter prices. The inflationary baton has now passed from goods to services, which typically exhibit much more memory (autocorrelation). This has created a dynamic where services inflation will likely form an undercurrent, keeping the inflation trend elevated relative to the Feds goals. The visualization below shows how both goods and services inflation has been displaying significant autocorrelation:
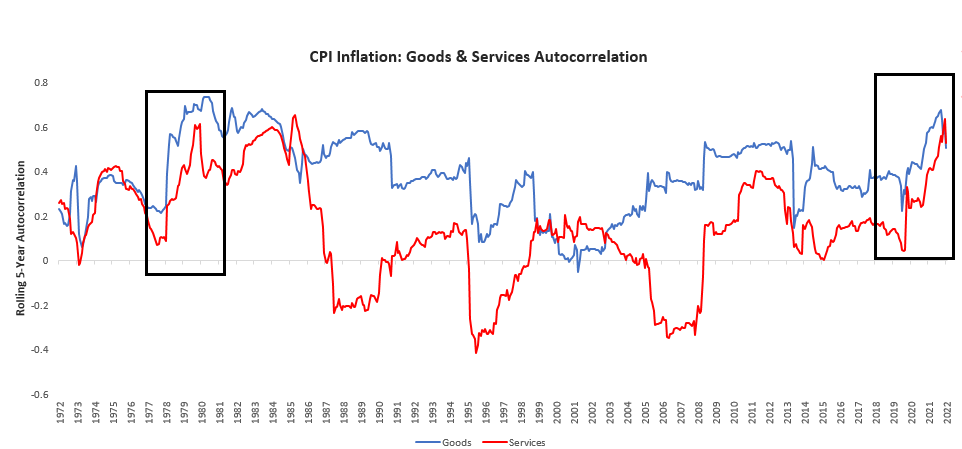
There is potential for these autocorrelations to move in opposing directions- goods & commodities lower, & services higher. The future trajectory of inflation, therefore, will be determined by the balance between these two factors. Our systems have been flagging that the declining goods impulse will overpower the underlying services trend, and our gauges have begun their descent:
We see these dynamics incrementally confirmed in the most recent PCE inflation print, with energy weighing on headline inflation significantly:
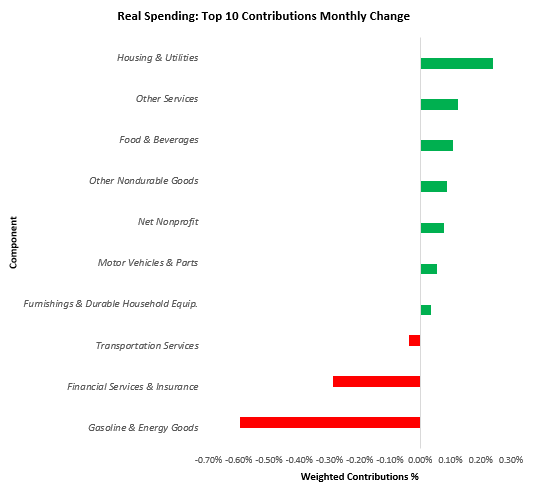
For further context, we show the most significant contributors to PCE Inflation over the last year:
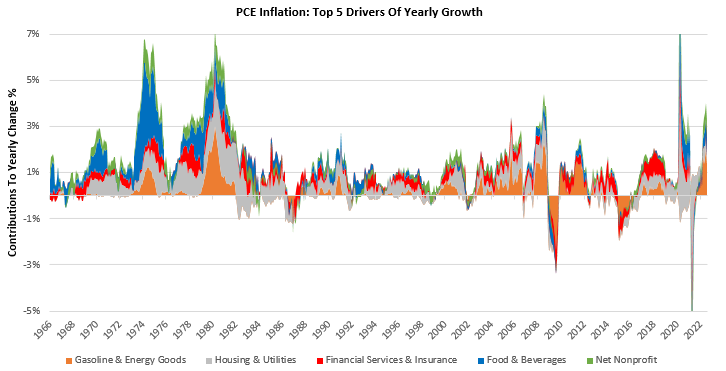
Over the last year, Food & Beverages (0.79%), Gasoline & Energy Goods (1.36%), Housing & Utilities (1.32%), Financial Services & Insurance (-0.98%), & Net Nonprofit (0.74%). have been the primary drivers of the 6.28% in PCE Inflation. Food & Beverages, & Energy remains highly exposed to changes in commodity prices, and deteriorating would mean significant change. However, our gauges remain a fair distance away from negative, and while a few weeks ago our market regime monitors suggested a potential turning point in markets to position into further deteriorating in the inflation impulse, dynamics look to have changed. As always, we look for our systems to guide us on positioning.
We are now net short equities & credit once again, alongside shorting treasuries. We pair this with inflation hedges and long-dollar positions, creating a portfolio that will likely benefit from stagflationary dynamics and tighter liquidity conditions. We will continue to provide updates as our signals evolve. Stay nimble.