
Welcome to The Observatory. The Observatory is how we at Prometheus monitor the evolution of both the economy and financial markets in real-time. Here are the top developments that stand out to us:
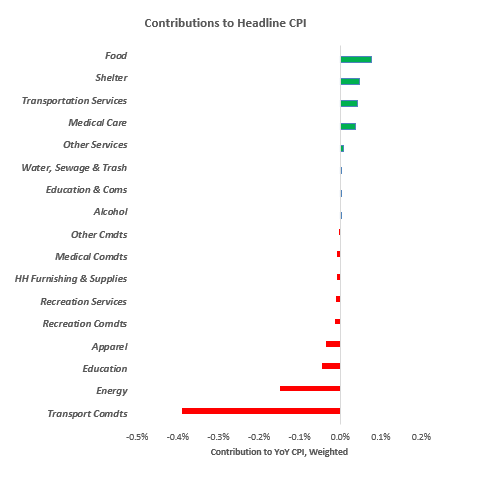
i. CPI decelerated on a YoY basis but surprised expectations to the upside. By our tracking, the pressures from energy abated; however, the price surges in food added significantly to the top line. These moves were telegraphed by our High-Frequency Inflation Impulse, which. We show the contribution to changes in the sequential change in YoY CPI:
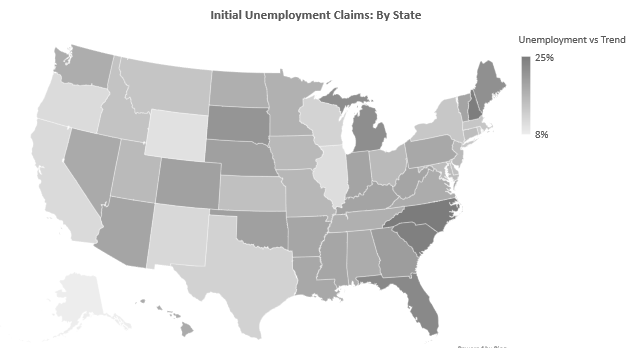
ii. Employment data continues to disappoint expectations. Initial claims data accelerated and surprised to the upside. Unemployment is broadly below trend. California showed the greatest increase in unemployment claims, while New York showed the greatest decrease.
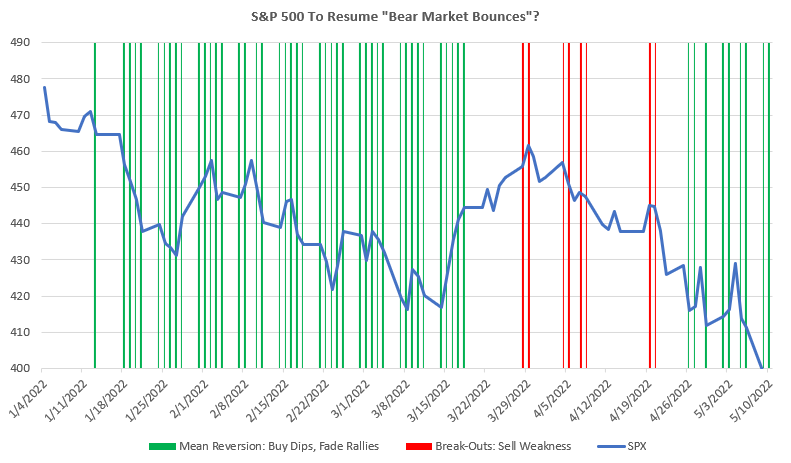
iii. Equity markets could see more “bear-market bounces.” Equities and Bonds have started to move inversely, per their decades-long norm. This dynamic is important because of the many strategies that nominally target allocation to stocks and bonds. When equities and bonds move in opposite directions, these strategies need to rebalance, creating mean-reversion tendencies in equities. While this isn’t the only factor that drives mean-reversion, it adds to the incremental evidence. Nonetheless, equities remain in a downtrend, which suggests there is an increasing likelihood of “bear market bounces” as opposed to the current consistent-crash dynamic. We show signals year-to-date for this phenomenon below:
Now let’s dive into what our systems are telling us:
Markets: Over the last month, markets have primarily priced (-) L. Nonetheless; our Market Regime Monitors tell us we are in a (+) G (+) I regime. Regime Risk is currently elevated, with the potential for a shift to (-) L. Regime Risk is currently elevated, with the potential for a shift to (-) L. In light of the current Regime Risk, the most regime resilient positions are LONG: MBS & 5 Year and SHORT: EURUSD & GBPUSD. Our Trend Monitors show that the strongest UP trends in markets are in Heating Oil & Natural Gas, and the strongest DOWN trends are in Silver & Communications. Strategically, our systems estimate that the best return/risk characteristics are LONG: Heating Oil & Gasoline and SHORT: Treasuries & Silver. Currently, the Prometheus Alpha Strategy show opportunities to go LONG: Consumer Staples, Lean Hogs, Copper. Our Beta Rotation Strategy is currently LONG: Commodities. A Market Regime Portfolio would be allocated to Stocks & Credit: 0%, Commodities: 53%, Treasuries & IG Debt: 0%, Gold & TIPS: 0%, Cash: 47.1%.
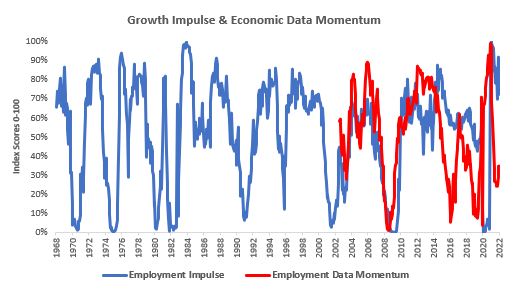
Macro: Our GDP Nowcast currently estimates GDP growth of 1.8%. Further, our GDP Nowcast currently shows a negative Growth Impulse, i.e. growth is below trend. Data has recently surprised to the downside, with Economic Data Momentum at 49.24%. Our Growth Impulse forecasts show growth accelerating but remaining below trend over the next 6 months. Our Inflation Impulse forecasts show inflation accelerating and remaining above trend over the next 6 months.
The future is dynamic, and our systems adjust as new information is available. Our bias is to allocate for the existing regime while trying to peek around the corner at what the future may hold. Finally, we optimize these views to minimize portfolio risk, resulting in our trading signals. We show all this in the pages that follow.
Market Regime Monitor
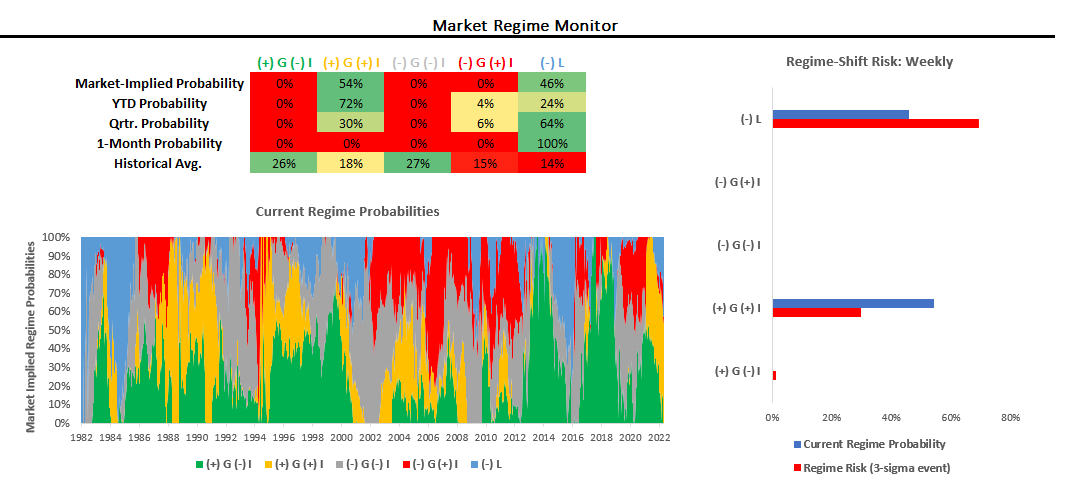
Using our understanding of asset markets, we can estimate the current market-implied regime in terms of growth, inflation, and liquidity:
(+) G (-) I: Rising Growth & Falling Inflation
(+) G (+) I: Rising Growth & Rising Inflation
(-) G (-) I: Falling Growth & Falling Inflation
(-) G (+) I: Falling Growth & Rising Inflation
(-) L: Tightening Liquidity
Markets price these macroeconomic regimes with varying probabilities. We show our estimates for the current market regime below:
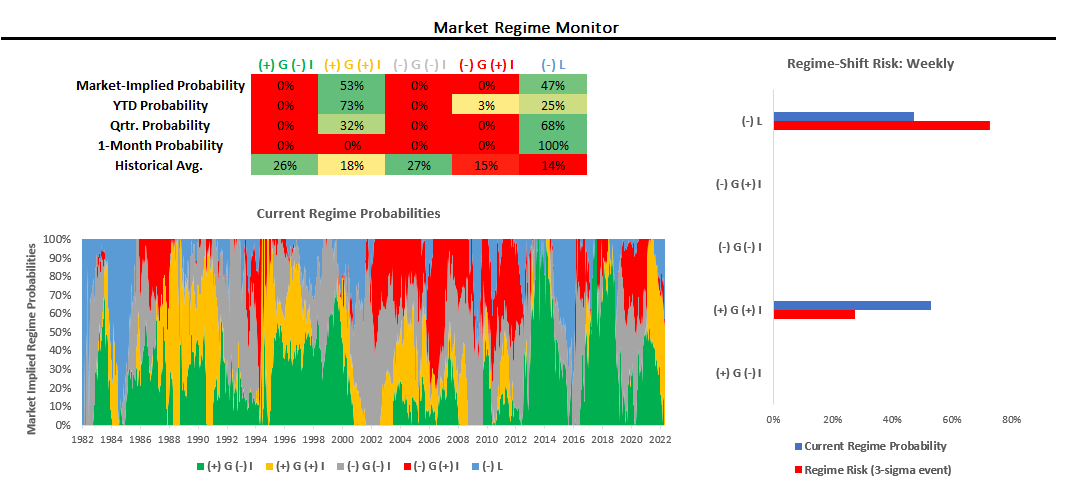
Over the last month, markets have primarily priced (-) L. Nonetheless; our Market Regime Monitors tell us we are in a (+) G (+) I regime. Regime Risk is currently elevated, with the potential for a shift to (-) L.
Position Monitor
Below, we show one of our daily Position Monitors, which estimates how cheap or expensive an asset is relative to its expected return, i.e., it is a risk management tool. Assets in the negative territory are ones to book gains in or short, and assets in the positive territory are ones to add to or enter.
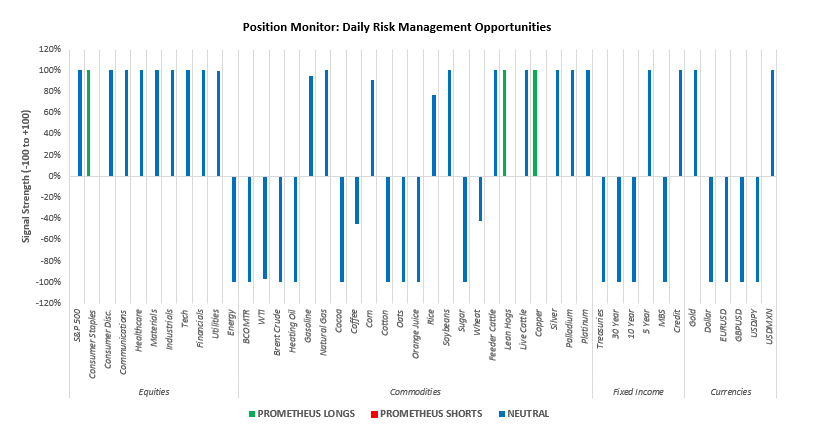
The Prometheus Alpha Strategy shows opportunities to go LONG: Consumer Staples, Lean Hogs, Copper. Our Beta Rotation Strategy is currently LONG: Commodities. A Market Regime Portfolio would be allocated to Stocks & Credit: 0%, Commodities: 53%, Treasuries & IG Debt: 0%, Gold & TIPS: 0%, Cash: 47.1%.
Prometheus Return/Risk Profiles
Using our understanding of market-implied regimes alongside portfolio construction principles, we can create a return-on-risk profile for various assets within a given market regime. We show the current regime’s full return/risk profile menu and the top Long & Short, candidates.
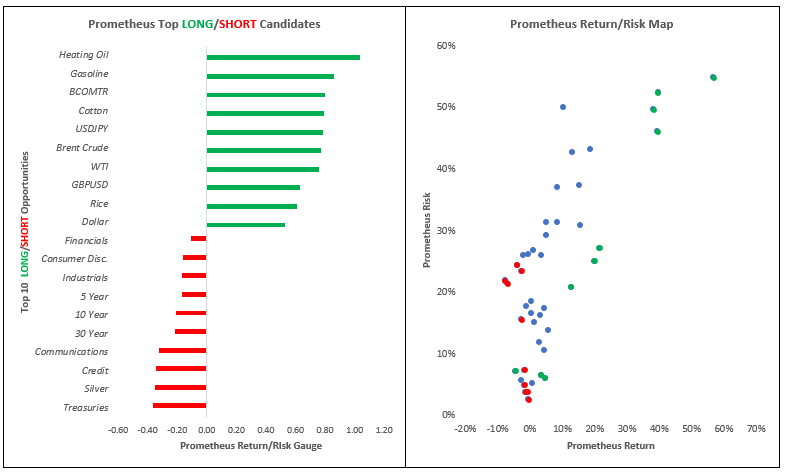
Strategically, our systems estimate that the best return/risk characteristics are LONG: Heating Oil & Gasoline and SHORT: Treasuries & Silver.
Regime Risk Management: Regime Resilience
While we know the current regime, we are always running the risk of the regime shifting to one that doesn’t support our current allocations. To assess this risk, we use cross-asset correlations to shock the current regime and evaluate the likelihood of a regime shift. Further, we then look at the resilience of assets, i.e., their tendency to perform in the event of a regime shift:
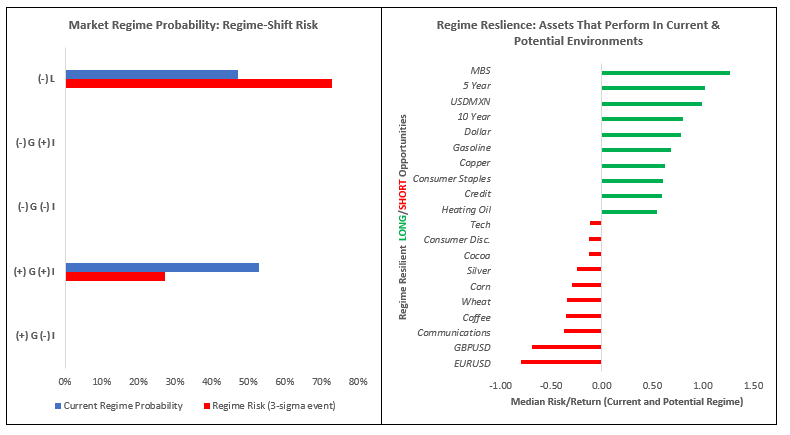
Regime Risk is currently elevated, with the potential for a shift to (-) L. In light of the current Regime Risk, the most regime resilient positions are LONG: MBS & 5 Year and SHORT: EURUSD & GBPUSD.
Trend Monitors: Top Trends, Upside & Downside
We also use trend models to augment our market regime signals to assess the degree of multi-duration momentum at the asset class and security level. This gauge allows us to evaluate the degree of trend persistence within a given asset, helping us benefit from solid trends and avoid weak ones. We highlight the top trends in markets today:
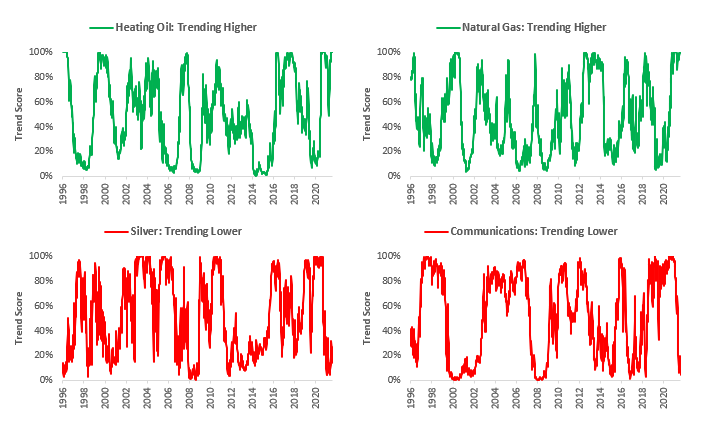
Our Trend Monitors show that the strongest UP trends in markets are in Heating Oil & Natural Gas, and the strongest DOWN trends are in Communications & Silver.
Economic Observatory: GDP Nowcast & Economic Data Momentum
Our economic nowcasting systems aggregate the accelerations and impulses in economic data. However, a significant component of the market’s reaction to economic data comes from the evolution of economic data relative to expectations. We standardize this measure to understand momentum in economic data relative to expectations:
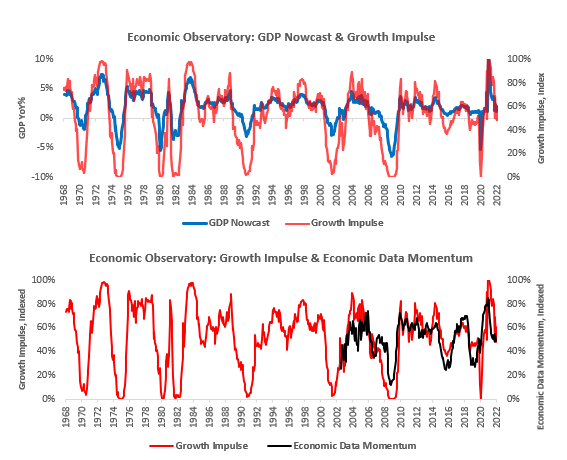
Our GDP Nowcast currently estimates GDP growth of 1.8%. Further, our GDP Nowcast currently shows a negative Growth Impulse, i.e. growth is below trend. Data has recently surprised to the downside, with Economic Data Momentum at 49.24%.
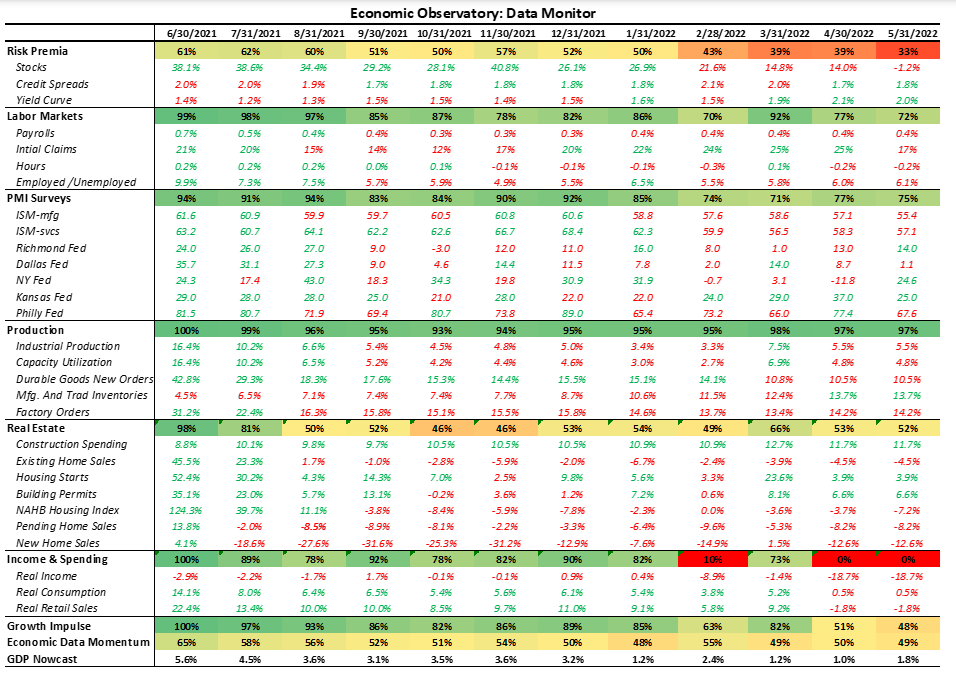
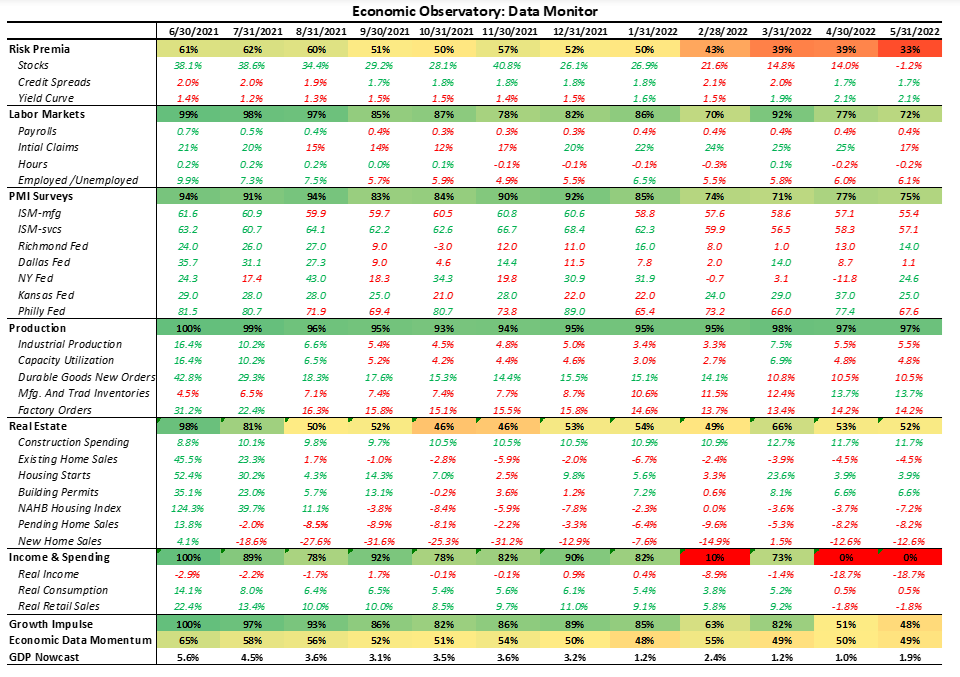
Here are some of the underlying data series. Please note that this includes estimates for the most recent months where data is unavailable:
Economic Observatory: Growth & Inflation Forecast Path
Our systematic forecasts for GDP use measures of cyclicality and trend to assess the probable path of Growth & Inflation over the next 6-12 months. We forecast growth and inflation relative to their cycle trends and display their index values, ranging from 0-to 100:
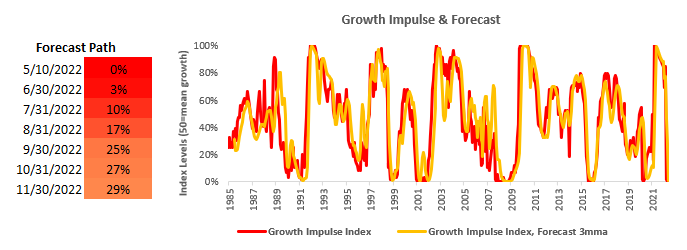
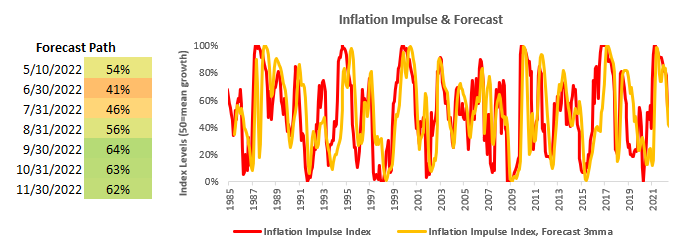
Our Growth Impulse forecasts show growth accelerating but remaining below trend over the next six months. Our Inflation Impulse forecasts show inflation accelerating and remaining above trend over the next six months.
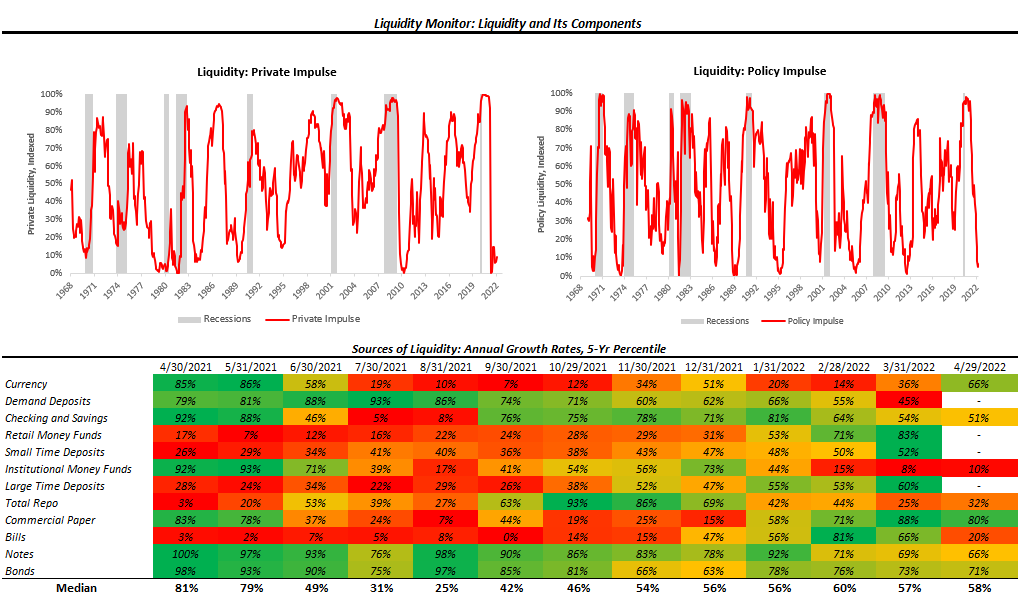
Economic Observatory: Liquidity Monitor
As shown previously, liquidity is a leading indicator of the economic cycle. Therefore, while we systematically forecast growth and inflation, the leading nature of liquidity precludes us from the need to forecast liquidity but rather keep a close eye on its evolution. To track the evolution of what is essentially economic and financial “dry-powder,” we have created our Liquidity Monitor, as shown below:
Additionally, we show our Policy Impulse measure as a leading indicator for the 3M-10YR yield curve:
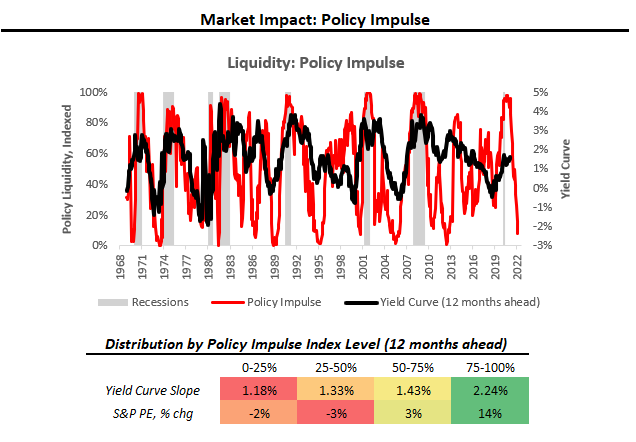
Our Liquidity Monitors show that Private & Public Sector Liquidity has deteriorated significantly, showing extremely weak readings. The pressure on yield curves to flatten, i.e., for policy rates to go higher alongside a flight to safety, remains high. We expect this dynamic to impact the real economy and financial markets further.
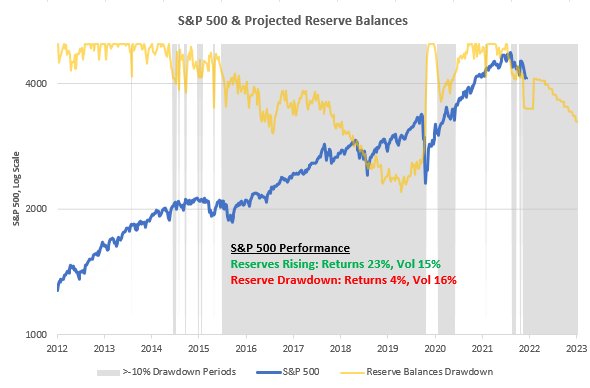
iii. We are heading into a challenging Liquidity environment, which means more volatility for less expected returns. Cash allocations should rise for long-only investors, and with the current inflation dynamics, even bonds will have a challenging period.
Now let’s dive into what our systems are telling us:
Markets: Over the last month, markets have primarily priced (-) L. Nonetheless, our Market Regime Monitors tell us we are in a (+) G (+) I regime. Regime Risk is currently elevated, with the potential for a shift to (-) L. Regime Risk is currently elevated with the potential for a shift to (-) L. In light of the current Regime Risk, the most regime resilient positions are LONG: MBS & 5 Year and SHORT: EURUSD & GBPUSD. Our Trend Monitors show that the strongest UP trends in markets are in Heating Oil & Natural Gas, and the strongest DOWN trends are in Communications & Silver. Strategically, our systems estimate that the best return/risk characteristics are LONG: Heating Oil & Gasoline and SHORT: Communications & Treasuries. The Prometheus Alpha Strategy is currently looking to enter LONG: Materials, Lean Hogs, Copper. Our Beta Rotation Strategy is currently LONG: Commodities. A Market Regime Portfolio would be allocated to Stocks & Credit: 0%, Commodities: 54.3%, Treasuries & IG Debt: 0%, Gold & TIPS: 0%, Cash: 45.8%.
Macro: Our GDP Nowcast currently estimates GDP growth of 1.86%. Further, our GDP Nowcast currently shows a negative Growth Impulse, i.e., growth is below trend. Data has recently surprised to the downside, with Economic Data Momentum at 49.24%. Our Growth Impulse forecasts show growth accelerating but remaining below trend over the next 6 months. Our Inflation Impulse forecasts show inflation accelerating and remaining above trend over the next 6 months.
The future is dynamic, and our systems adjust as new information is available. Our bias is to allocate for the existing regime while trying to peek around the corner at what the future may hold. Finally, we optimize these views to minimize portfolio risk, resulting in our trading signals. We show all this in the pages that follow.
Market Regime Monitor
Using our understanding of asset markets, we can estimate the current market-implied regime in terms of growth, inflation, and liquidity:
(+) G (-) I: Rising Growth & Falling Inflation
(+) G (+) I: Rising Growth & Rising Inflation
(-) G (-) I: Falling Growth & Falling Inflation
(-) G (+) I: Falling Growth & Rising Inflation
(-) L: Tightening Liquidity
Markets price these macroeconomic regimes with varying probabilities. We show our estimates for the current market regime below:
Over the last month, markets have primarily priced (-) L. Nonetheless; our Market Regime Monitors tell us we are in a (+) G (+) I regime. Regime Risk is currently elevated, with the potential for a shift to (-) L.
Position Monitor
Below, we show one of our daily Position Monitors, which estimates how cheap or expensive an asset is relative to its expected return, i.e., it is a risk management tool. Assets in the negative territory are ones to book gains in or short, and assets in the positive territory are ones to add to or enter.
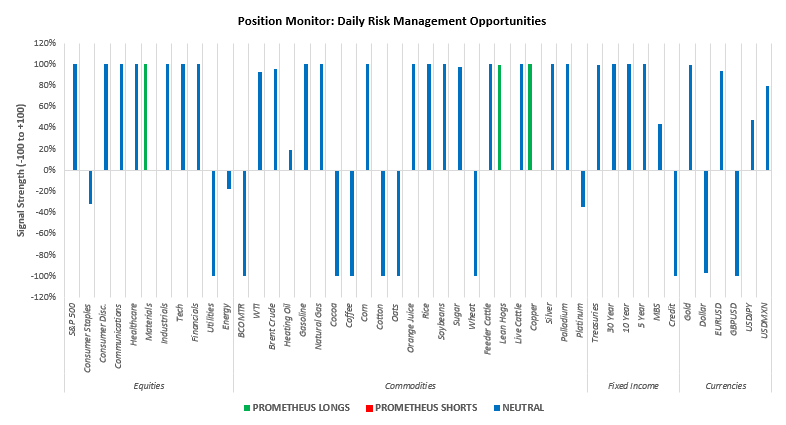
The Prometheus Alpha Strategy is looking to enter LONG: Materials, Lean Hogs, Copper. Our Beta Rotation Strategy is currently LONG: Commodities. A Market Regime Portfolio would be allocated to Stocks & Credit: 0%, Commodities: 54.3%, Treasuries & IG Debt: 0%, Gold & TIPS: 0%, Cash: 45.8%.
Prometheus Return/Risk Profiles
Using our understanding of market-implied regimes alongside portfolio construction principles, we can create a return-on-risk profile for various assets within a given market regime. We show the current regime’s full return/risk profile menu and the top Long & Short, candidates.
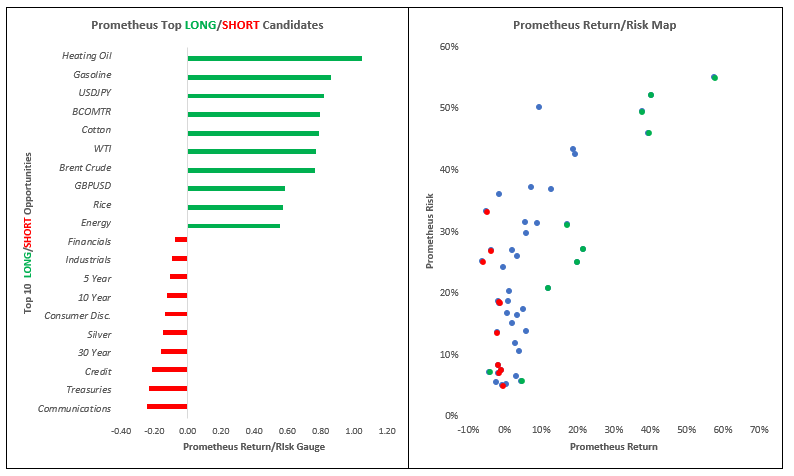
Strategically, our systems estimate that the best return/risk characteristics are LONG: Heating Oil & Gasoline and SHORT: Communications & Treasuries.
Regime Risk Management: Regime Resilience
While we know the current regime, we are always running the risk of the regime shifting to one that doesn’t support our current allocations. To assess this risk, we use cross-asset correlations to shock the current regime and evaluate the likelihood of a regime shift. Further, we then look at the resilience of assets, i.e., their tendency to perform in the event of a regime shift:
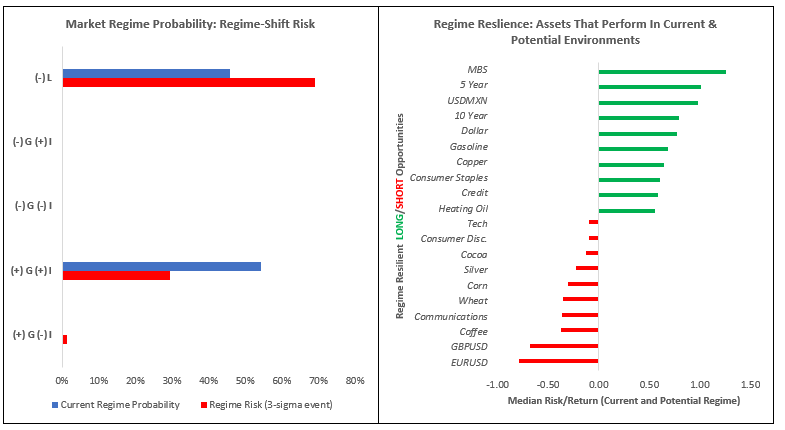
Regime Risk is currently elevated, with the potential for a shift to (-) L. In light of the current Regime Risk, the most regime resilient positions are LONG: MBS & 5 Year and SHORT: EURUSD & GBPUSD.
Trend Monitors: Top Trends, Upside & Downside
We also use trend models to augment our market regime signals to assess the degree of multi-duration momentum at the asset class and security level. This gauge allows us to evaluate the degree of trend persistence within a given asset, helping us benefit from solid trends and avoid weak ones. We highlight the top trends in markets today:
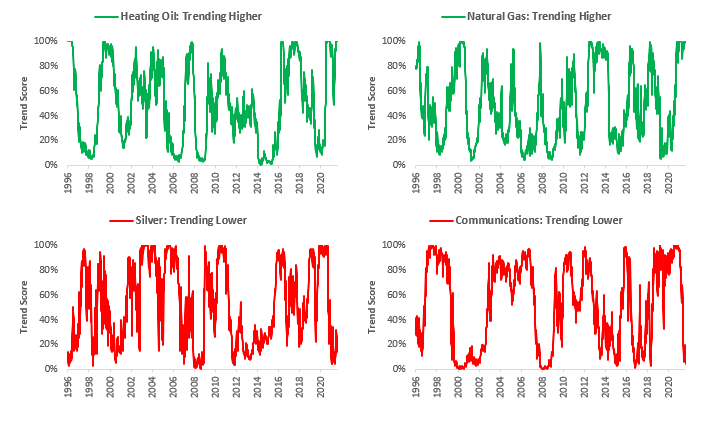
Our Trend Monitors show that the strongest UP trends in markets are in Heating Oil & Natural Gas, and the strongest DOWN trends are in Communications & Silver.
Economic Observatory: GDP Nowcast & Economic Data Momentum
Our economic nowcasting systems aggregate the accelerations and impulses in economic data. However, a significant component of the market’s reaction to economic data comes from the evolution of economic data relative to expectations. We standardize this measure to understand momentum in economic data relative to expectations:
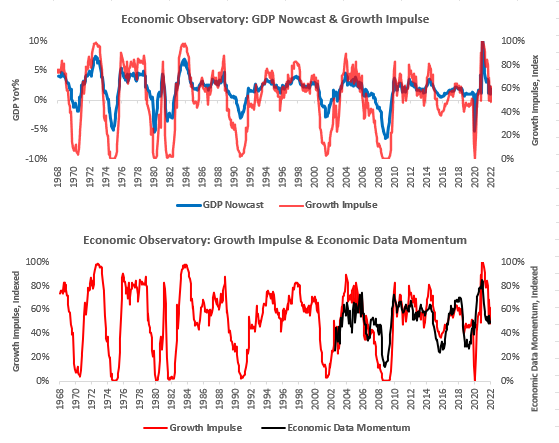
Our GDP Nowcast currently estimates GDP growth of 1.86%. Further, our GDP Nowcast currently shows a negative Growth Impulse, i.e. growth is below trend. Data has recently surprised to the downside, with Economic Data Momentum at 49.24%.
Here are some of the underlying data series. Please note that this includes estimates for the most recent months where data is unavailable:
Economic Observatory: Growth & Inflation Forecast Path
Our systematic forecasts for GDP use measures of cyclicality and trend to assess the probable path of Growth & Inflation over the next 6-12 months. We forecast growth and inflation relative to their cycle trends and display their index values, ranging from 0-to 100:
Our Growth Impulse forecasts show growth accelerating but remaining below trend over the next six months. Our Inflation Impulse forecasts show inflation accelerating and remaining above trend over the next six months.
Economic Observatory: Liquidity Monitor
As shown previously, liquidity is a leading indicator of the economic cycle. Therefore, while we systematically forecast growth and inflation, the leading nature of liquidity precludes us from the need to forecast liquidity but rather keep a close eye on its evolution. To track the evolution of what is essentially economic and financial “dry-powder,” we have created our Liquidity Monitor, as shown below:
Additionally, we show our Policy Impulse measure as a leading indicator for the 3M-10YR yield curve:
Our Liquidity Monitors show that Private & Public Sector Liquidity has deteriorated significantly, showing extremely weak readings. The pressure on yield curves to flatten, i.e., for policy rates to go higher alongside a flight to safety, remains high. We expect this dynamic to impact the real economy and financial markets further.