
Odds Of Contracting GDP + Stable Inflation Rise
Welcome to The Observatory. The Observatory is how we at Prometheus monitor the evolution of the economy and financial markets in real-time. The insights provided here are slivers of our research process that are integrated algorithmically into our systems to create rules-based portfolios.
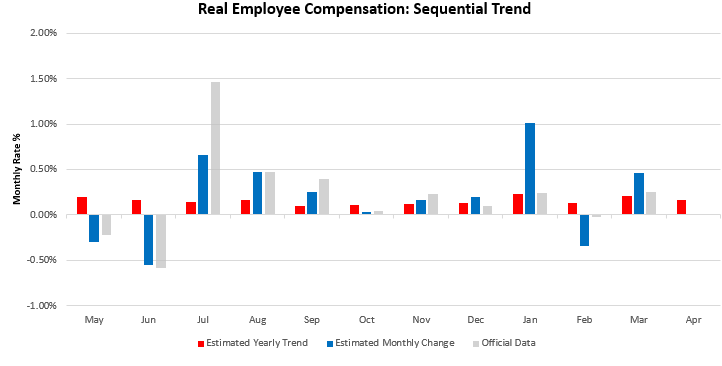
As we approach the end of the week, a picture of data for the month of April has begun to form one where inflation looks fairly resilient and likely to be the bulk of nominal growth. Said differently, data thus far this month has a stagflationary hue. Below, we show how our latest estimates for real employee compensation are now roughly at zero:
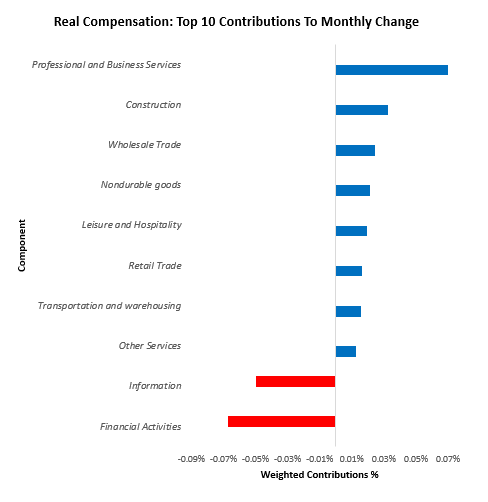
The primary drag on these estimates comes from financial and information services. We show the top 10 drivers below:
For further context, we show the composition of these nominal wages changes, broken into employment, real wages, hours worked, and inflation:
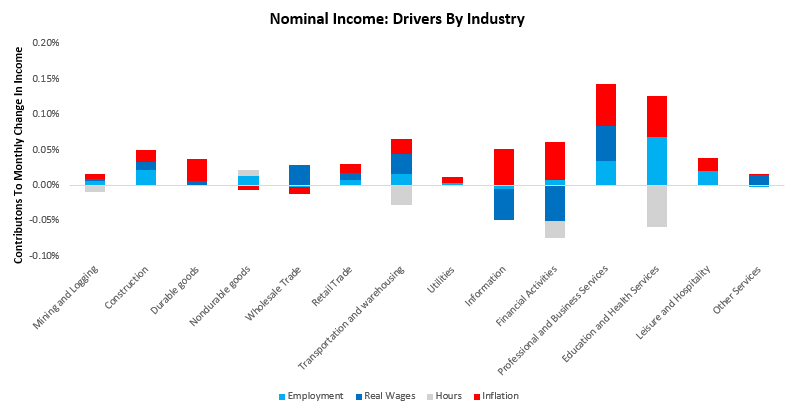
As we can see above, the inflation burden across sectors is significant, weighing on activity. This inflation, along with a decrease in hours across several sectors (transport, finance, information, education & health), has been a drag on real activity. Therefore, data thus far suggests weaker nominal incomes, with real output dragging and inflation holding stable. If true, this weaker income will likely flow through to weaker spending, and given heightened exposure of economic growth to consumer spending; there is potential for weakness in real GDP.
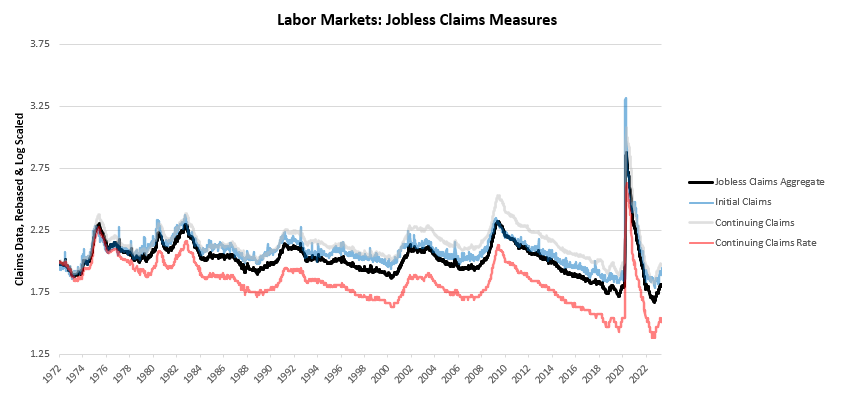
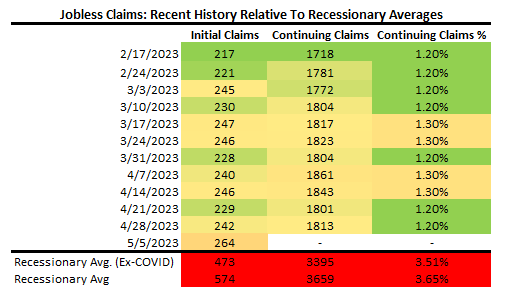
This weakness of growth comes alongside decelerating employment gains, which are a drag on total spending growth. We saw further evidence of slowing labor growth in increased jobless claims today. Initial Claims surprised expectations coming in at 264 versus the expected 245, while Continuing Claims disappointed expectations coming in at 1813 versus the expected 1820. Below, we show the history of these measures, along with the Continuing Claims Rate, after adjusting these measures to provide an apples to apple comparison. Additionally, we combine these measures into a Jobless Claims Aggregate to capture the broad trend in the data:
Additionally, we show the recent evolution of Jobless Claims Data over the last twelve weeks. Our tracking of Jobless Claims currently tells us that we are a ways off from recessionary territory, though slowly edging closer:
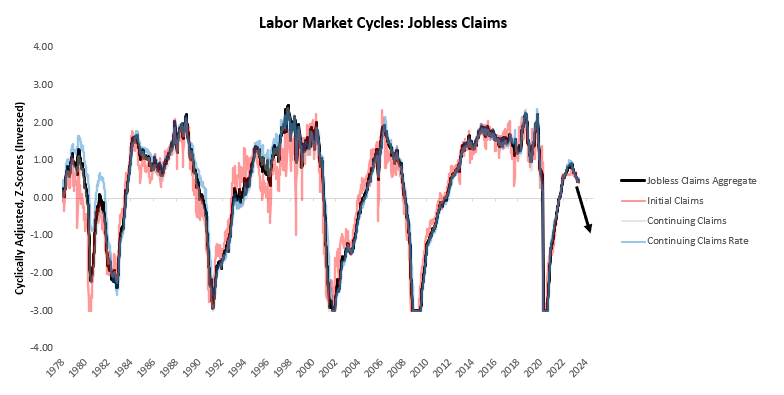
Finally, we show these Jobless Claims measures adjusted to show our position in the labor market cycle. We remain in expansionary territory, though the gains have begun to decline:
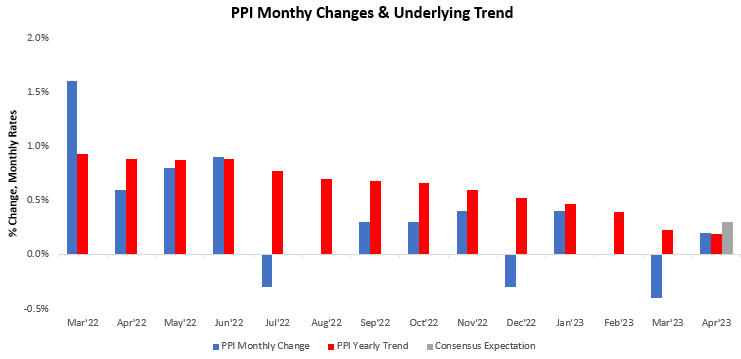
These developments imply stagflationary data in April; however, looking ahead, the latest PPI data suggest there may be modest disinflation to come. PPI data came in showing a monthly increase of 0.2%, leading to a 2.3% change versus a year ago, disappointing consensus expectations. This reading was a sequential deceleration within a decelerating trend 12-month trend. We show this sequential change below:
We show the composition of this print below:
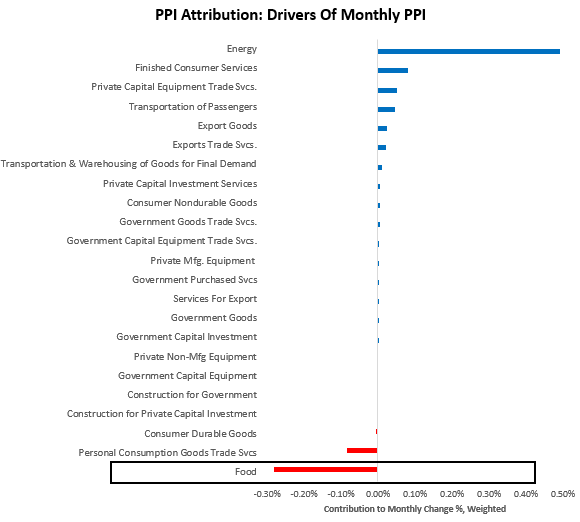
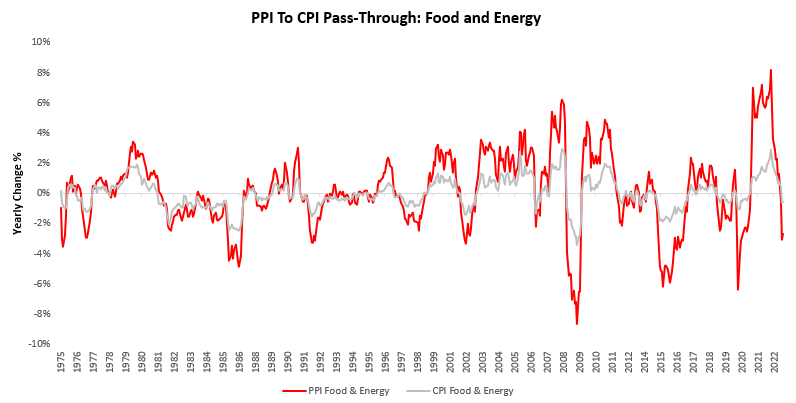
Of particular note, we have seen a sustained softening of food prices in PPI. PPI measures prices further up the supply chain than CPI, and consumers are usually the last to feel the impacts of raw material price changes as they work their way through the supply chain. Therefore, we think it is likely that PPI food price deflation will likely put further pressure on CPI food inflation. Below, we show how current PPI food and energy prices are likely to weigh on CPI:
Even with some additional food price deflation, elevated wage, transportation, and housing inflation will likely keep inflation more resilient than real output. We continue to be in a world of stagflationary nominal growth, but outright stagflation looks more likely now.