Welcome to The Observatory. The Observatory is how we at Prometheus monitor the evolution of the economy and financial markets in real-time. The insights provided here are slivers of our research process that are integrated algorithmically into our systems to create rules-based portfolios.
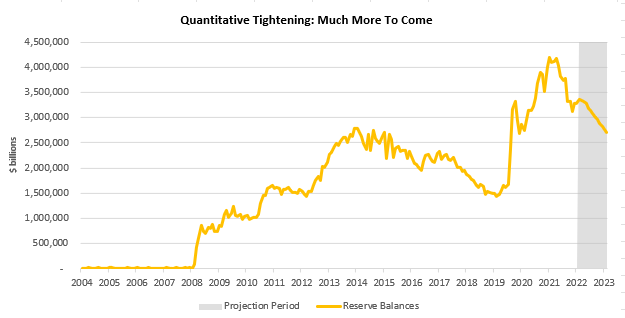
i. Liquidity conditions continue to weaken despite the brief slowdown in the pace of quantitative tightening. Yesterday, we showed the likely trajectory for reserve balances. We show this once again below for context:

Our forecasts take into account the pace of QT, the estimated path of the Treasury & the ensuing level of reverse repo usage. As we can see above, the likely path for reserve balances is much lower. The level of reserve balances is critical to the financial systems; all else equal, a heightened level of reserve balances reduces the cost of capital to the private sector. This reduction comes from the decrease in the maturity profile of liabilities of the government, i.e., there are more liquid assets. The US Sovereign (monetary + fiscal authorities) is the primary creator of liquidity in the economy, and both monetary and fiscal bodies are contracting liquidity:
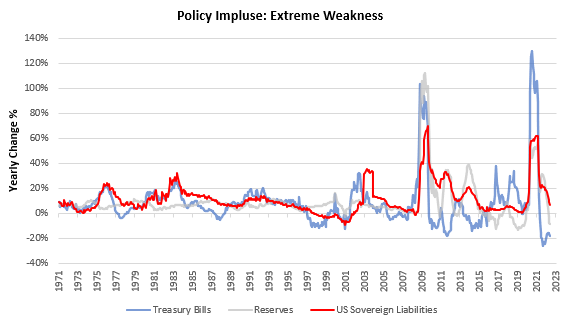
US Sovereign liabilities (netted for intergovernmental holdings) are the most liquid store of cash for the private sector, and they are fast shrinking. We aggregate this data and other liquidity-related data into our Liquidity Impulse Index, and we show this below:
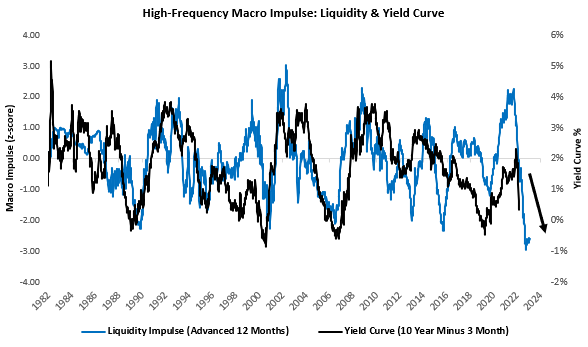
Our liquidity gauges have been reliable measures in estimating the likely direction of yield curves and the monetary cycle. They continue to signal that we are in a challenging environment for risk assets, and capital protection is of the utmost importance.
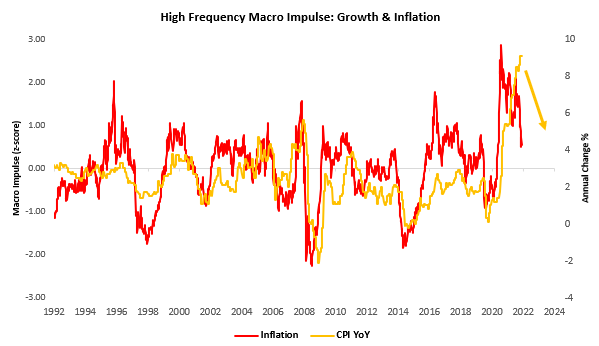
ii. Our systems continue to flag the likelihood of an inflation slowdown. Below, we show one of our inflation gauges focusing on inflation signals coming from asset markets. This gauge has typically been tightly correlated with changes in inflation acceleration (the change in change) in CPI:
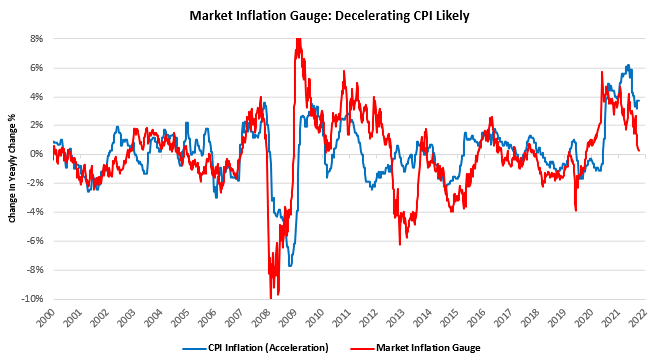
While this gauge isn’t useful for tellings us where the next CPI print will be, it does indicate which direction the pressures are in, and they are mounting. Our high-frequency inflation gauge paints a similar picture:
iii. Our PMI Composite is now at recessionary levels. While our GDP nowcast remains elevated due to the tightness in labor markets, our PMI Composite is now consistent with levels where the US economy has typically gone into recession:
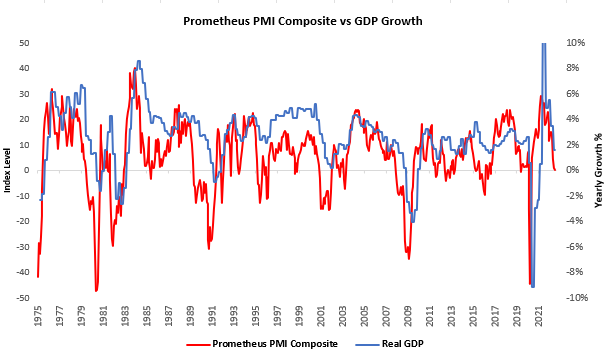
However, this relationship is far from perfect, and a weaker PMI composite does not necessitate a recession. However, it further adds to the case that the economic slowdown remains intact and well underway.
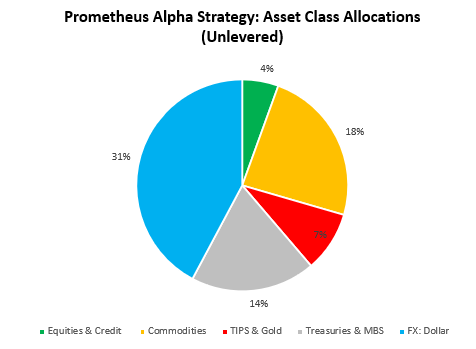
Our systems combine the underlying principles in our analysis into rules-based portfolio construction and continue to tell us to remain defensive in our exposures after being aggressively short equities & credit. Our systems estimate that the worst of the inflation shock is behind us. These dynamics create an environment where generating alpha via equity shorts becomes more challenging, but bond beta becomes easier to harvest. Resultantly, our systems are now significantly allocated to deflationary & tightening liquidity assets (Treasuries, MBS, Dollar, & Cash). However, our risk mitigation signals have also moved us towards marginally higher exposure to commodities. We show our Alpha Strategy asset class allocations below:
Stay nimble.
Super-Duper blog! I am loving it! Will come back again. I am taking your feeds also.