
Welcome to The Observatory. The Observatory is how we at Prometheus monitor the evolution of both the economy and financial markets in real-time. Here are the top developments that stand out to us:
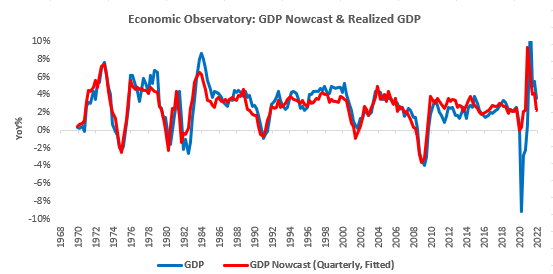
- Markets Q1 GDP data contracted on a QoQ basis and slowed on a YoY basis. Data disappointed expectations majorly, and according to our cyclical estimates Q2 will be worse:
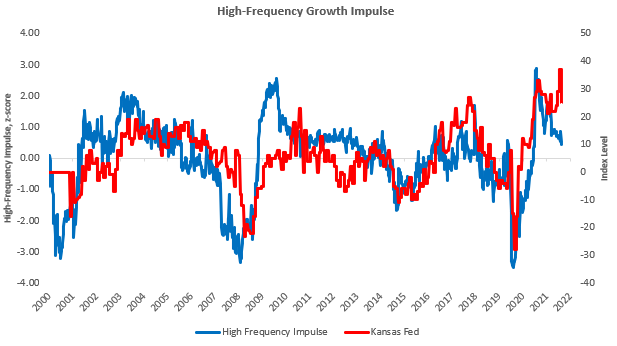
- Kansas Fed Manufacturing Survey showed a deceleration versus the previous print. Nonetheless, index levels remain elevated:
Now let’s dive into what our systems are telling us:
- Markets: Over the last month, markets have primarily priced (-) L. Nonetheless; our Market Regime Monitors tell us we are in a (+) G (+) I regime. Regime Risk is currently elevated, with the potential for a shift to (-) L. Regime Risk is currently elevated, with the potential for a shift to (-) L. In light of the current Regime Risk, the most regime resilient positions are LONG: MBS & 5 Year and SHORT: EURUSD & GBPUSD. Our Trend Monitors show that the strongest UP trends in markets are in Heating Oil & Brent Crude, and the strongest DOWN trends are in Platinum & Silver. Strategically, our systems estimate that the best return/risk characteristics are LONG: Heating Oil & USDJPY and SHORT: Communications & Treasuries. Currently, the Prometheus Alpha Strategy is LONG: S&P 500, Healthcare, Tech, Copper, Gold. Our Beta Rotation Strategy is currently LONG: Commodities. A Market Regime Portfolio would be allocated to Stocks: 4.8%, Commodities: 53.1%, Treasuries: 0%, Gold & TIPS: 5%, Cash: 37.3%.
- Macro: Our GDP Nowcast currently estimates GDP growth of 2.09%. Further, our GDP Nowcast currently shows a positive Growth Impulse, i.e. growth is above trend. Data has recently surprised to the downside, with Economic Data Momentum at 49.42%. Our Growth Impulse forecasts show growth accelerating but remaining below trend over the next six months. Our Inflation Impulse forecasts show inflation decelerating but remaining above trend over the next six months. Our Liquidity Monitors show that Private & Public Sector Liquidity has deteriorated significantly, showing extremely weak readings. These weak readings usually presage flatter yield curves (10YR minus 3M). Therefore, our liquidity measures indicate that the current sell-off in long-dated Treasuries is likely unsustainable.
The future is dynamic, and our systems adjust as new information is available. Our bias is to allocate for the existing regime while trying to peek around the corner at what the future may hold. Finally, we optimize these views to minimize portfolio risk, resulting in our trading signals. We show all this in the pages that follow.
Market Regime Monitor
Using our understanding of asset markets, we can estimate the current market-implied regime in terms of growth, inflation, and liquidity:
- (+) G (-) I: Rising Growth & Falling Inflation
- (+) G (+) I: Rising Growth & Rising Inflation
- (-) G (-) I: Falling Growth & Falling Inflation
- (-) G (+) I: Falling Growth & Rising Inflation
- (-) L: Tightening Liquidity
Markets price these macroeconomic regimes with varying probabilities. We show our estimates for the current market regime below:
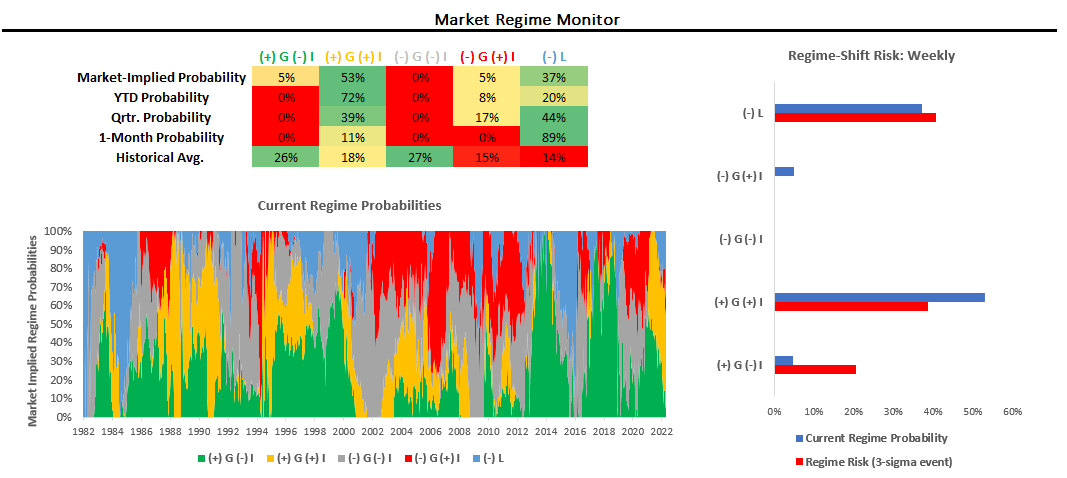
Over the last month, markets have primarily priced (-) L. Nonetheless; our Market Regime Monitors tell us we are in a (+) G (+) I regime. Regime Risk is currently elevated, with the potential for a shift to (-) L.
Position Monitor
Below, we show one of our daily Position Monitors, which estimates how cheap or expensive an asset is relative to its expected return, i.e., it is a risk management tool. Assets in the negative territory are ones to book gains in or short, and assets in the positive territory are ones to add to or enter.
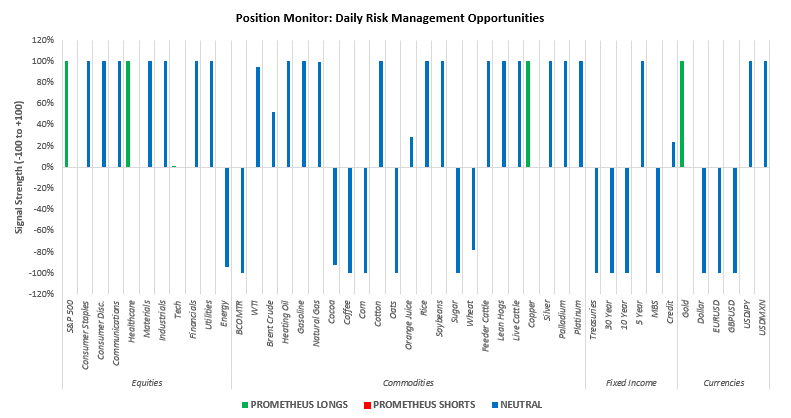
Currently, the Prometheus Alpha Strategy is LONG: S&P 500, Healthcare, Tech, Copper, Gold. Our Beta Rotation Strategy is currently LONG: Commodities. A Market Regime Portfolio would be allocated to Stocks: 4.8%, Commodities: 53.1%, Treasuries: 0%, Gold & TIPS: 5%, Cash: 37.3%.
Prometheus Return/Risk Profiles
Using our understanding of market-implied regimes alongside portfolio construction principles, we can create a return-on-risk profile for various assets within a given market regime. We show the current regime’s full return/risk profile menu and the top Long & Short, candidates.
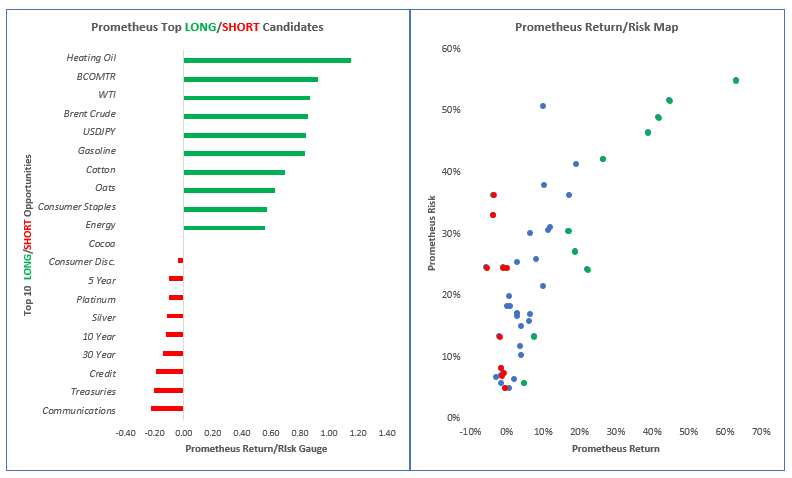
Strategically, our systems estimate that the best return/risk characteristics are LONG: Heating Oil & BCOMTR and SHORT: Communications & Treasuries.
Regime Risk Management: Regime Resilience
While we know the current regime, we are always running the risk of the regime shifting to one that doesn’t support our current allocations. To assess this risk, we use cross-asset correlations to shock the current regime and evaluate the likelihood of a regime shift. Further, we then look at the resilience of assets, i.e., their tendency to perform in the event of a regime shift:
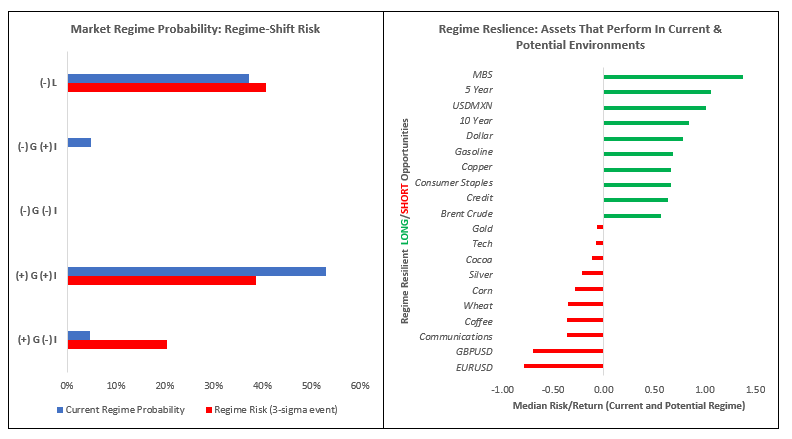
Regime Risk is currently elevated, with the potential for a shift to (-) L. In light of the current Regime Risk, the most regime resilient positions are LONG: MBS & 5 Year and SHORT: EURUSD & GBPUSD.
Trend Monitors: Top Trends, Upside & Downside
We also use trend models to augment our market regime signals to assess the degree of multi-duration momentum at the asset class and security level. This gauge allows us to evaluate the degree of trend persistence within a given asset, helping us benefit from solid trends and avoid weak ones. We highlight the top trends in markets today:
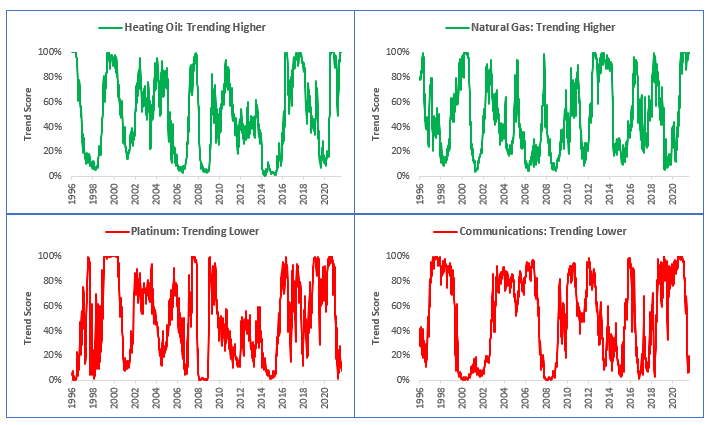
Our Trend Monitors show that the strongest UP trends in markets are in Heating Oil & Natural Gas, and the strongest DOWN trends are in Platinum & Communications.
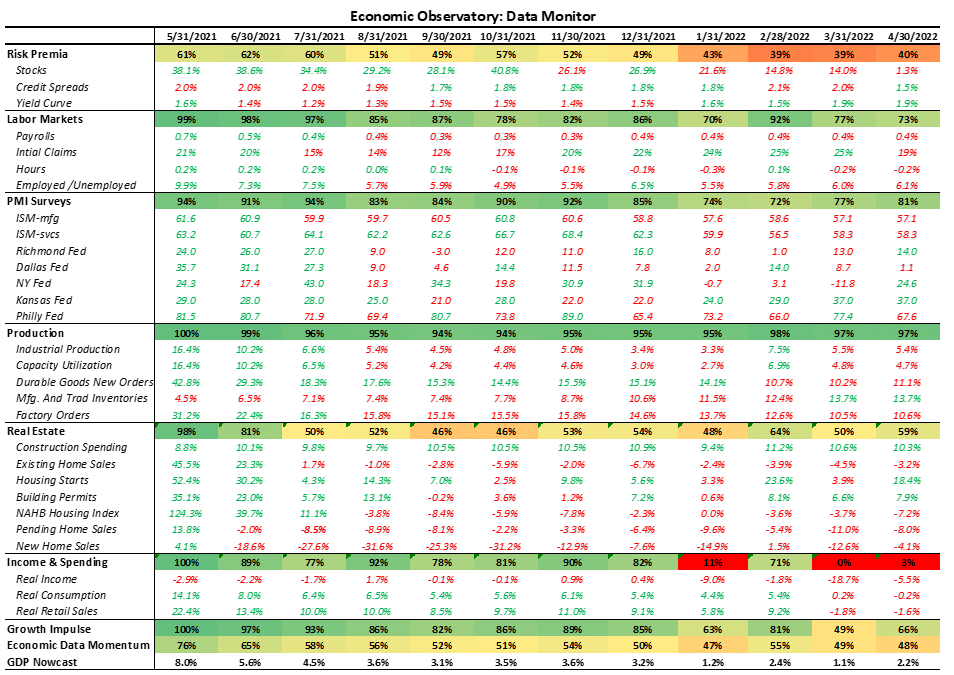
Economic Observatory: GDP Nowcast & Economic Data Momentum
Our economic nowcasting systems aggregate the accelerations and impulses in economic data. However, a significant component of the market’s reaction to economic data comes from the evolution of economic data relative to expectations. We standardize this measure to understand momentum in economic data relative to expectations:
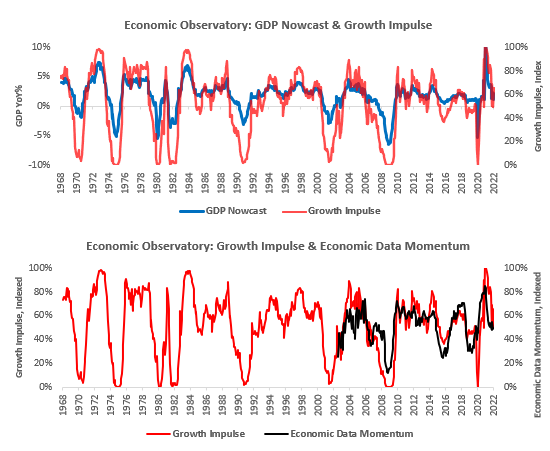
Our GDP Nowcast currently estimates GDP growth of 2.09%. Further, our GDP Nowcast currently shows a positive Growth Impulse, i.e. growth is above trend. Data has recently surprised to the downside, with Economic Data Momentum at 49.42%.
Here are some of the underlying data series. Please note that this includes estimates for the most recent months where data is unavailable:
Economic Observatory: Growth & Inflation Forecast Path
Our systematic forecasts for GDP use measures of cyclicality and trend to assess the probable path of Growth & Inflation over the next 6-12 months. We forecast growth and inflation relative to their cycle trends and display their index values, ranging from 0-to 100:
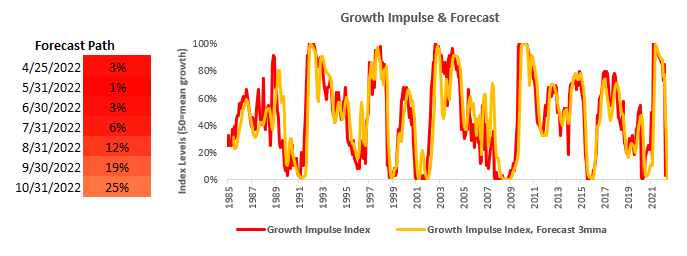
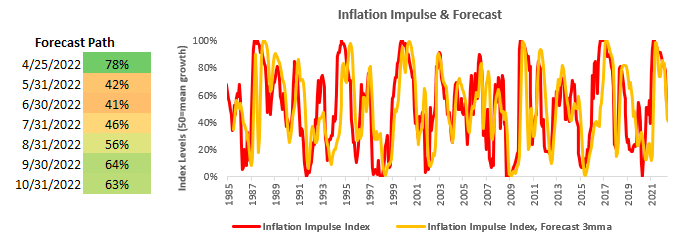
Our Growth Impulse forecasts show growth accelerating but remaining below trend over the next six months. Our Inflation Impulse forecasts show inflation decelerating but remaining above trend over the next six months.
Economic Observatory: Liquidity Monitor
As shown previously, liquidity is a leading indicator of the economic cycle. Therefore, while we systematically forecast growth and inflation, the leading nature of liquidity precludes us from the need to forecast liquidity but rather keep a close eye on its evolution. To track the evolution of what is essentially economic and financial “dry-powder,” we have created our Liquidity Monitor, as shown below:
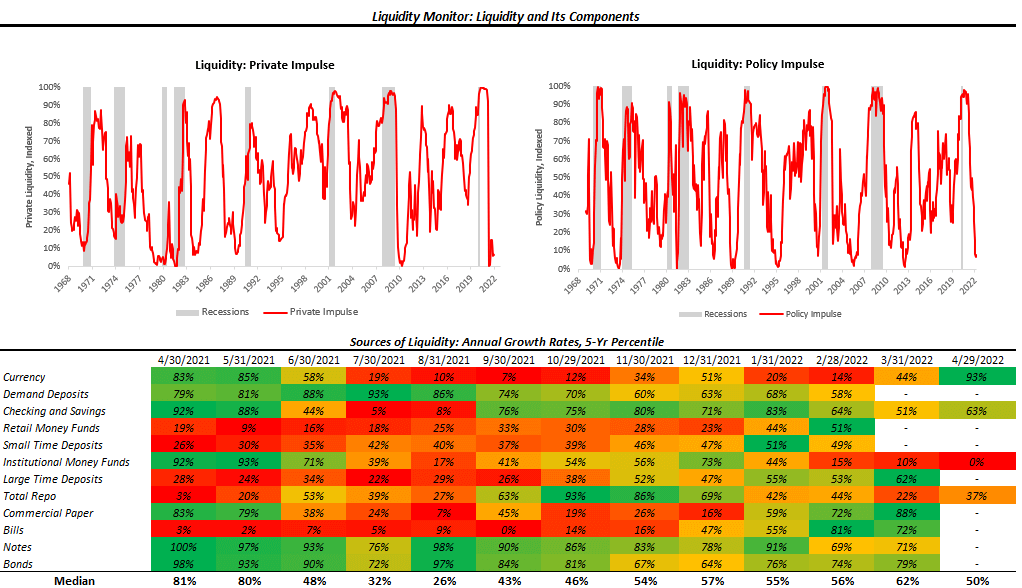
Additionally, we show our Policy Impulse measure as a leading indicator for the 3M-10YR yield curve:
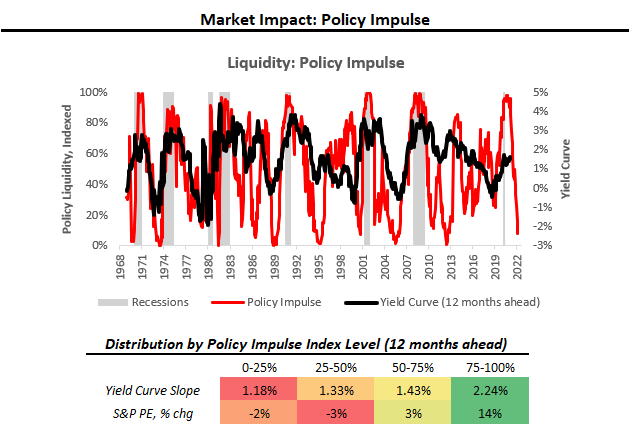
Our Liquidity Monitors show that Private & Public Sector Liquidity has deteriorated significantly, showing extremely weak readings. These weak readings usually presage flatter yield curves (10YR minus 3M). Therefore, our liquidity measures indicate that the current sell-off in long-dated Treasuries is likely unsustainable.
Hey! Do you know if they make any plugins to help with Search Engine Optimization? I’m trying to get my website to rank for some
targeted keywords but I’m not seeing very good results.
If you know of any please share. Kudos! I saw similar art here: Eco wool
Hi! Do you know if they make any plugins to help with SEO?
I’m trying to get my website to rank for some targeted
keywords but I’m not seeing very good success. If you know of any please
share. Many thanks! I saw similar article here: Change your life
I am really inspired along with your writing skills and also with
the structure to your blog. Is that this a paid topic or did
you modify it yourself? Either way stay up the nice quality writing, it’s uncommon to peer a great weblog like this
one these days. Beehiiv!
I’m really impressed with your writing abilities and also with the structure for your blog.
Is this a paid theme or did you modify it yourself? Anyway stay
up the excellent quality writing, it’s uncommon to peer a great blog like this
one nowadays. TikTok Algorithm!
I am extremely impressed with your writing skills and also with the layout on your weblog.
Is this a paid subject or did you customize it your self?
Either way stay up the nice quality writing, it’s uncommon to look a great weblog like this
one these days. HeyGen!