Examining The Household Sector
Welcome to The Observatory. The Observatory is how we at Prometheus monitor the evolution of the economy and financial markets in real-time. The insights provided here are slivers of our research process that are integrated algorithmically into our systems to create rules-based portfolios.
Today, we examine the latest available data on the state of households and the personal sector to understand the status of the consumer. In April, households saw incomes increase as employment and inflation contributed to nominal incomes. Alongside this increase in employment income, we also saw continued support from income on assets total incomes. This increased income was spent on the economy, with motor vehicles seeing strong nominal and real spending. This increase in spending was a drag on savings, which came alongside a decrease in mortgage borrowing, dragging on total borrowing. However, durable goods spending, home prices, and equity market prices came together to create an increase in assets, increasing household net worth. Overall, the consumer remains supported by a strong labor market and elevated income on assets.
Below, we begin by showing the composition of personal income gains this month.
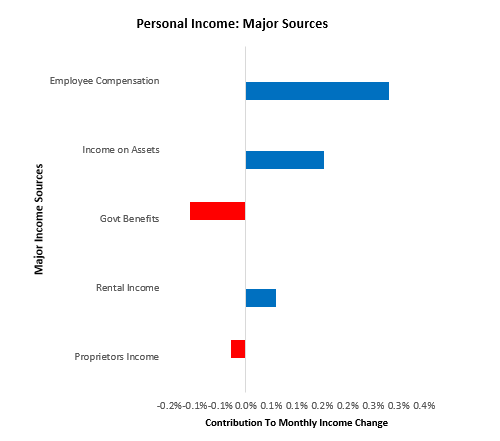
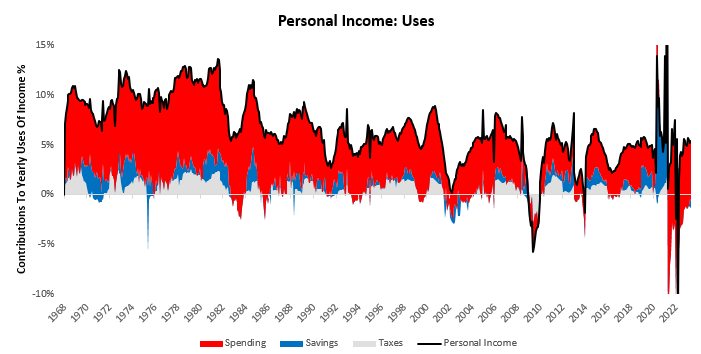
Personal income increased by 0.36% in April, disappointing consensus expectations of 0.4%. This print contributed to a sequential deceleration in the quarterly trend relative to the yearly trend. The primary drivers of this print were Employee Compensation (0.6%) & Income on Assets (0.25%). Over the last year, Employee Compensation (3.36%), Rental Income (0.5%), & Income on Assets (0.96%). have been the primary sources of the 5.43% growth in income.
We zoom into employee compensation to show the industry-wise breakdown of this increase in income. Further, we break these gains down into their macroeconomic drivers, i.e., employment, real wages, hours worked, and inflation. We show these ranked from lowest (left) to highest (right):
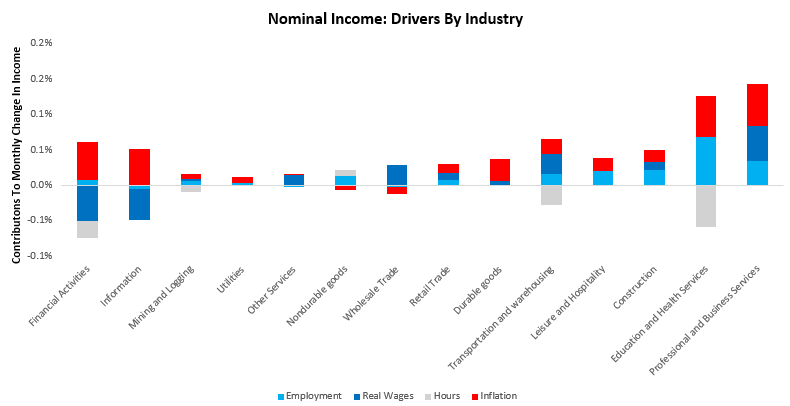
As we can see above, professional and business services continue to be the bastion of the current resilience of the consumer economy. On the other end of the spectrum, financial activities continue to see weakness, especially ex-inflation. It is important to recognize that real incomes this month were weak. Our estimates indicated a -0.10% contraction; official data came up 0.10%. We show the sequential evolution of the data below:
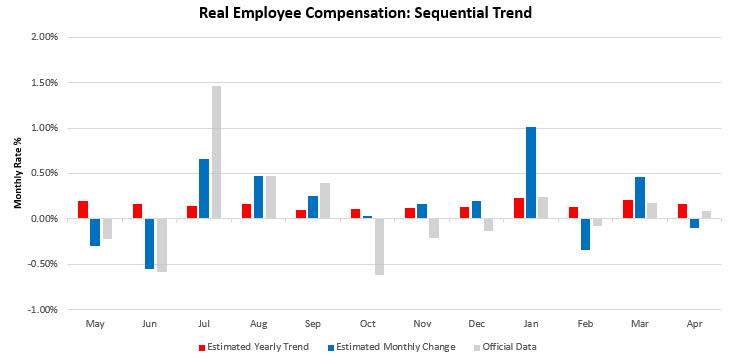
We zoom out to offer more context:
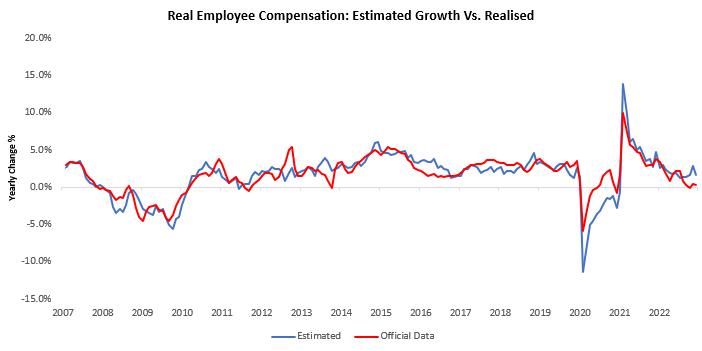
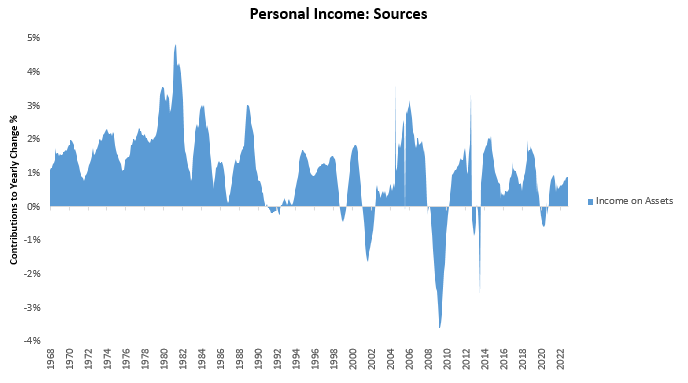
Next, as previously alluded to, we show how income on assets continues to contribute to income growth, now contributing 1% of the total 5% growth in nominal income:
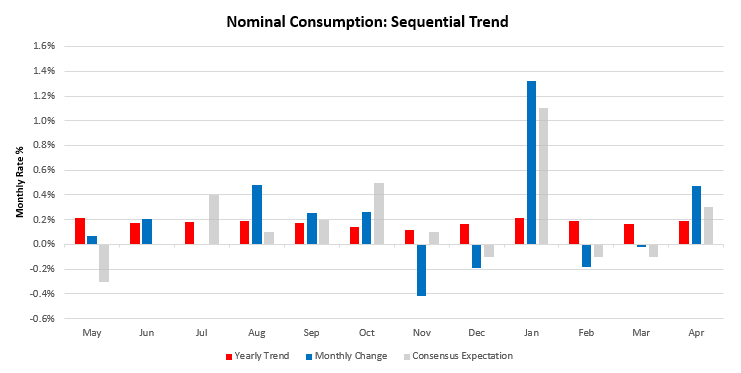
These income gains translate into spending gains. Nominal consumer spending increased 0.84% in April, surprising consensus expectations of 0.3%. This print contributed to a sequential deceleration in the quarterly trend relative to the yearly trend. Below, we show the monthly evolution of the data relative to its 12-monthly trend and consensus expectations:
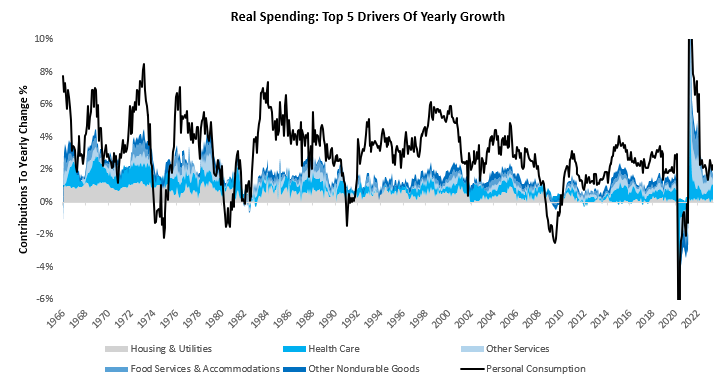
We zoom out to show the drivers of current trends in spending. Over the last year, Other Nondurable Goods (0.63%), Housing & Utilities (1.49%), Health Care (1.39%), Food Services & Accommodations (0.65%), & Other Services (0.88%). have been the primary drivers of the 6.73% growth in spending. We show the contributions of these items to yearly changes in total spending below.
This nominal spending of nominal income continues a trend that has been in place since last year, i.e., one of declining sustained savings reductions:
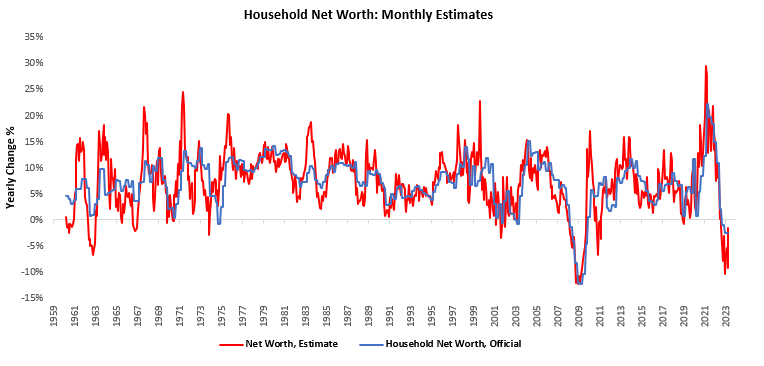
While savings decreased, household net worth increased. According to our latest estimates for the month of April, household net worth increased by 2.9%, driven by a 2.81% and -0.08% change in assets & liabilities, respectively. We show the evolution of our household net worth estimates below, which show that net worth has contracted -0.97% over the last year:
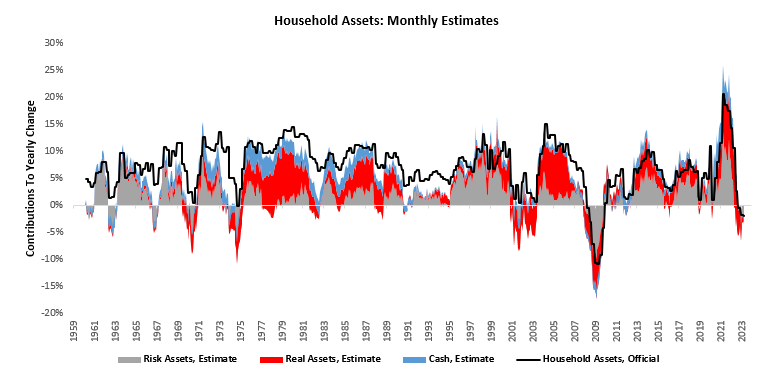
Over the last year, household assets have fallen by -0.97%. Below, we decompose these changes in assets into risk assets (equities, corporate credit, etc.), real assets (real estate, consumer durables, etc.), and cash assets (checking, savings, money markets funds, etc.). Risk assets, real assets, and cash assets have contributed 0.29%, -0.36%, and-0.9%, respectively, to the total change in household assets over the last year:
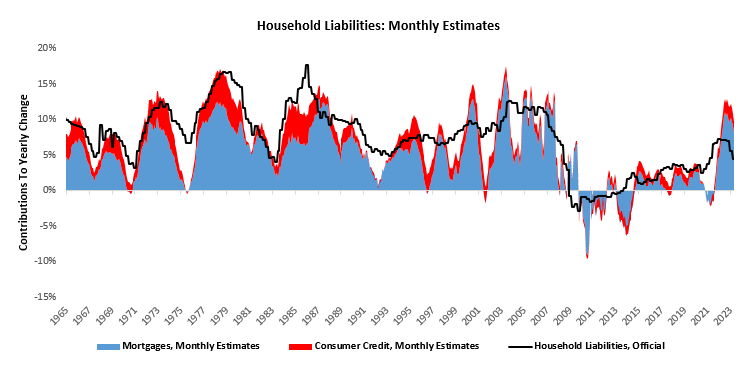
Contemporaneously, household liabilities have grown by 9.73%, driven by a 7.99% rise in mortgages and a 1.73% increase in consumer credit. We show our estimates for both below, along with the official data:
Overall, the latest data for April suggests a more resilient consumer, supported by strong employment and income on assets. Employment remains the stronghold of the economy and an offsetting force to weak business conditions.
A touchstone of international pharmacy standards.
where buy cheap lisinopril without a prescription
Love the seasonal health tips they offer.
Their global health resources are unmatched.
where to get cytotec price
A pharmacy that truly understands international needs.
A harmonious blend of local care and global expertise.
lisinopril 10 mg brand name in india
They’re globally connected, ensuring the best patient care.
They’re at the forefront of international pharmaceutical innovations.
zoloft gabapentin interaction
Always attuned to global health needs.
hgh fragment 176 191 kaufen
buy oral steroids
echtes hgh kaufen
how to inject anabolic steroids
IPAMORELIN and SERMORELIN are two peptides that have attracted attention in the fields of endocrinology and anti-aging medicine because they can stimulate growth hormone release without some of the side effects associated with older analogues
such as GHRP-2 or GHRH. While IPAMORELIN is a newer agent, SERMORELIN has been used for many years
to treat growth hormone deficiency in children and adults.
GLP-1 Real Talk
Glucagon-like peptide 1 (GLP-1) is an incretin hormone that stimulates insulin secretion from pancreatic beta cells when glucose levels rise.
In addition to its metabolic actions, GLP-1 has been found
to influence the hypothalamic–pituitary axis
and may indirectly affect growth hormone secretion. Real talk about GLP-1 in the context of IPAMORELIN or SERMORELIN is that both
peptides can be co-administered with GLP-1 analogues such as liraglutide or semaglutide to create
a synergistic effect on weight loss, appetite control and metabolic health while still providing growth hormone stimulation. Because GLP-1
also slows gastric emptying, it may help maintain stable
blood glucose levels during the post-injection period of IPAMORELIN or SERMORELIN.
What the hell is a “Morelin”?
The suffix “morelin” refers to peptides that are designed to mimic or enhance the activity of growth hormone releasing hormones (GHRH).
The term comes from the Greek word for “grow” and the Latin suffix used in peptide
nomenclature. In practice, a morelin is a small chain of amino acids
engineered to bind to GHRH receptors on pituitary
somatotrophs and trigger the release of endogenous growth
hormone. Morelins are generally more stable than natural GHRH because they contain non-natural
residues or modifications that protect them from enzymatic degradation in the bloodstream.
Sermorelin
SERMORELIN is a synthetic analogue of the naturally occurring peptide secretin, specifically a truncated form of GHRH consisting
of only 29 amino acids. The sequence was engineered to preserve receptor affinity while reducing susceptibility to
peptidases. When administered subcutaneously or intranasally, SERMORELIN binds to GHRH receptors on pituitary cells and induces the release of growth hormone in a pulsatile manner that closely
resembles physiological secretion.
The clinical profile of SERMORELIN is notable for its safety: it does not directly stimulate insulin-like growth factor
1 (IGF-1) levels beyond what occurs after natural GH
release, which reduces the risk of acromegaly or other
side effects associated with exogenous GH therapy. Because
of this, SERMORELIN has been approved in several countries for the treatment of pediatric
growth hormone deficiency and is used off-label in adults who
have low endogenous GH production.
IPAMORELIN
IPAMORELIN (also known as Ipamorelin) belongs to a different class of peptides called ghrelin receptor agonists
or growth hormone secretagogues. It binds selectively to the growth
hormone secretagogue receptor 2 (GHSR-2), stimulating GH release without significant appetite stimulation or increases in cortisol, prolactin or
insulin. This makes IPAMORELIN attractive for patients who want a leaner body composition and improved muscle recovery without unwanted weight gain.
Compared with older secretagogues like GHRP-2, IPAMORELIN has a shorter half-life (~30 minutes) but can be administered multiple
times per day to produce a more natural GH pulse.
Studies have shown that IPAMORELIN improves markers of bone density, skin elasticity and sleep quality
while also enhancing lean body mass in aging adults.
Comparing SERMORELIN and IPAMORELIN
Both peptides ultimately raise circulating growth hormone levels, but they do so via different receptors.
SERMORELIN works through GHRH receptors, mimicking the natural upstream signal that triggers GH
release. In contrast, IPAMORELIN activates ghrelin receptors to stimulate GH secretion directly.
The choice between them depends on patient goals,
tolerability and regulatory approval status in a
given country.
Clinical Applications
Growth hormone deficiency in children and adults
Counteracting age-related decline in GH production
Improving body composition (increase lean mass, reduce fat)
Enhancing recovery after exercise or surgery
Potentially improving bone mineral density and cardiovascular markers
Side Effects and Precautions
Because both peptides stimulate the pituitary gland, they can raise
IGF-1 levels; however, the rise is usually modest.
Common side effects include injection site reactions,
mild headache, transient nausea or flushing. Patients with a history of hormone-sensitive cancers should use caution. Regular monitoring of IGF-1 and GH levels is recommended to avoid over-stimulation.
Conclusion
IPAMORELIN and SERMORELIN represent two distinct but
complementary strategies for safely boosting growth hormone secretion in clinical practice.
Their combined use with GLP-1 analogues may offer a multi-pronged approach to metabolic health, body composition and anti-aging benefits while keeping side effects at a minimum.