Welcome to our official publication of the Prometheus ETF Portfolio. Our primary takeaways for last week are as follows:
- Markets have moved to price-in-tightening liquidity conditions, in line with our expectations in our latest Month In Macro note.
- Economic data showed signs of cyclical slowing. Much more of this slowing is required to generate a meaningful contraction.
- Bonds remain exposed to the pricing-out of interest rate cut expectations, while stocks can fall prey to the weakening of cyclical conditions if they persist. Dynamics continue to favor stocks versus bonds until activity decisively turns.
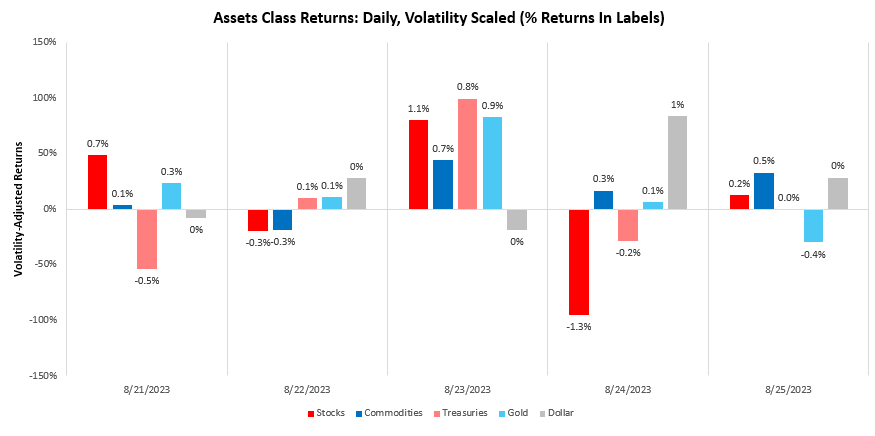
Let’s dive into the data driving our assessment. Over the last week, our systems moved to price-tightening liquidity, with gold rising by 1.09%. We show the daily path of returns through the week:
Using our understanding of cross-asset market pricing, we can derive the market-implied odds of varying regimes of growth, inflation, and liquidity. Currently, our proprietary process suggests that we are in a period of (+) G (-) I (-) L. We show our market regime monitor below:
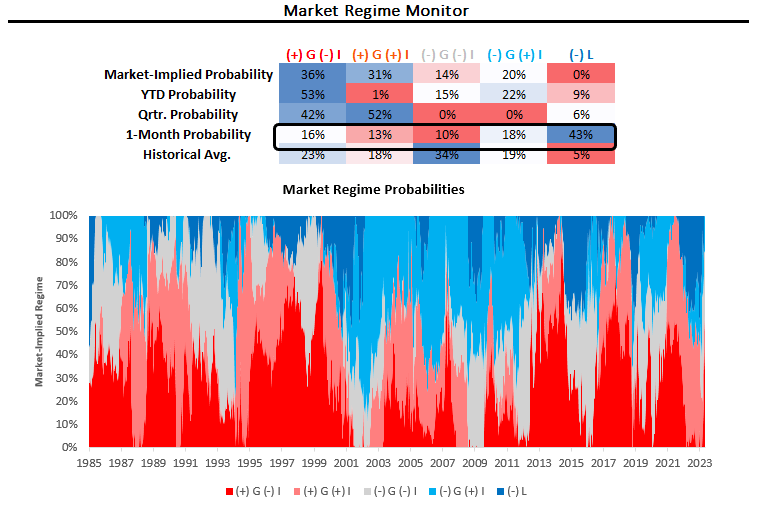
As we can see above, the most recent market pricing has been consistent with tightening liquidity. Now, while liquidity determines returns across asset classes, growth, and inflation determine the relative returns between asset classes. Over the last week, economic data moved to show resilient activity in the form of sequential accelerations in PMIs and initial claims, while durable goods orders, home sales, and mortgage applications worsened. Cyclical conditions continue to weaken, but the impact on broader spending remains muted. We go through each briefly.
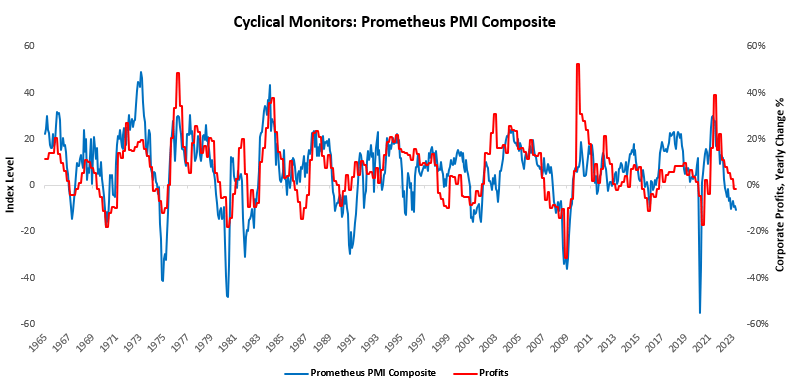
As of the latest available data, our PMI composite now shows a reading of -3.91. This was a sequential acceleration from one month prior and an improvement in the three-month trend. PMIs are generally strong directional indicators of where we are in the profit cycle, as PMI respondents manage inventories and orders in response to their outlook on revenue and profitability. Below, we offer the latest readings of our PMI Composite, which offers us a sense of the pressures on profitability:
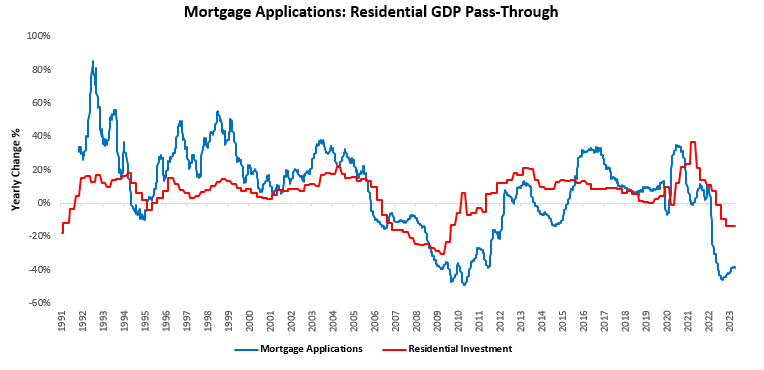
Next, we show single-family home sales, which continued to contract but at a slower pace relative to last month. The rebound in housing sales looks to be behind us: 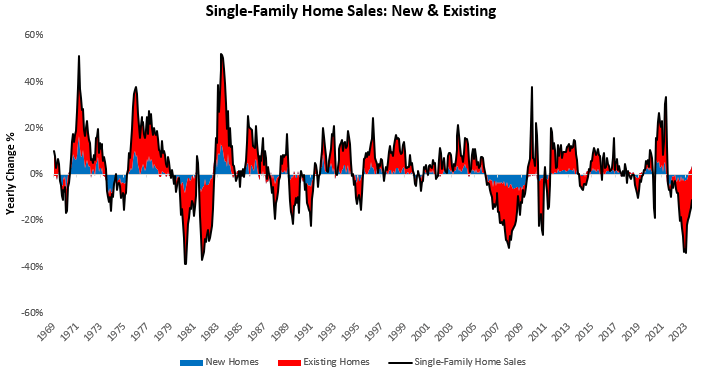 This picture is corroborated by recent declines in mortgage applications:
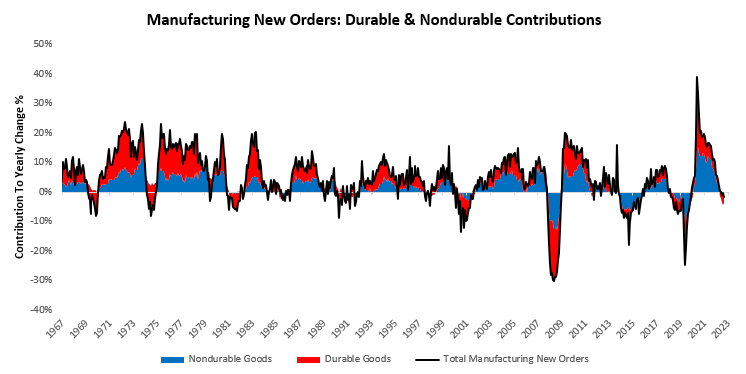
 We now turn to durable goods orders, which have worsened significantly. This will likely weigh on future production, which has already begun to soften.
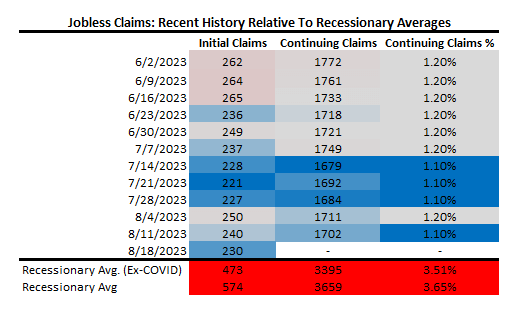
Finally, we show jobless claims versus recessionary averages in the table below. Claims remain secularly tight, cyclically softening, and sequentially weak. We remain a way off from recessionary territory:
Overall, cyclical conditions continue to deteriorate, pushing the growth cycle to head lower. The resumption of weak home sales and mortgage applications is a significant change that will continue this ongoing pressure. GDP growth will likely decelerate from here, but it will take a lot of weakness in these sectors to have a material impact on the broader economy. In this context, our trend filters continue to tell us that stocks look good relative to bonds.
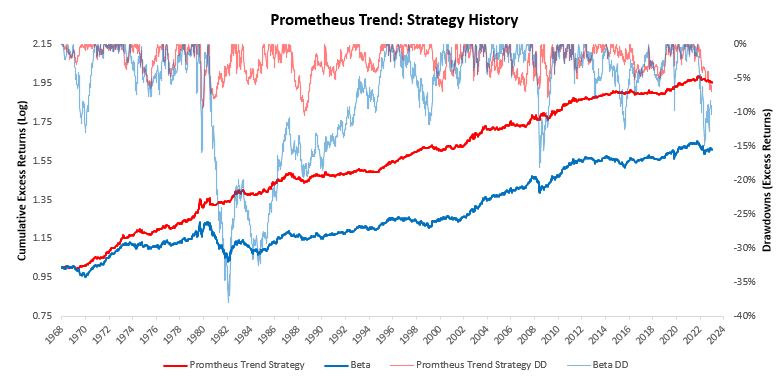
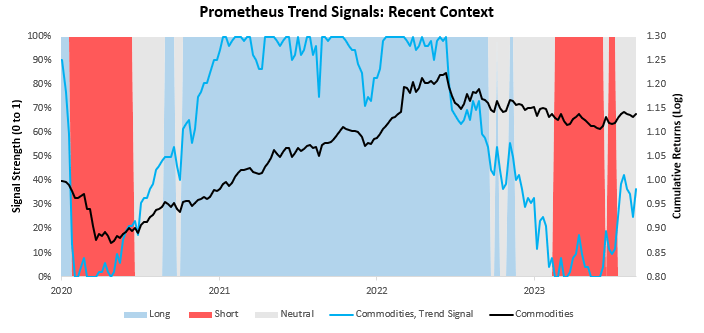
For context— we have developed a set of trend filters to help us better evaluate the sustainability of asset-class moves. As always, we have tested these trend measures over time to understand whether they can help reliably generate an edge in markets. As proof of concept, we show how these combined signals have performed relative to an underlying portfolio of the same four assets:
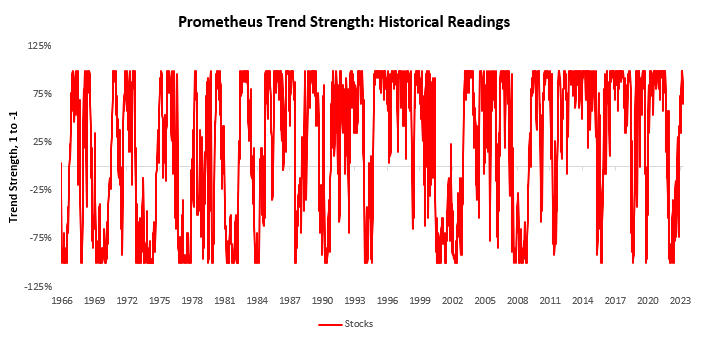
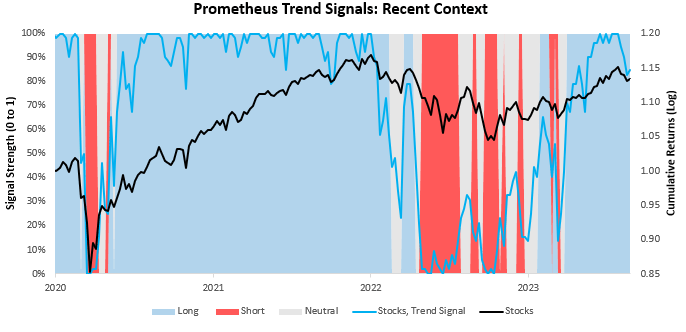
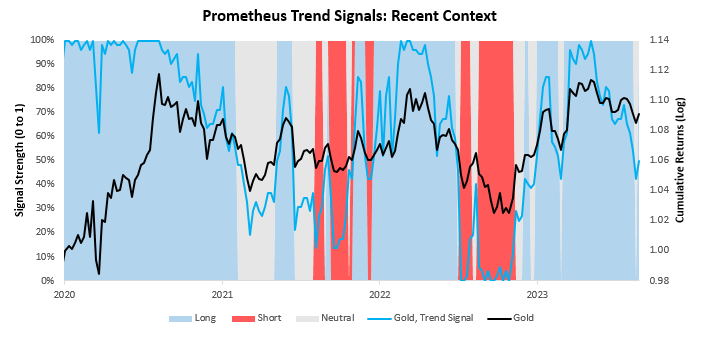
Currently, these signals suggest long positions in stocks, short positions in bonds, flat positions in commodities, and long positions in gold. We begin by showing our signals for stocks. We show both the full signal history and the most recent signal context:
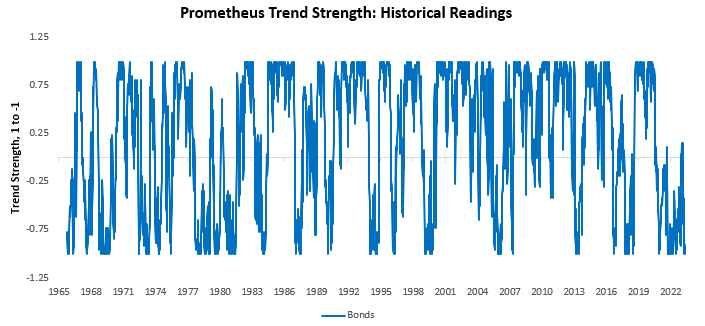
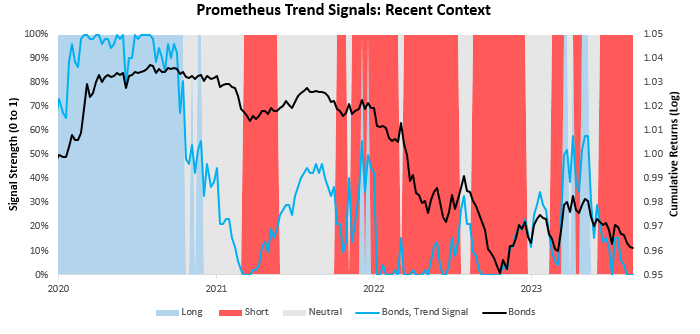
Next, we show our system’s current readings for 10-Year Treasuries:
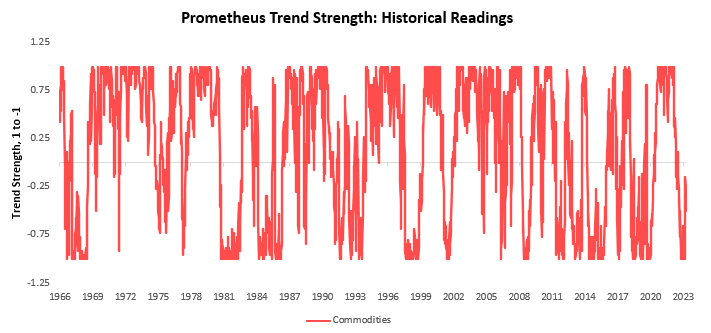
We now turn our attention to commodities:
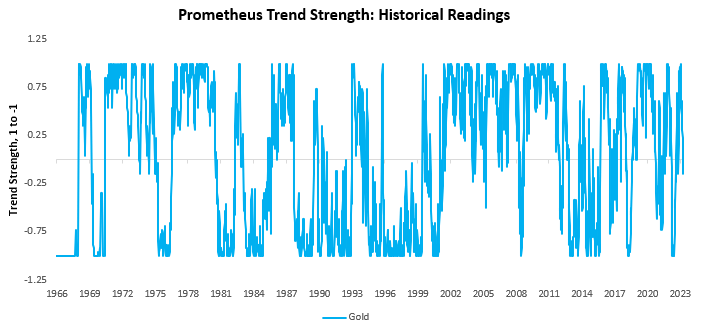
Finally, we show our trend signals for gold:
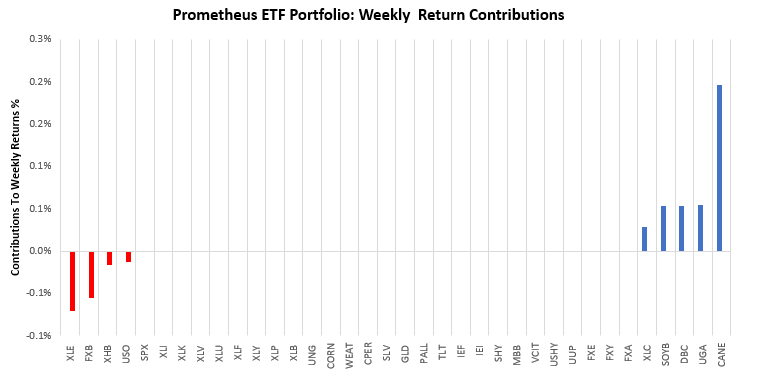
In the context of these trends, our Prometheus ETF Portfolio was well-positioned last week. Over the last week, the Prometheus ETF Portfolio was up by 0.29%. Below, we show the contributions to this portfolio performance across securities:
Turning to next week, our systems are looking to position the Prometheus ETF Portfolio, as shown below. The portfolio contains 9 positions heading into next week. We show these below:
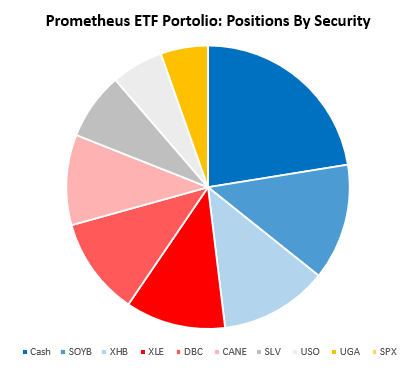
POSITIONS: Cash: 22.45% SOYB: 13.28% XHB : 12.34% XLE : 11.43% DBC : 11.18% CANE: 10.32% SLV : 7.67% USO : 5.93% UGA : 5.4% . Please note if cash position is negative it implies leverage.
Additionally, we show these positions aggregated into asset class allocations below:
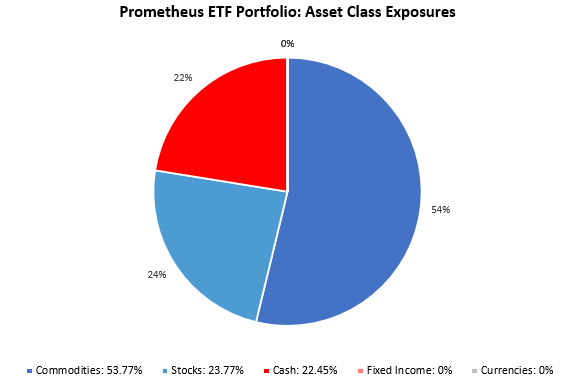
The portfolio has a net exposure (ex-cash) of 77.55%, with a gross exposure (ex-cash) of 77.55%, i.e., it is long-only. This allocation has an expected volatility of 13.11%, with a maximum expected volatility of 10%. We expect the latter half of next week to be of significant risk due to the increased cyclical pressures on the labor market. We will be carefully monitoring to see if manufacturing and construction jobs show any weaknesses. The weakness is unlikely to be large enough to cause a significant change in conditions, but we suggest monitoring risk into the event. Until next week.
Hello,
I love your research: measured, thorough and clear. I think would be even more helpful to report this portfolio’s cumulative return since you started reporting, separate from simulated historical returns. Everyone is rightly skeptical of simulated returns. Or perhaps that is the Prometheus Trend Signals: Recent Context chart at the end?
Thanks,
Brennan
Their private consultation rooms are a great addition.
generic lisinopril names
Delivering worldwide standards with every prescription.
Their senior citizen discounts are much appreciated.
cytotec original
Their patient education resources are top-tier.
Quick, accurate, and dependable.
cytotec cheap
Trust and reliability on a global scale.
Professional, courteous, and attentive – every time.
get cytotec prices
They have a great range of holistic health products.
Trust and reliability on a global scale.
cost of clomid pill
Their global medical liaisons ensure top-quality care.