Disinflation Incoming: Staying Long Stocks & Bonds
Welcome to our official publication of the Prometheus ETF Portfolio. The Prometheus ETF portfolio systematically combines our knowledge of macro & markets to create an active portfolio that aims to offer high risk-adjusted returns, durable performance, & low drawdowns. Given its systematic nature, we have tested the Prometheus ETF Portfolio through decades of history and have shown its durability. For those of you who are unacquainted with our systematic process, we offer a detailed explanation here:
In this publication, we will discuss the performance, positioning, & risks of the Prometheus ETF Portfolio and it will be published every week on Fridays to help investors understand how our systematic process is navigating through markets. Before diving into our ETF Portfolio positions, we think it is important for subscribers to understand the context within which our systems choose their exposures. Below, we offer our detailed Month In Macro note, which contains the conceptual underpinnings of our systematic process within the context of the latest economic data:
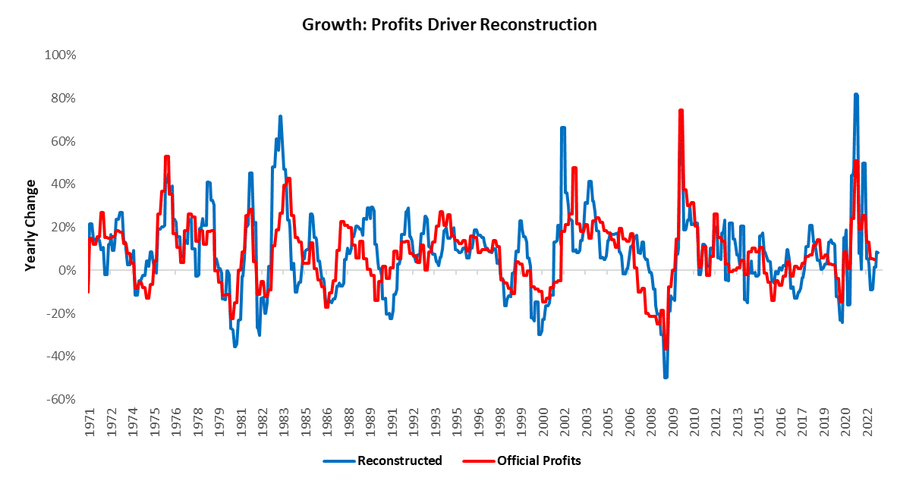
After taking a break for the holiday season, our team will resume publishing Month In Macro for 2023, starting with the January edition. We highly recommend you catch up on our outlook before our next release. We received incremental information in the form of GDP data this week. While many remain focused on the headline print, we think the value of the GDP data is in gaining further clarity on the forces at play in the broader economic cycle. As we have said here in several notes, the next steps in the economic cycle will be determined by the severity of a building profit contraction. The latest GDP data affirmed our understanding that pressures on corporate profitability are in place, though they eased somewhat in the fourth quarter of 2022. Our latest estimate shows YoY profits at approximately 8%. We show this below:

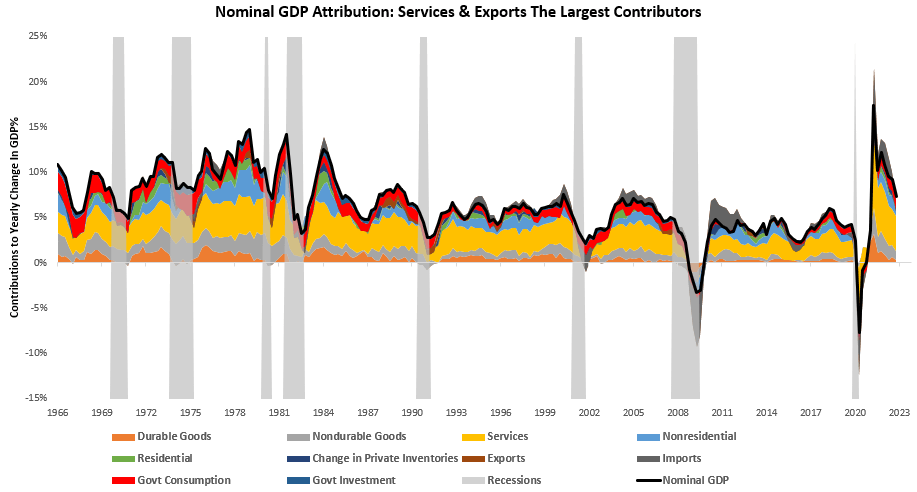
There are two ways to think about profits. First, as a function of the top line. Second, as a function of relative dis-savings between sectors Using these lenses, we can reconstitute profits in several ways to understand the forces at play. Through the first lens looking at profits as a function of topline is fairly straightforward, i.e., for a given level of GDP, companies take a certain share of the pie as profits. As nominal GDP declines/increases, profits respond. Today’s GDP shows nominal GDP is still positive but decelerating:
Within this aggregate spending, it is important to recognize that cyclical components of GDP, i.e., those most exposed to the credit cycle, are contracting, and their weakness is likely to flow through to future income and spending. We show this below:
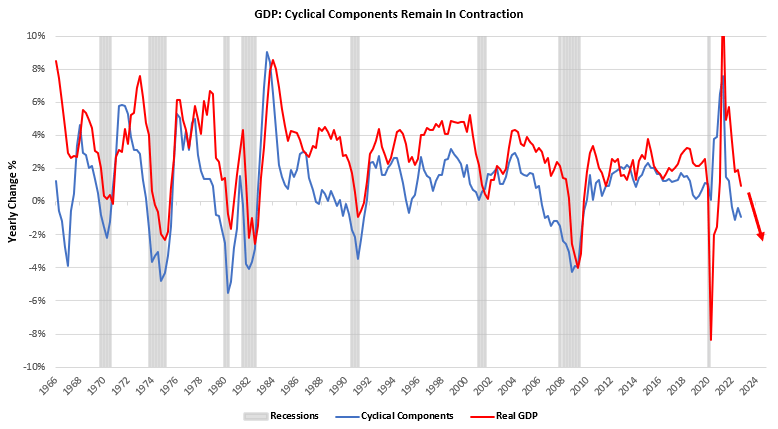
Therefore, while current aggregate nominal spending is supportive of profitability and the continuation of the economic cycle, pressures are building for the nominal pie to shrink as well. Nonetheless, currently, nominal spending has been net support to profits.
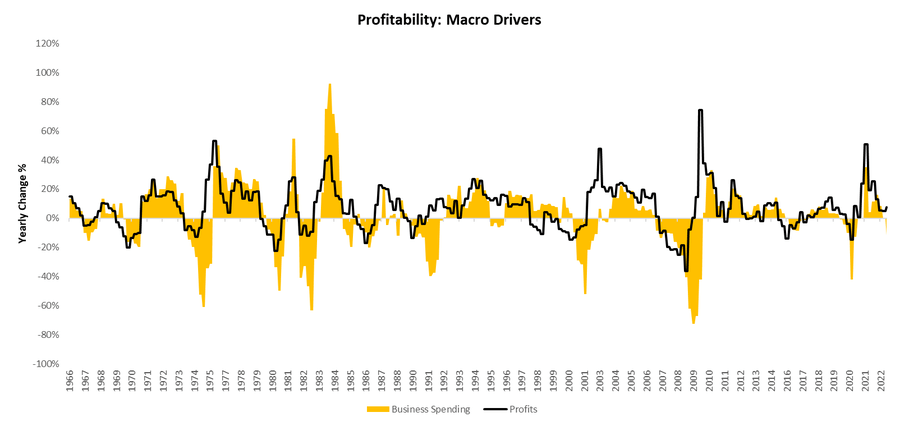
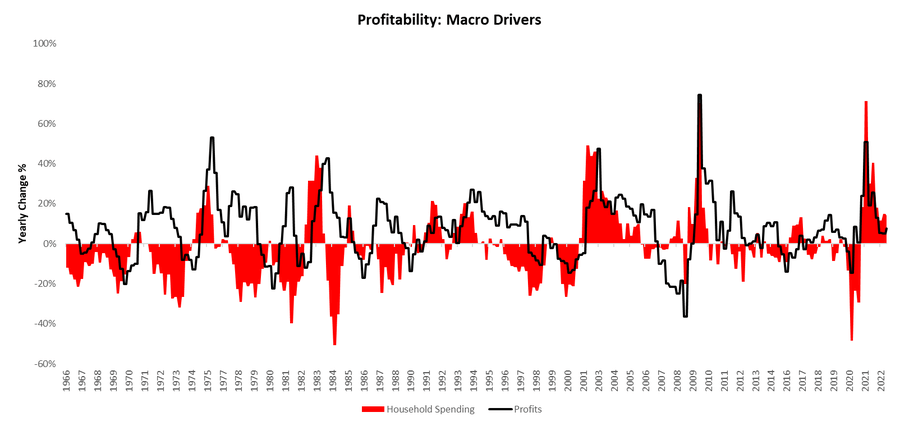
Turning to our second method of understanding profits within this nominal GDP pie, households, businesses, the foreign sector, and governments vie for surpluses at the expense of each other. The more any of the non-business parties spend vs. their income, the more profitable businesses can be. sing this approach; we can understand where current profits are coming from. In the current setting, we are seeing a large drag on profitability coming from businesses’ own spending, i.e., their reinvestment. We show this drag below: using this approach, we can understand where current profits come from. In the current setting, we are seeing a large drag on profitability coming from businesses’ own spending, i.e., their reinvestment. We show this drag below:
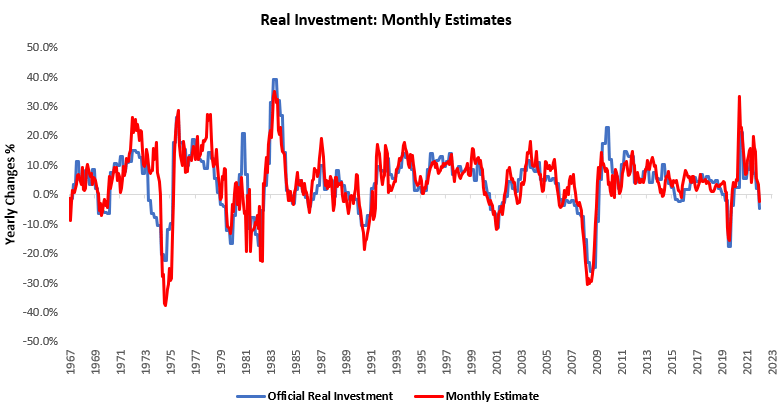
This drag is no surprise to us, as our monthly estimates of total investment have telegraphed these pressures:
Compensating for this drag, we see an increase in household spending vs. income- i.e., the reduction in household savings rates is making its way into profitability:
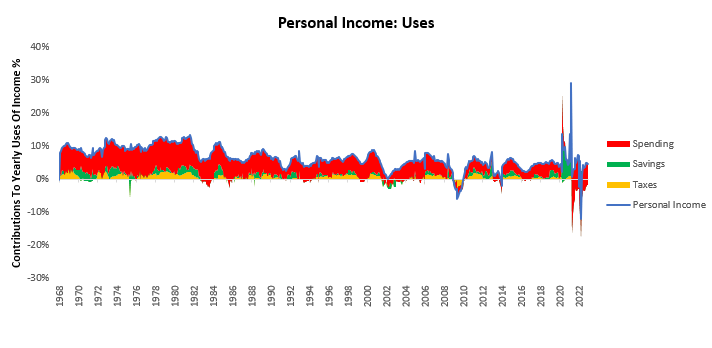
However, it is important to recognize that household savings rates are at historic lows, and the outlook for income growth remains weak. The combination of these factors bodes ill for household spending. We received incremental information in this direction today. Personal Income increased in December, and this income was primarily saved. Income increased as taxes remained flat, savings increased by 0.4% & spending decreased by 0.18%. We show the composition of these uses of nominal income below:
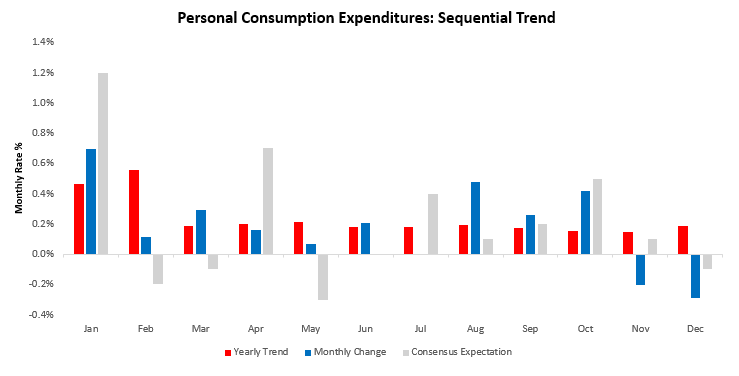
Translating this impact into real spending real consumption decreased -0.29% in December, disappointing consensus expectations of -0.1%. This print contributed to a sequential deceleration in the quarterly trend relative to the yearly trend. Below, we show the monthly evolution of the data relative to its 12-monthly trend and consensus expectations:
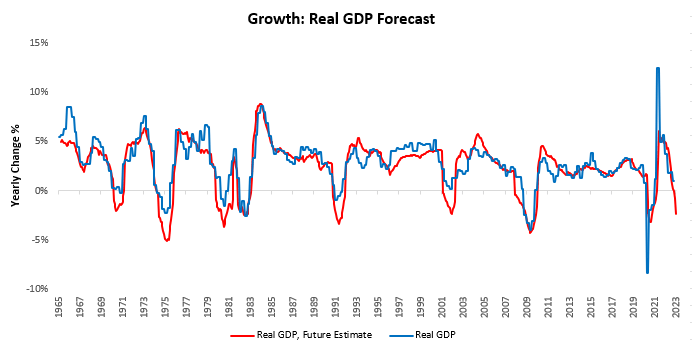
The key question for the profit cycle, which will drive the GDP cycle is now whether real consumption can continue these contractions. A weakening in consumption will cause a significant hit to headline GDP numbers and dampen corporate profit, pushing for layoffs to begin in aggregate. This dynamic will be the impact that transitions real GDP into a consistent contraction. Our estimates show a contraction in real GDP on the cards in the near future:
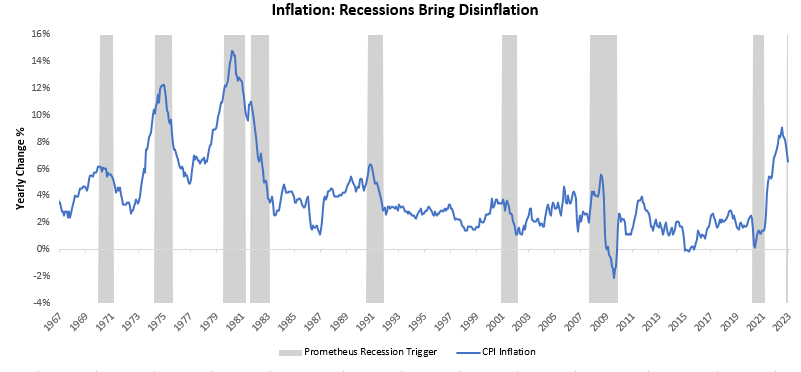
What is important to recognize here is that the build-up of potential recessionary activity bodes ill for nominal spending and, in turn, inflation. Below, we show inflation during periods where our future estimates flagged potential recessionary conditions:
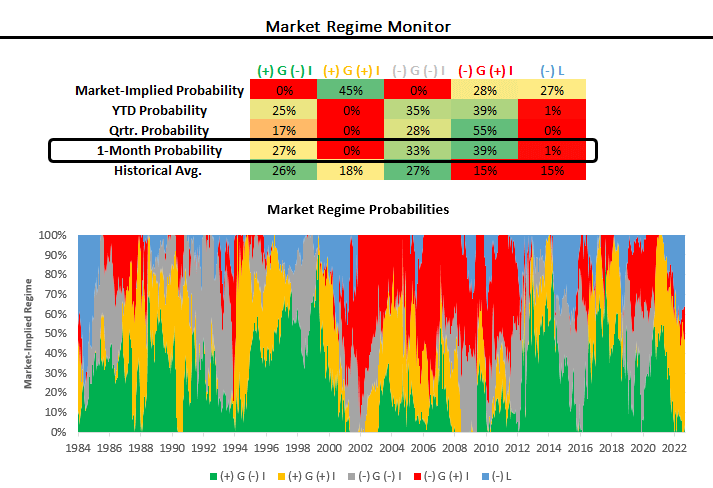
We see markets beginning to price these expectations, with falling growth and falling inflation cumulatively occupying strong market odds in our market regime monitors over the last month:
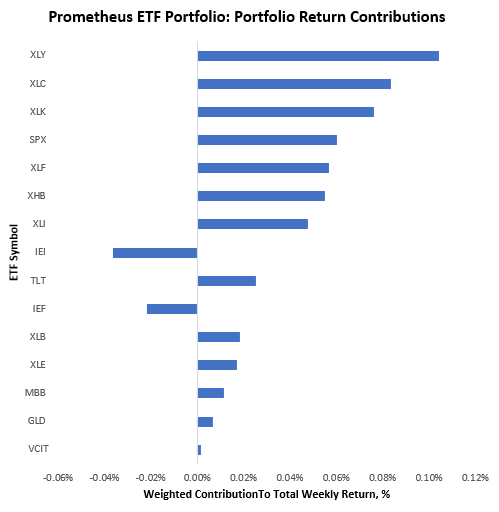
Decelerating nominal activity remains the most likely outcome based on our outlook. In a decelerating nominal world, we likely experience the inverse of what we experienced in 2022, i.e., stocks and bonds will likely perform far better than they did in 2022. Make no mistake; we currently expect a transition into a real GDP contraction. However, the exact time to get there remains uncertain. Meanwhile, traditional allocations will likely have a period of reprieve from inflation and policy shocks, which is what we are seeing today. Timing is everything, and our systems attempt to thread the needle and, thus far, have done well in navigating this transition being long stocks & bonds this week. This positioning resulted in a gain of approximately 0.60%. We show the contributions to these gains below:
Turning to next week, our systems are looking to position as follows roughly the same:
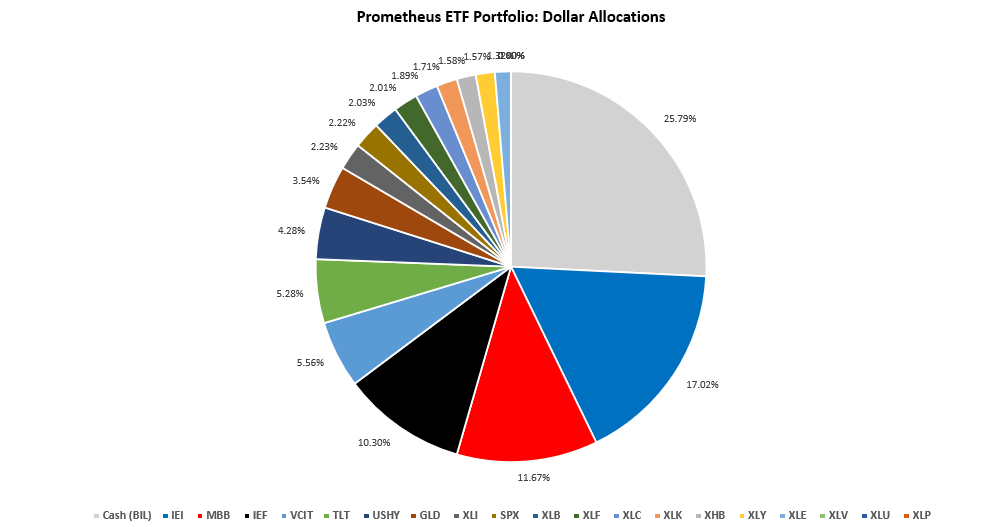
Positions: BIL: 25.79% IEI : 17.02% MBB : 11.67% IEF : 10.3% VCIT: 5.56% TLT : 5.28% USHY: 4.28% GLD : 3.54% XLI : 2.23% SPX : 2.22% XLB : 2.03% XLF : 2.01% XLC : 1.89% XLK : 1.71% XHB : 1.58% XLY : 1.57% XLE : 1.32%
At the asset class level:
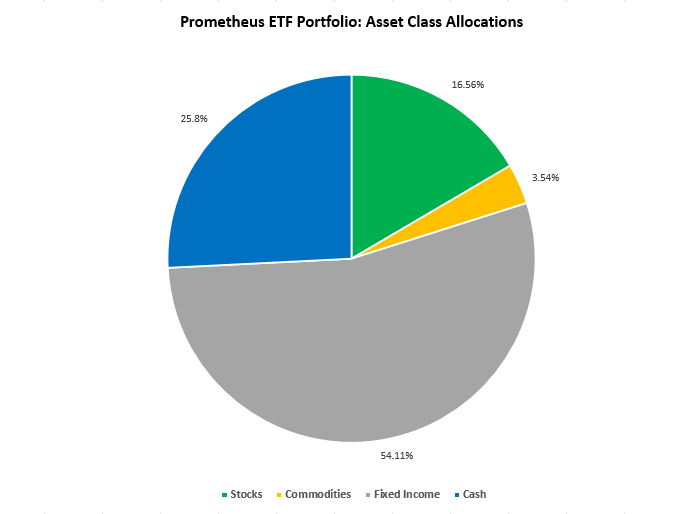
This allocation has an expected volatility of 7.8% and a maximum expected volatility of 10%. The biggest risk to these positions will be the FOMC next week a more hawkish Fed will hurt this allocation significantly. However, given recent inflation data and market discounting of policy, it is unlikely markets will receive any new information. Chairman Powell will likely press discontent with financial conditions; however, those are unlikely to be an impetus for future policy actions. Therefore, without adding more interest rate hikes to market pricing, the portfolio has a moderate chance of achieving maximum volatility.
We continue to navigate a precarious part of the macroeconomic cycle. Excessive zeel, one way or another, will likely create losses. Flexibility and patience will likely be rewarded here. Until next week.
Their global reach is unmatched.
cost cheap lisinopril prices
The widest range of international brands under one roof.
Global expertise with a personalized touch.
can you get cheap cipro without insurance
Trustworthy and reliable, every single visit.