
Long Commodities, High Cash
Welcome to our first official publication of the Prometheus ETF Portfolio. The Prometheus ETF portfolio systematically combines our knowledge of macro & markets to create an active portfolio that aims to offer high risk-adjusted returns, durable performance, & low drawdowns. Given its systematic nature, we have tested the Prometheus ETF Portfolio through decades of history and have shown its durability. For those of you who are unacquainted with our systematic process, we offer a detailed explanation here:
In this publication, we will discuss the performance, positioning, & risks of the Prometheus ETF Portfolio and it will be published every week on Fridays to help investors understand how our systematic process is navigating through markets.
Before we dive into positioning & risk, we outline the economic outlook driving these positions. Over the last month, our systematic tracking of economic conditions has shown an upwards move in real GDP growth alongside a deterioration in inflationary pressures. With regards to real GDP growth, these moves are consistent with what we have seen over the last quarter with domestic production and net export activity driving these moves. This activity, along with other components, has resulted in an extremely high level of nominal GDP, which we show below:
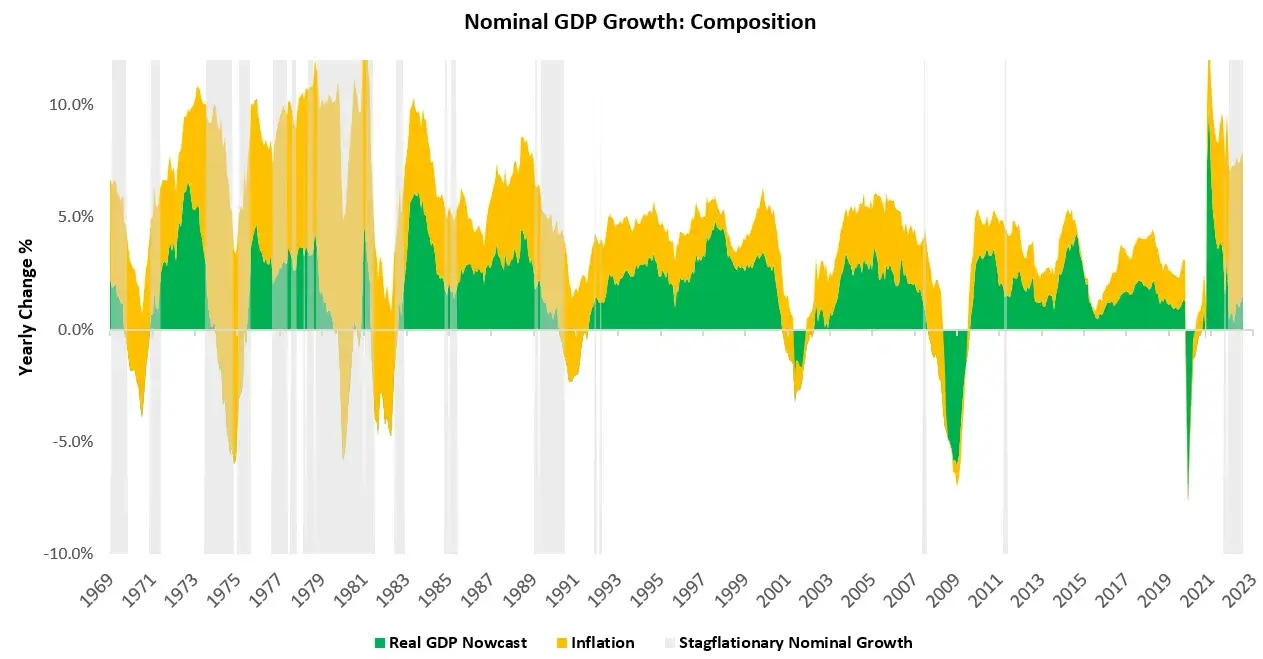
Our tracking of real GDP has now accelerated to 1.4% however, we are still waiting on essential data this month which will likely impact the nowcast significantly. While, at the surface, this may look like a robust economy, we see a different story brewing under the hood. Below, we show GDP components aggregated to create two categories, i.e., Goods & Real Estate and Services. These two areas of the economy offer a divergent set of growth outcomes amidst a robust headline GDP environment:
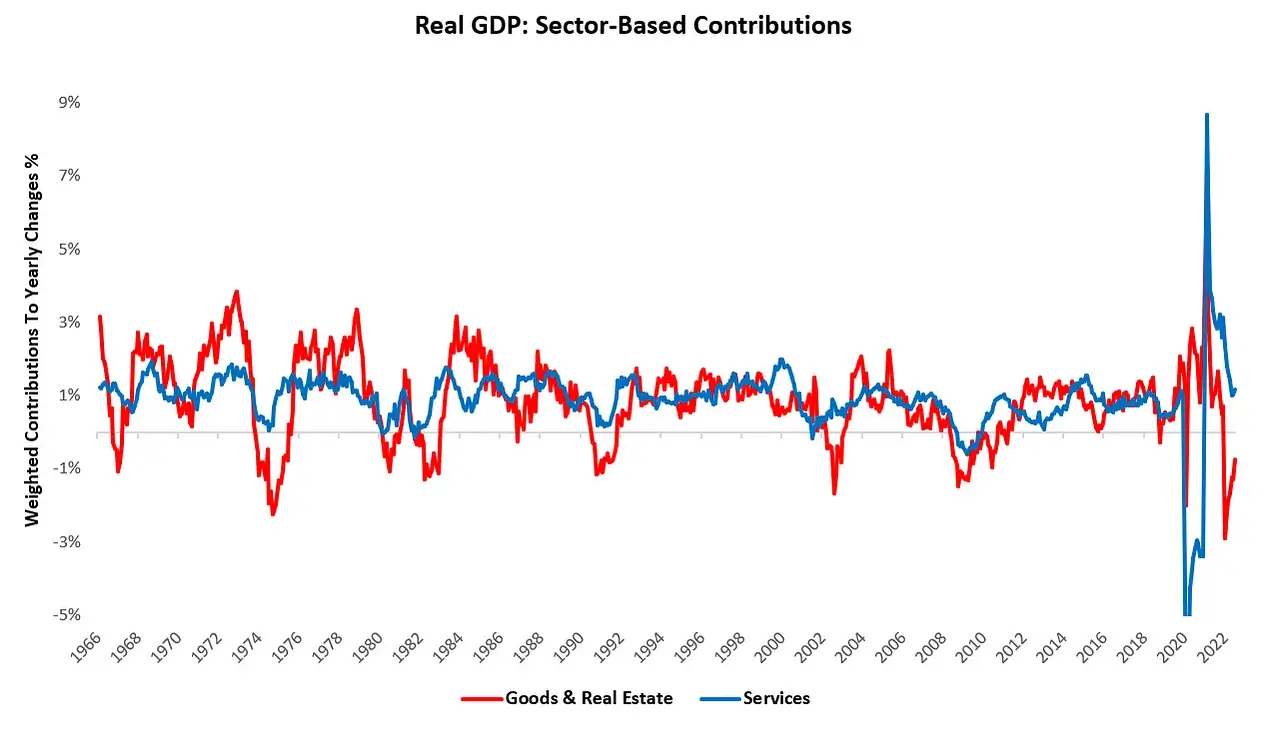
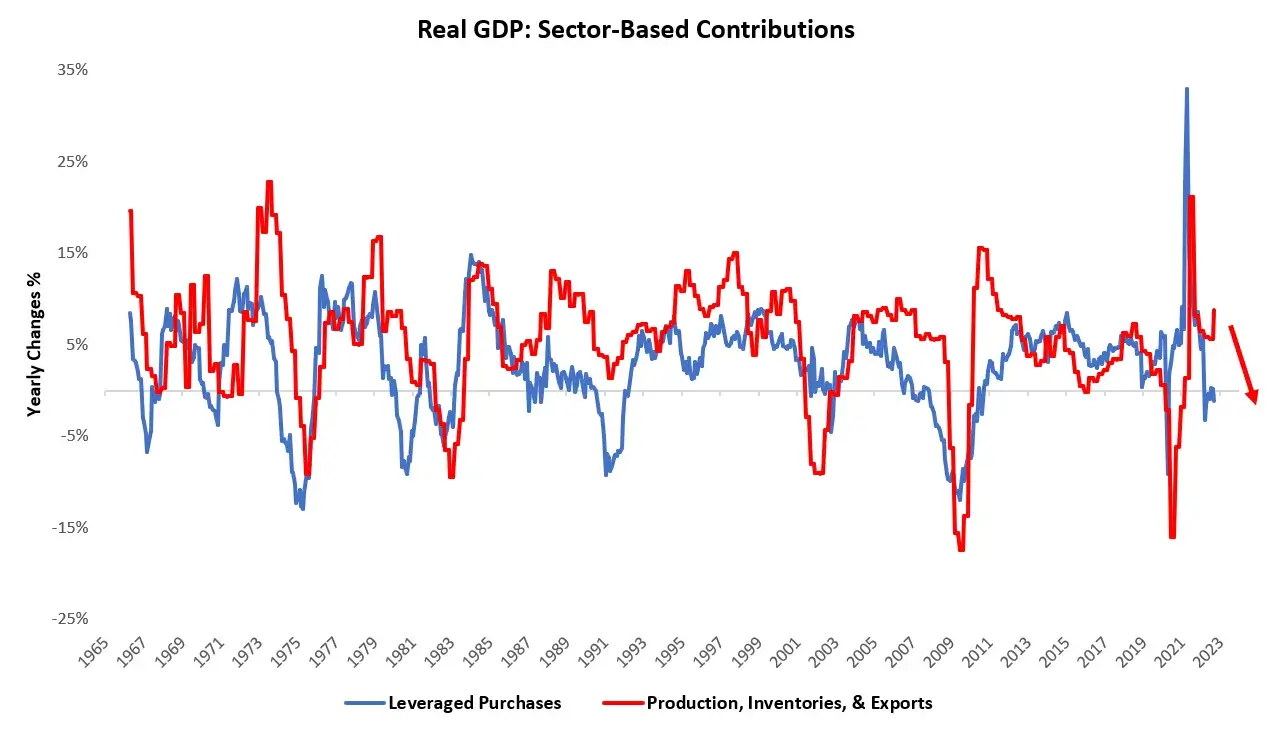
This divergence reflects both COVID-19 snapback effects, along with leverage cycle dynamics. As the Fed further tightens liquidity, levered purchases of real estate, automobiles, and big-ticket durable goods will continue to feel incrementally less demand. As the demand for these goods wanes, inventory build and output are likely to feel pressure. We show how this logic performed over history below:
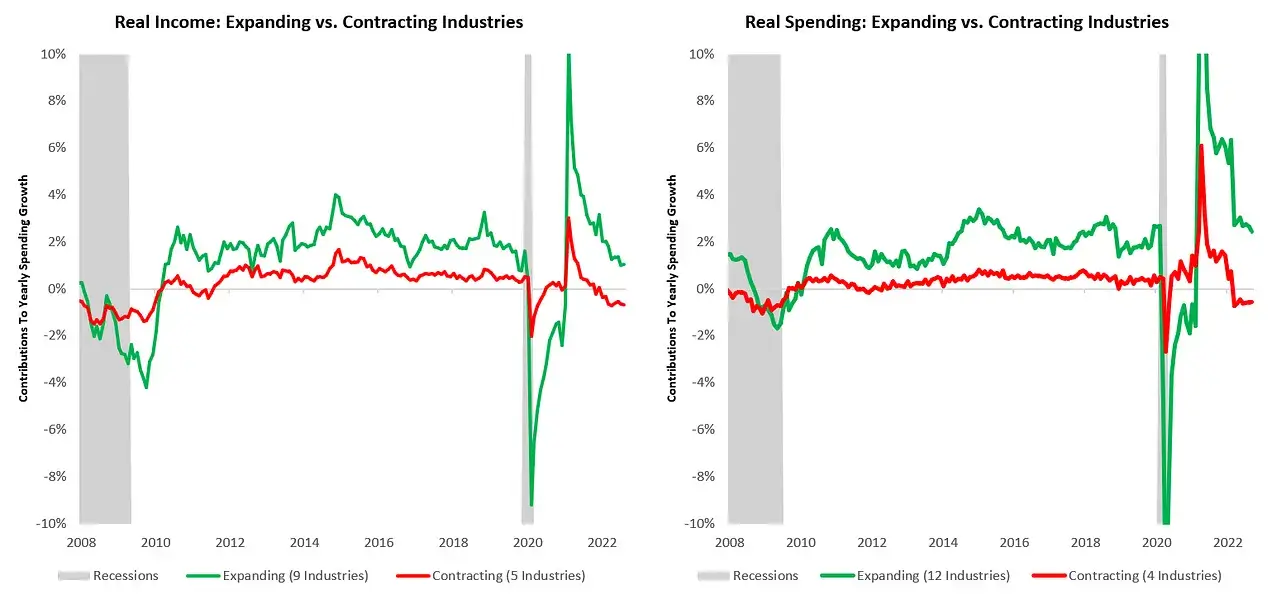
Below, we show how these dynamics have resulted in divergences within income and spending, with durable good, housing, and financial services related areas experiencing contractions:
Furthermore, we have begun to see the initial phases of a slowdown in industrial production, as we have anticipated:
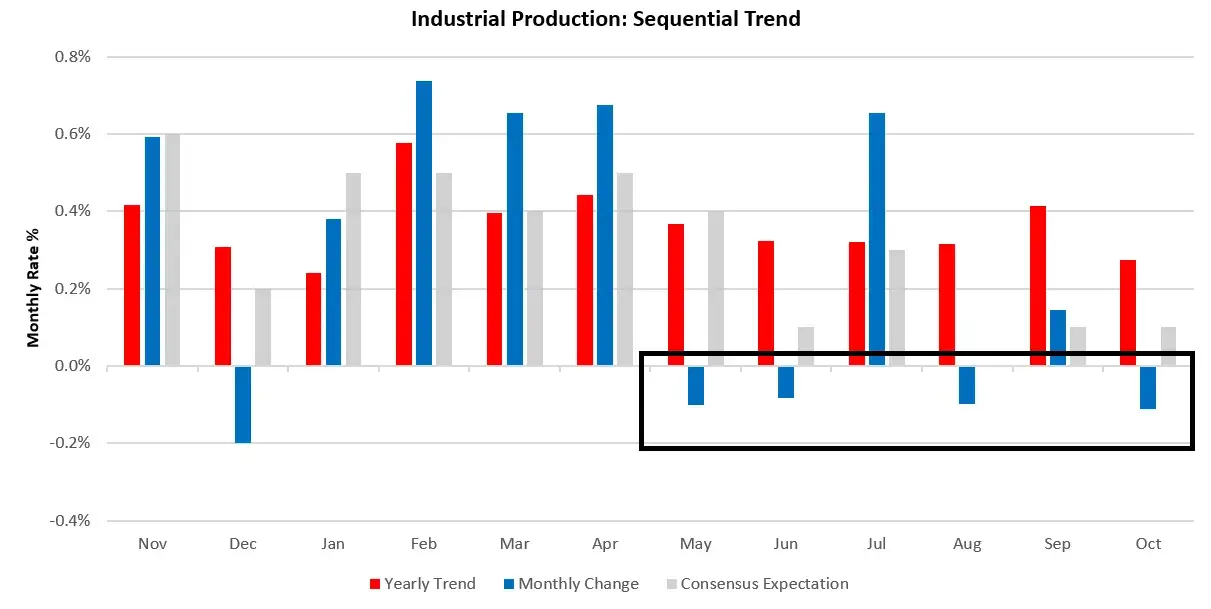
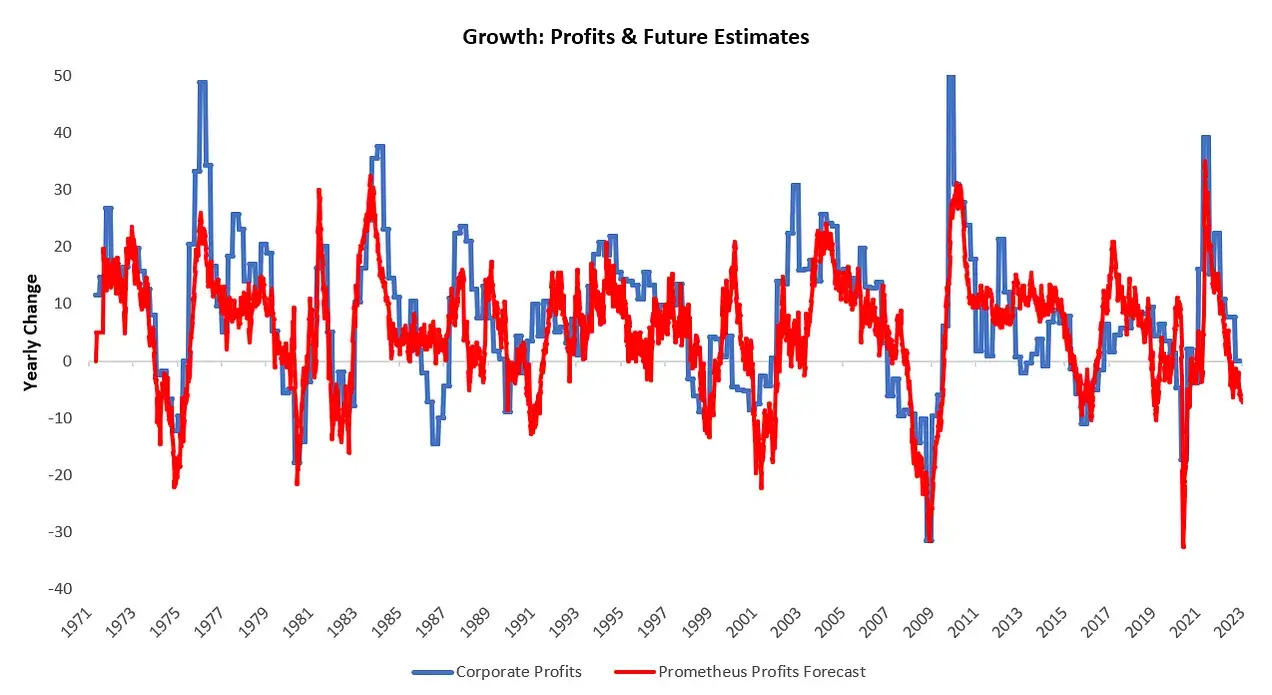
Four of the last six industrial production prints have been negative, as highlighted above. Industrial production remains positive on a yearly basis today, primarily due to sizable moves earlier this year as energy output grew significantly. Looking forward, it important to understand here is that production has to make its way into one of three places: consumption, inventories, or exports. Without adequate demand from these sources, production will have to fall. Consumption looks unlikely to re-accelerate as nominal growth decelerates and credit growth slows, inventories remain stretched relative to sales, and export contributions are already stretched to cycle highs. The combination of these factors make it unlikely that profitability will remain well-supported in coming quarters. We show our systematic profit forecast below:
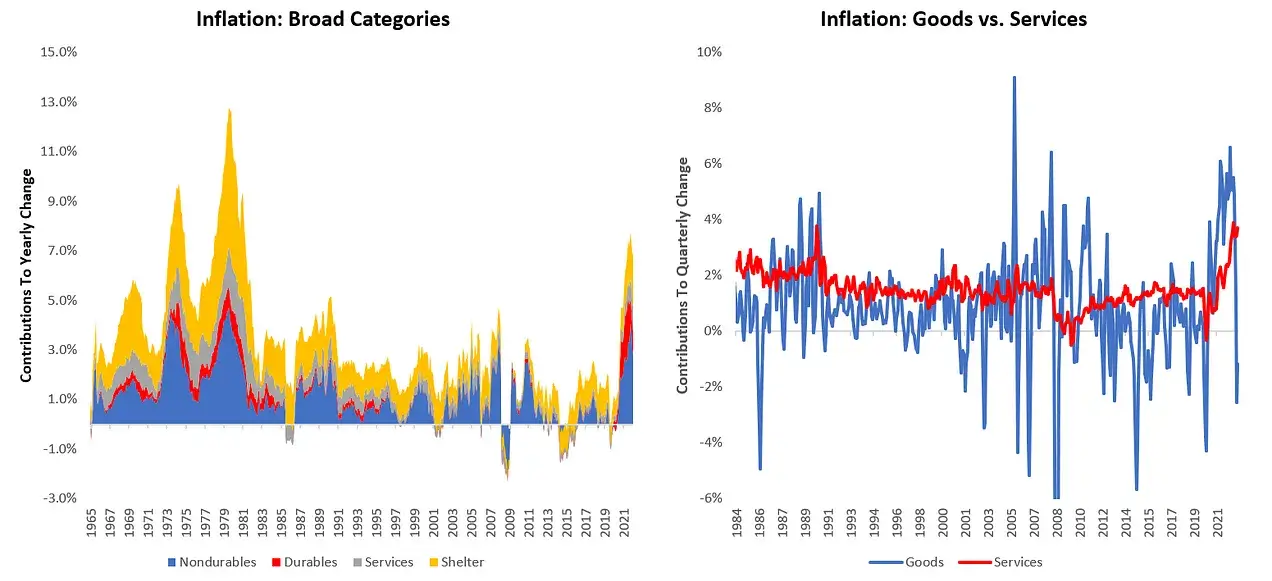
Therefore, our outlook for real growth, both for GDP & Profitability remain bleak. In line with our observations on the divergences within GDP, we see a similar set of divergences within CPI inflation. Goods and services inflation have now diverged meaningfully, which we show below:
Therefore, across growth and inflation, we are beginning to see what looks a tale of two economies one that remains well-supported by stagflationary nominal growth dynamics, and one that has begun to suffer as credit contracts. This is the typical sequencing of events as economic activity heads into a period of weakness, and therefore, we continue to real economic growth to weaken. However, given the nominal growth dynamics this weakness in real growth is likely to be accompanied by an elevated level of inflation. We see the conditions needed for further inflation acceleration as dwindling however, this does not mean a reversion to pre-pandemic inflation averages. We continue to expect a transition to stagflation, but the disinflationary hue is picking up. We will go through this in greater detail in our next Month In Macro, so if you haven;t read our previous views, we suggest you catch up before our next release:
Therefore, it is clear we expect real growth to continue to weaken, with inflation showing more mixed messaging but to remain multiples above 2%. Additionally, liquidity will continue tightening as the Fed raises interest rates and continues QT. This has led our to position as follows heading into next week:
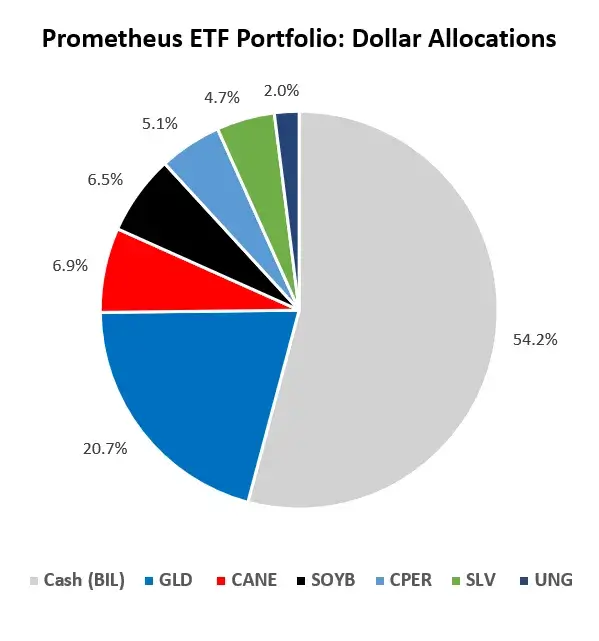
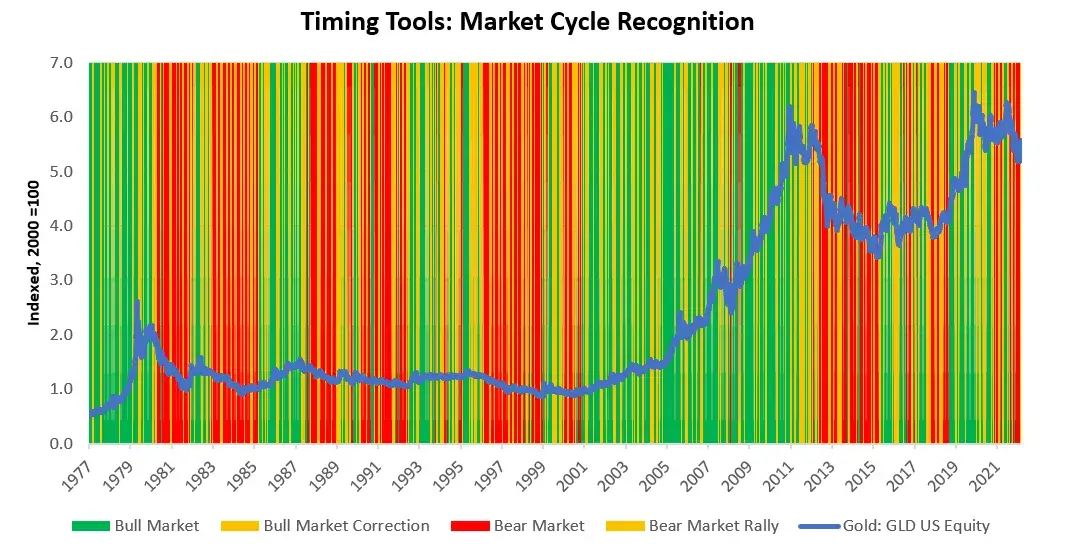
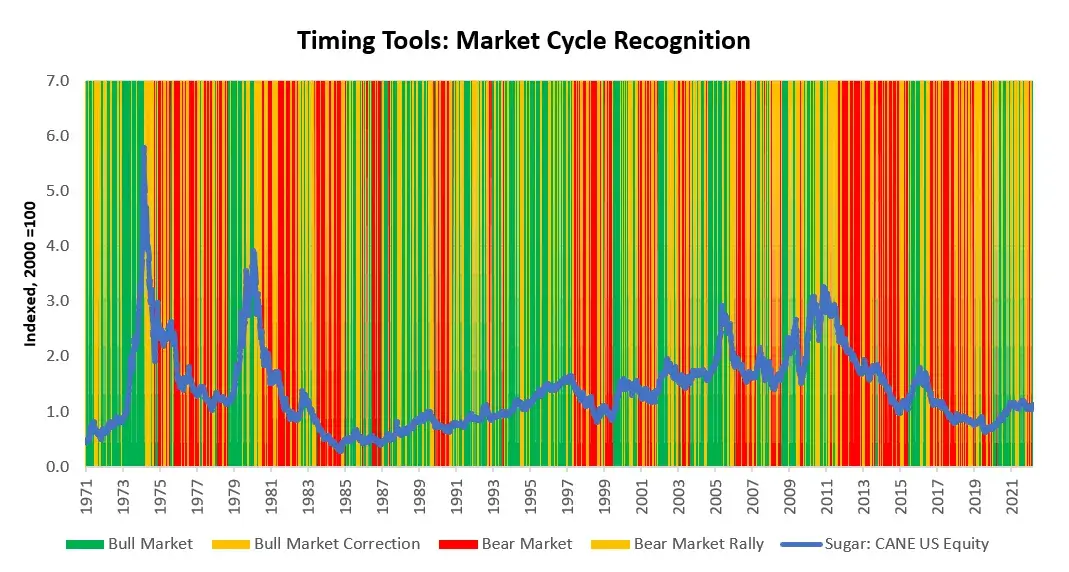
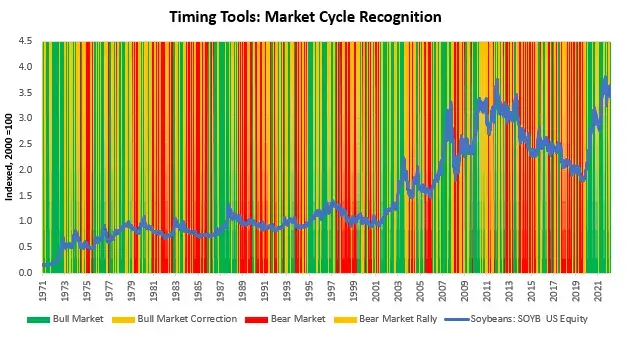
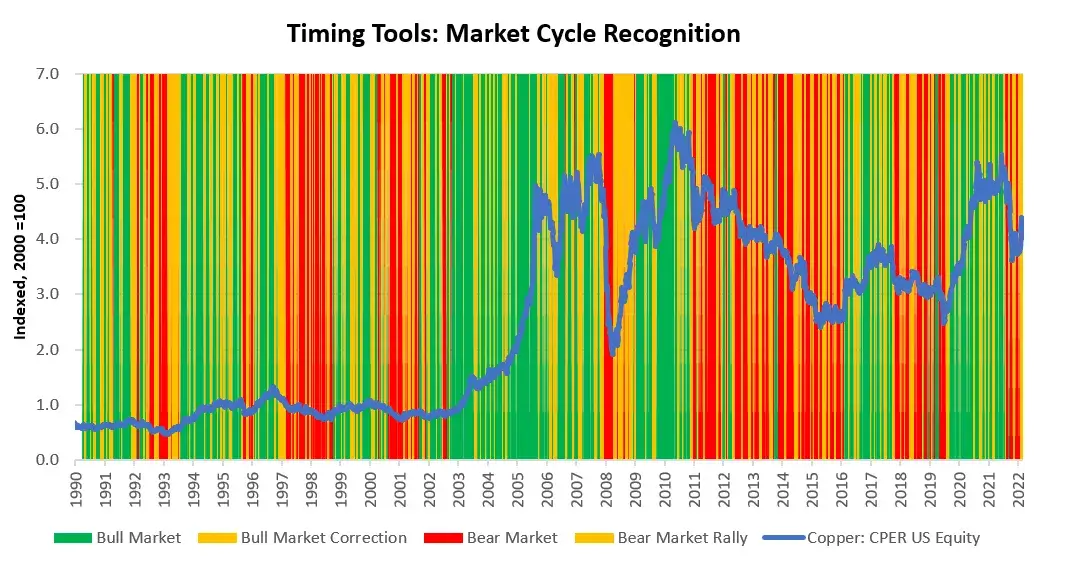
This risk exposure reflects expected volatility of 6%, with maximum volatility of 10% (annualized). We provide users with these statistics to best guide their cash and leverage exposure. Given the concentration of positions in commodities, the risk of achieving maximum volatility is significant as the commodity complex can often be correlated during significant risk moves. For additional color, we share some of our market timing tools to help contextualize the positions within the broader economic context. Our positions this week largely reflect beta capture in the commodities complex, with many markets potentially transitioning from bear market rallies to bull markets alongside several persistent bull markets. We offer some commentary below on the positions:
-
GLD: Gold remains in a Bear Market Rally. Bear market rallies can initiate regime change, and current market pricing suggests beta capture opportunities.
-
CANE: Sugar remains in a Bull Market. Consistent with this, current market pricing suggests beta capture opportunities.
-
SOYB: Soybeans remain in a Bull Market. Consistent with this, current market pricing suggests beta capture opportunities.
-
CPER: Copper remains in a Bear Market Rally. Bear market rallies can initiate regime change, and current market pricing suggests beta capture opportunities.
-
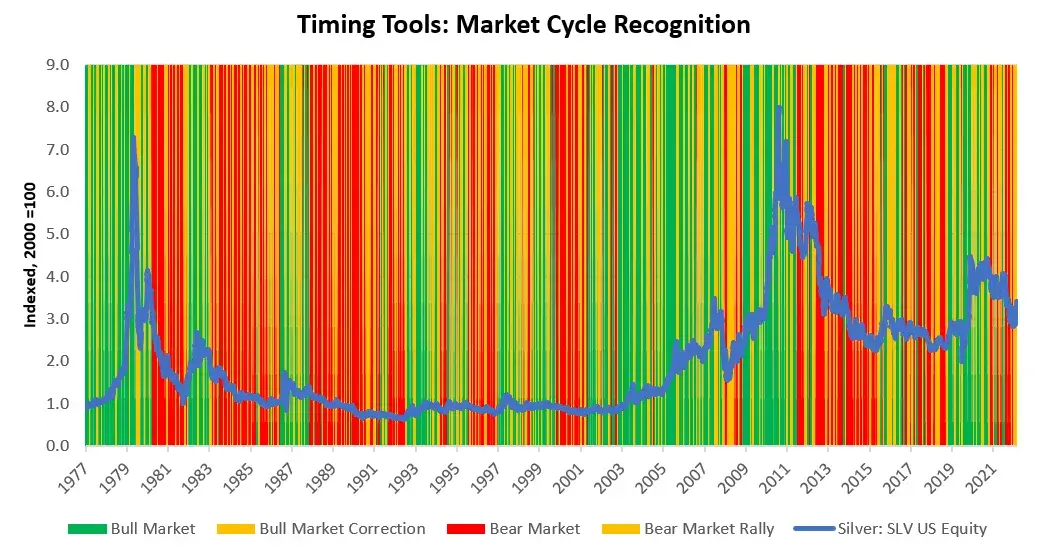
SLV: Silver remains in a Bear Market Rally. Bear market rallies can initiate regime change, and current market pricing suggests beta capture opportunities.
-
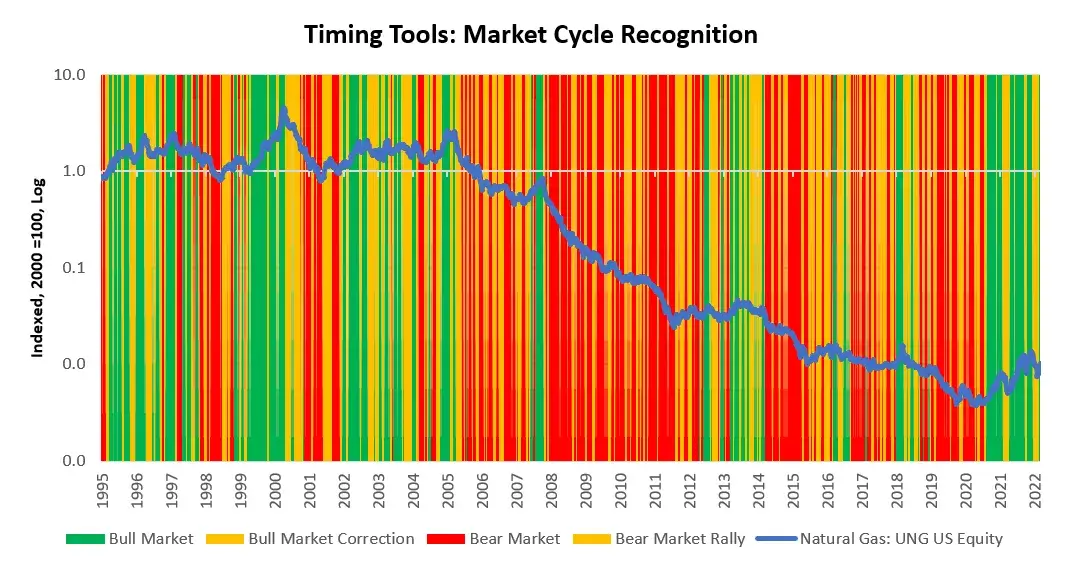
UNG: Natural Gas remains in a Bull Market. Consistent with this, current market pricing suggests beta capture opportunities.
Overall, the big positions in this environment remain on the short side, with the potential to short stocks and bonds. However, current conditions do warrant these shorts; therefore, our systems will wait for better opportunities. We remain at an important junction in the inflation cycle as economic outcomes diverge within the economy. We will continue to help our users manage risk through these transitions and remain well-prepared for the potential stages of the cycle. Until next week.