Cash Is King
Welcome to our official publication of the Prometheus ETF Portfolio. The Prometheus ETF portfolio systematically combines our knowledge of macro & markets to create an active portfolio that aims to offer high risk-adjusted returns, durable performance, & low drawdowns. Given its systematic nature, we have tested the Prometheus ETF Portfolio through decades of history and have shown its durability. For those of you who are unacquainted with our systematic process, we offer a detailed explanation here:
In this publication, we will discuss the performance, positioning, & risks of the Prometheus ETF Portfolio and it will be published every week on Fridays to help investors understand how our systematic process is navigating through markets. Before diving into our ETF Portfolio positions, we think it is essential for subscribers to understand the context within which our systems choose their exposures. Below, we offer our latest Month In Macro note, which contains the conceptual underpinnings of our systematic process within the context of the latest economic data:
Assets rebounded this week, with stocks, bonds, and gold all up on the week:
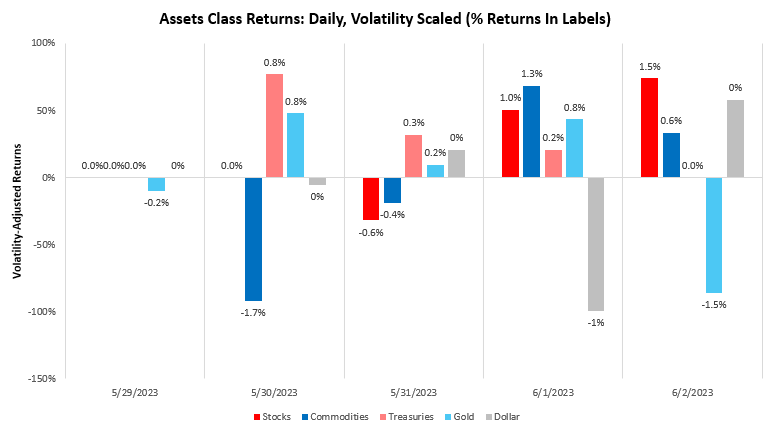
Commodities showed mixed performance, with significant losses during the start of the week weighing on performance. Recent treasury strength continued the recent chop in the market, i.e., moving counter to the recent one-month trend. Below, we show the composition of total treasury market returns over the last month:
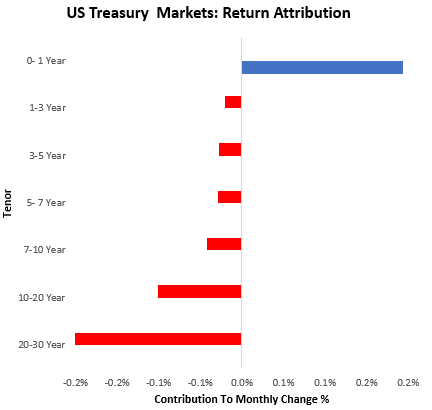
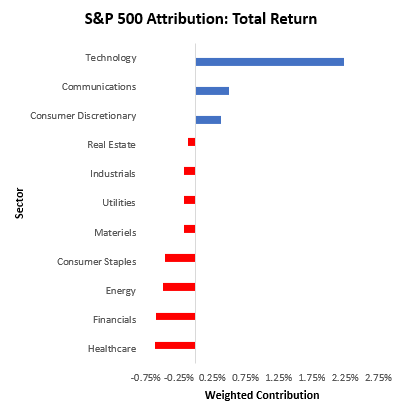
As we can see above, treasuries across the curve continue to show weakness as nominal GDP continues to show resilience. At the same time, equity markets continue to show lopsided performance over the past month, primarily driven by valuations rising:
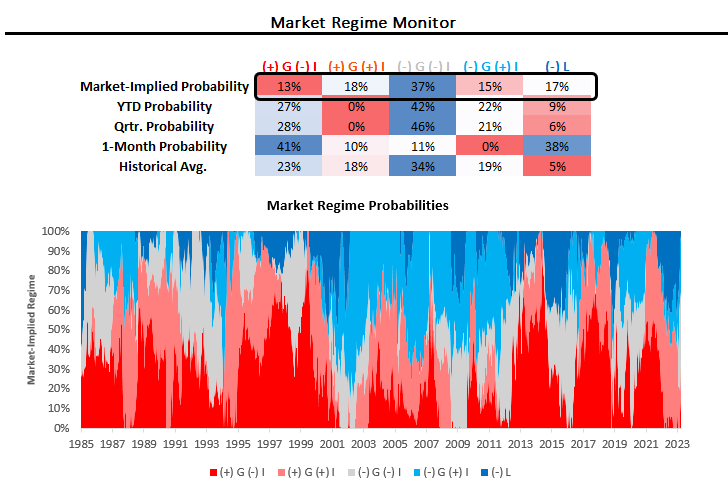
The combination of these moves has improved the odds of a rising growth market regime over the last month. These changes continue to keep the distribution of market regime probabilities as highlighted below:
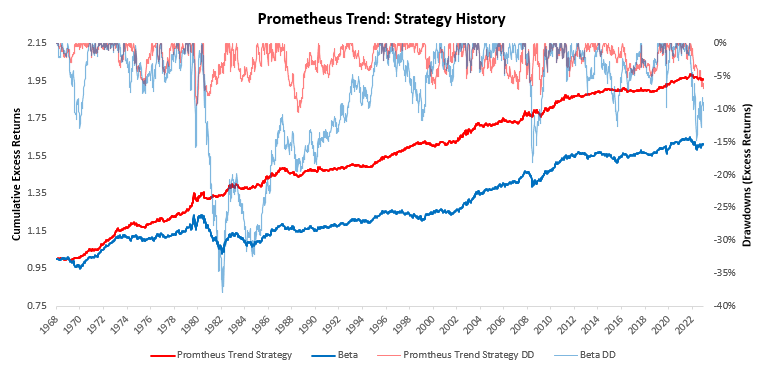
Our non-linear trend process has worked well in navigating these conflicting market regime dynamics. For context we have developed a set of trend filters to help us better evaluate the sustainability of asset-class moves. As always, we have tested these trend measures over time to understand whether they can help reliably generate an edge in markets. As proof of concept, we show how these combined signals have performed relative to an underlying portfolio of the same four assets.
These measures suggest long positions in stocks, flat 10-year Treasuries, short commodities, and long gold.
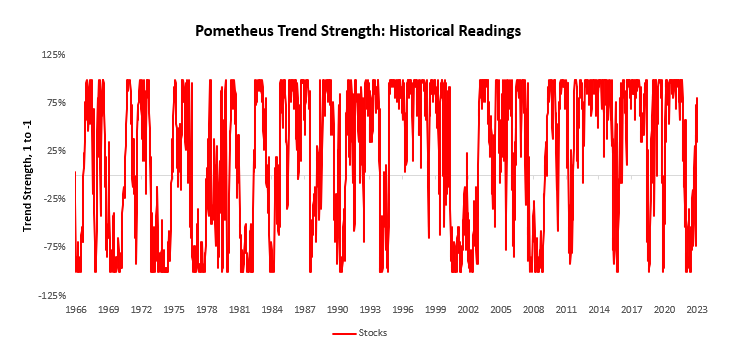
Equity trend strength remains strong for the S&P 500:
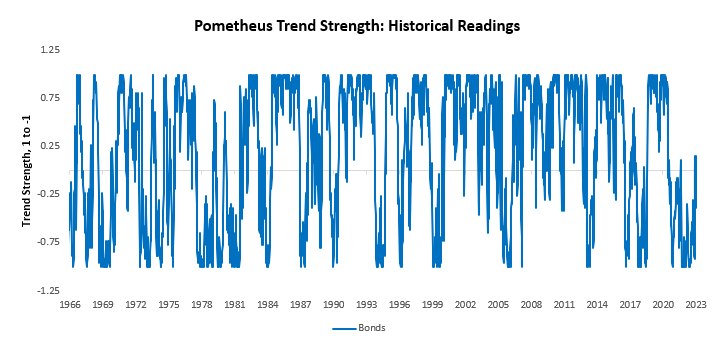
Bonds remain neutral:
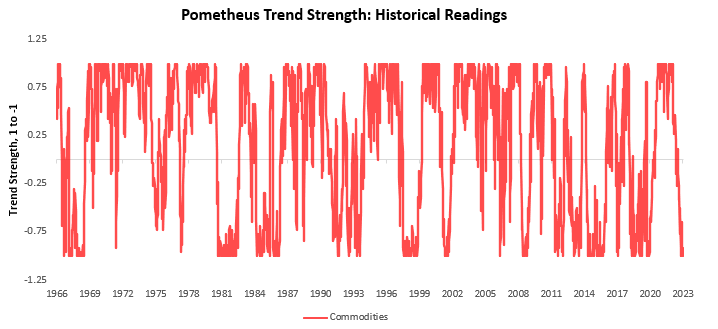
Commodities continue to stay in a strong downtrend:
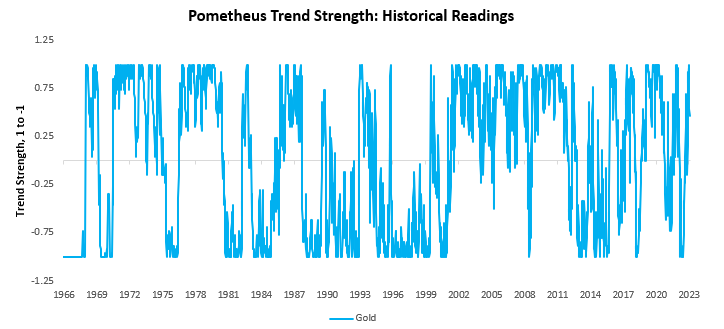
And the upside trend in gold continues to improve:
While S&P 500 trend strength remains strong, we think it is important to recognize that there is significant dispersion within the index. Below, we show equity-sector trend signals.
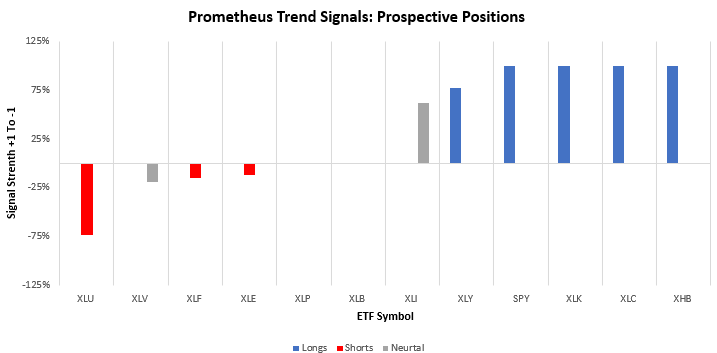
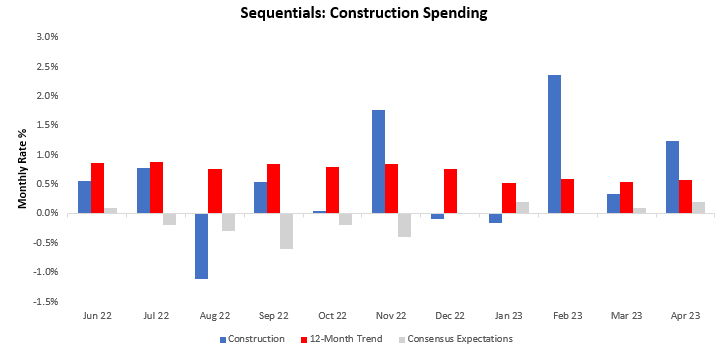
As we can see above, equities continue showing significant trend signal dispersion. We note the trend strength in XHB, i.e., the homebuilders. This is consistent with the recent strength in construction data we received yesterday. The most recent data for April show construction spending increased by 1.24%, with 0.2% and 1.04% coming from residential and nonresidential spending, respectively. This data surprised consensus expectations of 0.2% and contributed to an acceleration in the twelve-month trend.
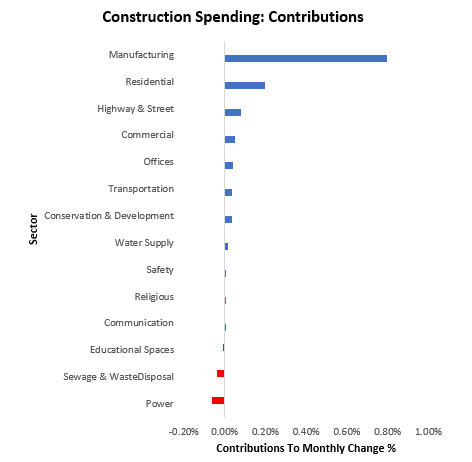
For further context, we show the composition of the most change in monthly construction spending. The strongest contributor to construction spending in April was Manufacturing, while the weakest was Religious construction spending:
As noted previously, residential construction spending has improved recently, with homebuilder price action corresponding to these conditions. This improvement in housing spending has increased our GDP nowcast and our future estimates for real growth.
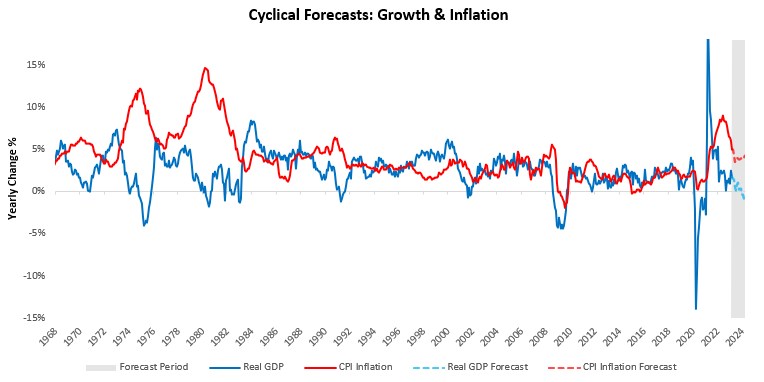
The strength in the latest data pushes our contractionary GDP forecasts out to the first quarter of 2024, with inflation resilient. We estimate end-of-year real GDP growth at 0.4%, with CPI inflation at 3.9%.
The combination of these expected outcomes will likely create a challenging environment for both stocks and bonds. Until profits meaningfully contract, these pressures are likely to be worse for bonds than stocks. When growth turns, it will likely be significantly worse for bonds than stocks. Either way, the outlook for stock and bond portfolios is looking worse relative to the start of this year, where a bout of disinflation supported both. With these big-picture pressures in mind, we turn to our ETF allocations for the next week.
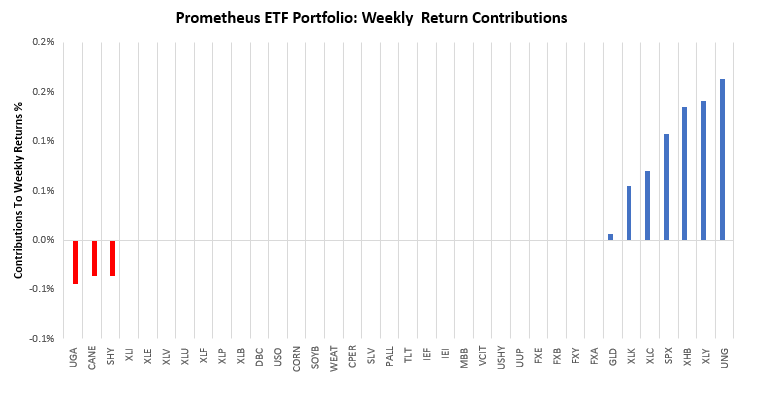
Over the last week, the Prometheus ETF Portfolio was up by 0.6%. Below, we show the contributions to this portfolio performance across securities:
Turning to next week, our systems are looking to position the Prometheus ETF Portfolio, as shown below. The portfolio contains 13 positions heading into next week. We show these below:
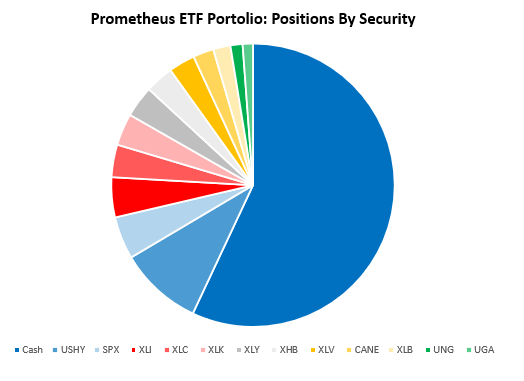
POSITIONS: Cash: 56.98% USHY: 9.5% SPX : 4.86% XLI : 4.56% XLC : 3.71% XLK : 3.64% XLY : 3.59% XHB : 3.24% XLV : -3.02% CANE: 2.36% XLB : -1.97% UNG : -1.38% UGA : 1.17% . Please note if cash position is negative, it implies leverage.
Additionally, we show these positions aggregated into asset class allocations below:
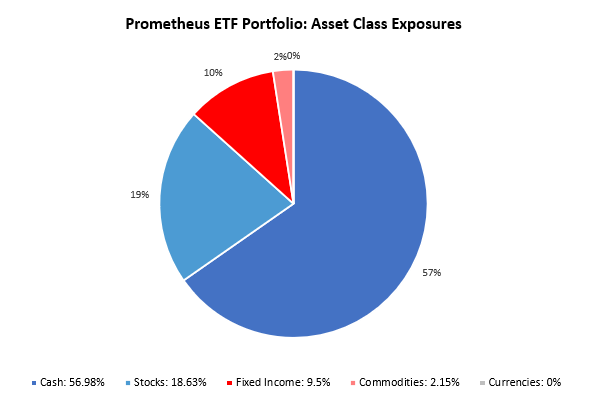
The portfolio has a net exposure (ex-cash) of 30.28%, with a gross exposure (ex-cash) of 43.02%. This allocation has an expected volatility of 5.02%, with a maximum expected volatility of 10%. The picture is shifting towards an environment of sustained stagflationary nominal growth, with a transition into stagflation still likely. Recent data suggest that inflation is likely to remain resilient, creating a difficult outlook for all assets from the policy. Drawdown control remains the most important consideration until macro markets gain certainty of the path for the economy. Until next week.