Markets Price More Growth, Actual Growth Falters
Welcome to our official publication of the Prometheus ETF Portfolio. The Prometheus ETF portfolio systematically combines our knowledge of macro & markets to create an active portfolio that aims to offer high risk-adjusted returns, durable performance, & low drawdowns. Given its systematic nature, we have tested the Prometheus ETF Portfolio through decades of history and have shown its durability. For those of you who are unacquainted with our systematic process, we offer a detailed explanation here:
In this publication, we will discuss the performance, positioning, & risks of the Prometheus ETF Portfolio and it will be published every week on Fridays to help investors understand how our systematic process is navigating through markets. Before diving into our ETF Portfolio positions, we think it is important for subscribers to understand the context within which our systems choose their exposures. Below, we offer our latest Month In Macro note, which contains the conceptual underpinnings of our systematic process within the context of the latest economic data:
As detailed in our Month In Macro note, we believe that the pressures on growth have accumulated and are now likely to cause a downturn in economic activity. This growth dynamic will likely make economic growth the dominant driver of asset returns in 2023 versus inflation, which was the dominant driver of returns in 2022. In this context, a 60/40 stock and bond portfolio has found some respite in 2023 relative to 2022. Over the last week, we have seen a significant improvement in market-implied measures of growth, with commodities rallying and the equity market finding modest support while the Treasury market sold off significantly. We show the path of returns on the major asset classes over the last week below:
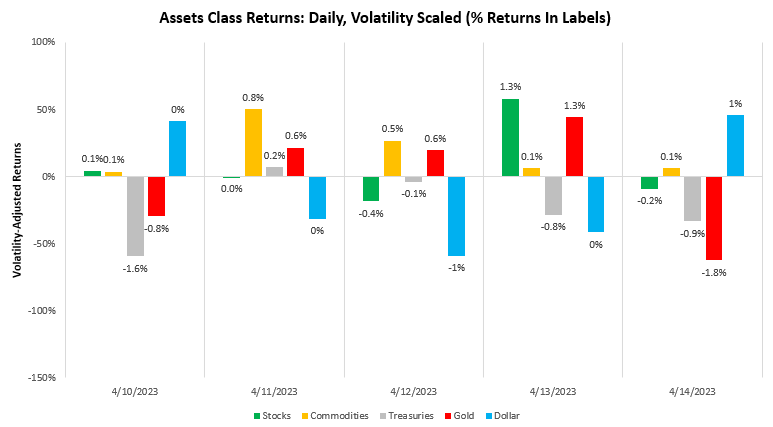
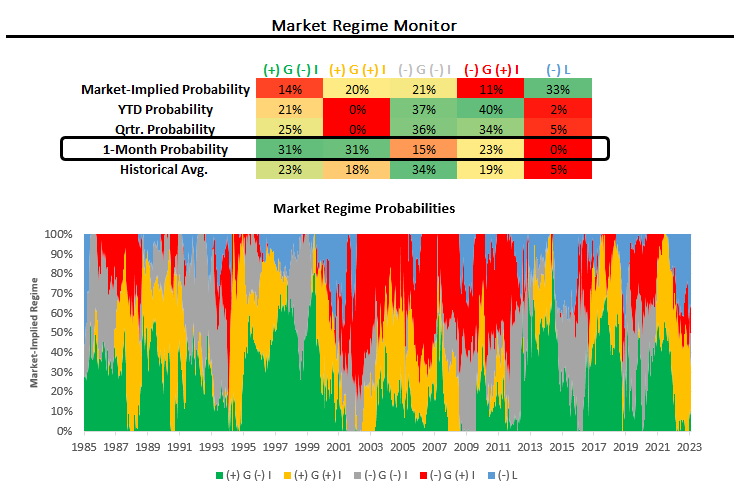
As we can see above, commodities were the best-performing asset during this period, with treasuries generally moving to price higher inflation consistent with these strong commodity prices. Zooming out, the moves added to the one-month marked implied pricing of a rising growth environment:
This shift in market pricing is particularly interesting as it comes at a time when our systematic tracking of conditions shows real GDP data getting worse, not better. Below, we offer our estimates of Monthly GDP, broken into its constituent drivers.
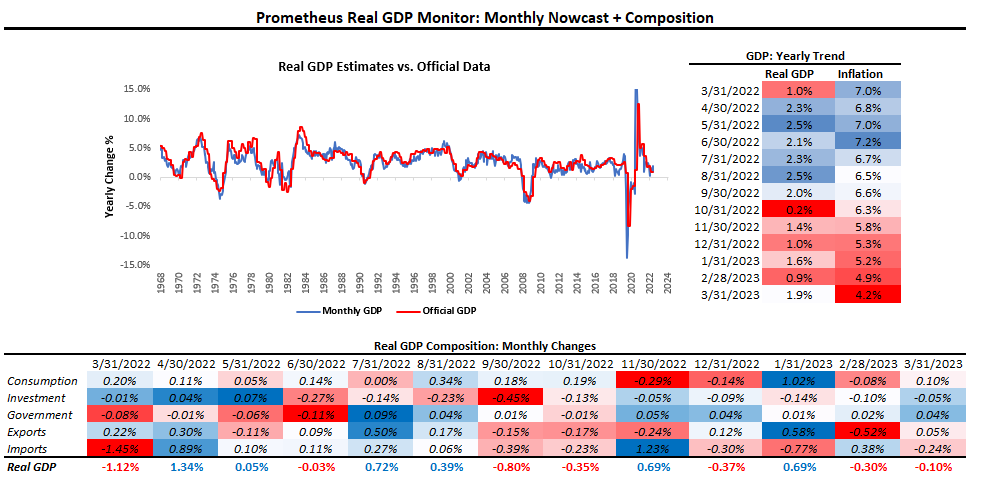
As we can see above, our most recent estimates of real GDP show GDP contracting through March. This estimate is likely to change as we receive more data. However, it is important to note that one of the marginal movers of these estimates has been today’s retail sales report, which showed significant weakness.
Retail Sales decreased -0.99% in March, disappointing consensus expectations of -0.5%. Below, we show the monthly evolution of the data relative to its 12-monthly trend and consensus expectations.
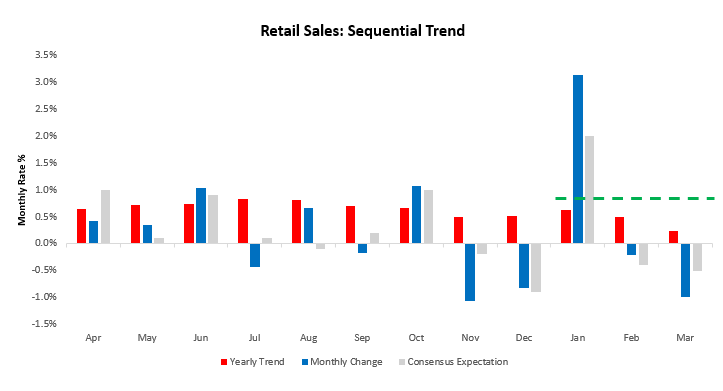
The composition of this weakness showed that the slowdown in nominal spending was broad-based. The primary drivers of this print were Motor vehicle and parts dealers (-0.31%), Gasoline Stations (-0.46%), & General Merchandise (-0.32%). Below, we show the top 10 drivers of the monthly change:
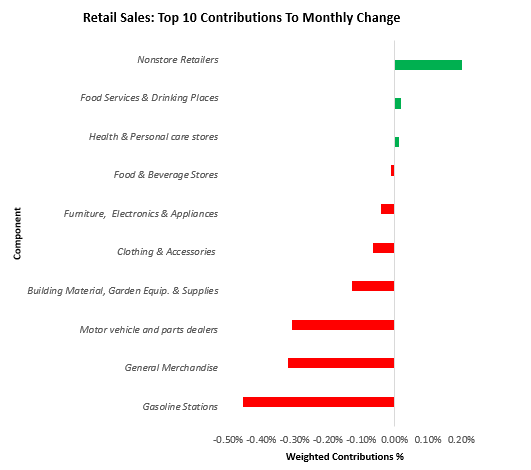
As we can see above, the weakness in nominal spending was broad-based. This comes alongside modest income gains, which showed a very skewed distribution of these gains. Below, we offer the sources of nominal employee income, broken into its macroeconomic drivers, i.e., employment, wages, & hours worked:
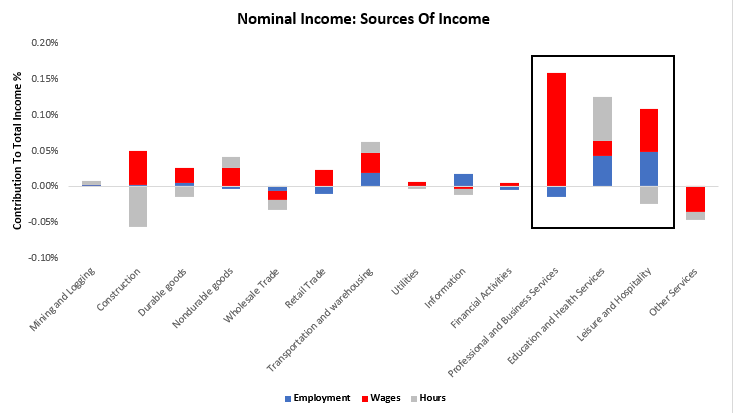
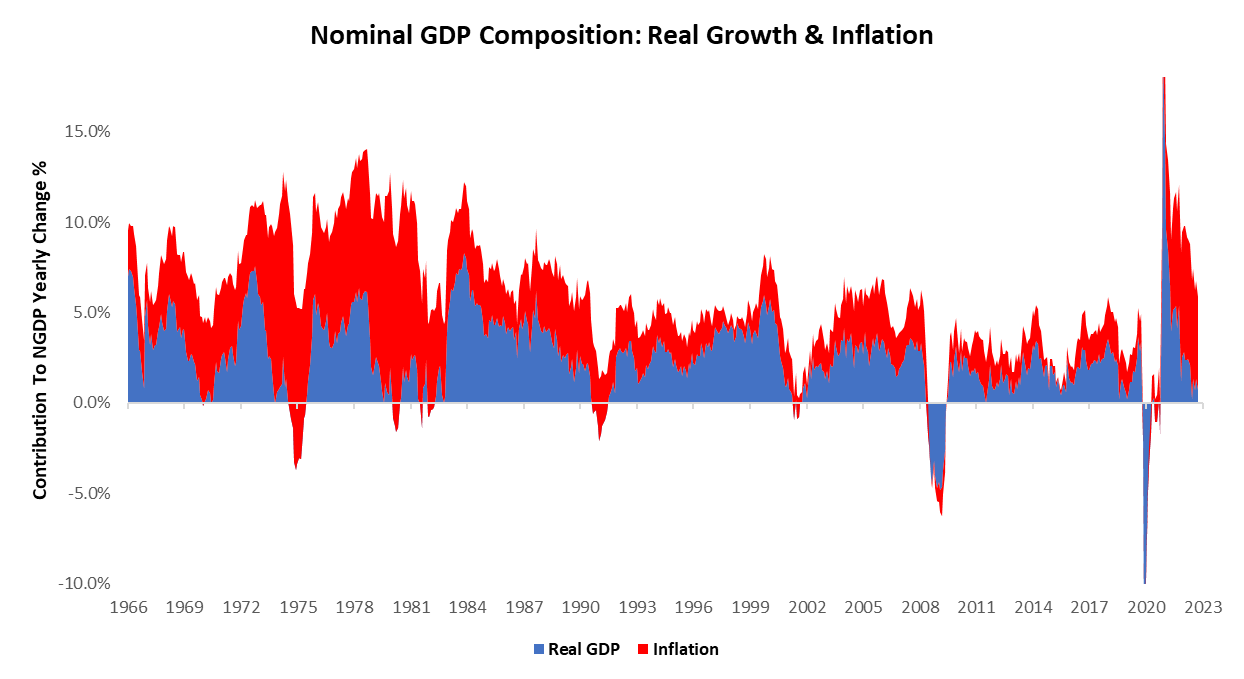
As we can see above, income gains in March were largely skewed toward non-cyclical segments of the economy. Overall, the combination of these measures creates a backdrop where real GDP data has softened, a move incongruent with recent market pricing. Additionally, inflation data slowed as well, the combination of which created a backdrop of decelerating nominal growth in March, which maintains the ongoing downtrend:
Within this context, our systems continue to expect a significant softening of real growth dynamics and an abatement of inflation volatility. At the same time, our systematic Prometheus ETF Portfolio was caught wrong-footed on these expectations, suffering a 1.5% loss. We show the attribution of these returns below:
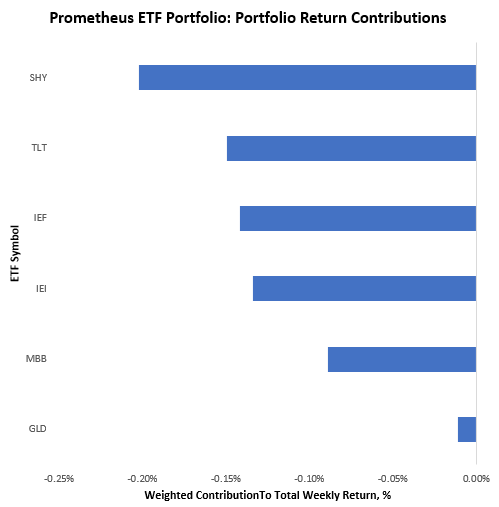
This loss is well within the risk parameters of the portfolio, and we see little cause for concern. Turning to next week, our systems are looking to allocate as follows at the asset class level:
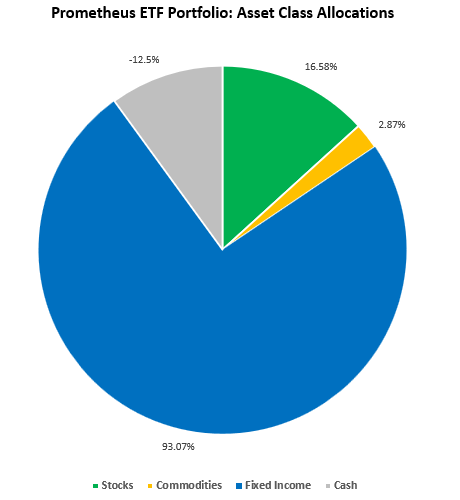
As we can see above, the Prometheus ETF Portfolio continues to have exposures dominated by fixed income, which reflects the expectations of a declining inflation impulse and softening real growth. Below, we show this allocation at the security level:
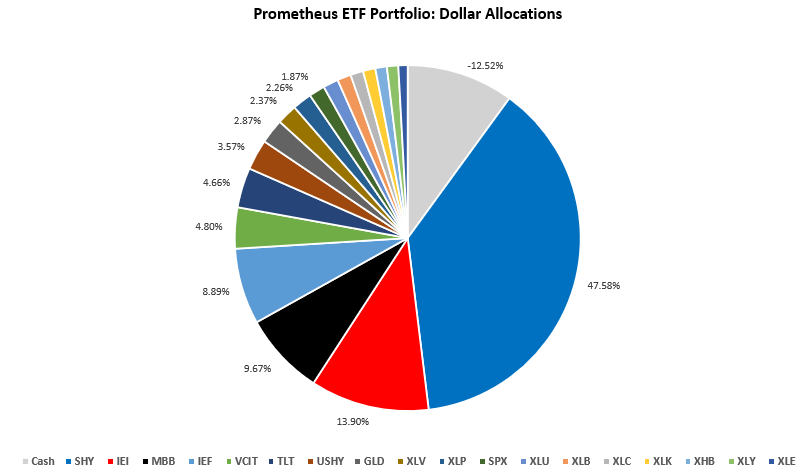
POSITIONS: Cash: -12.52% (leverage) SHY : 47.58% IEI : 13.9% MBB : 9.67% IEF : 8.89% VCIT: 4.8% TLT : 4.66% USHY: 3.57% GLD : 2.87% XLV : 2.37% XLP : 2.26% SPX : 1.87% XLU : 1.78% XLB : 1.6% XLC : 1.49% XLK : 1.45% XHB : 1.34% XLY : 1.33% XLE : 1.08%
This portfolio has an expected volatility of 7.7% and maximum expected volatility of 10%. The lack of meaningful inflation data next week is likely to keep the diversification benefit of having both stocks and bonds in the portfolio intact; nonetheless, given the preponderance of bond beta, the risk remains moderate that maximum volatility will be achieved. Overall, while markets have continued to point to a strengthening of growth expectations, our systematic tracking of conditions leads us to believe that this is not what’s happening under the surface, and our systems stay defensive. We continue to navigate the turn. Until next week.