Long Cash, Short Notes
Welcome to our official publication of the Prometheus ETF Portfolio. The Prometheus ETF portfolio systematically combines our knowledge of macro & markets to create an active portfolio that aims to offer high risk-adjusted returns, durable performance, & low drawdowns. Given its systematic nature, we have tested the Prometheus ETF Portfolio through decades of history and have shown its durability. For those of you who are unacquainted with our systematic process, we offer a detailed explanation here:
In this publication, we will discuss the performance, positioning, & risks of the Prometheus ETF Portfolio and it will be published every week on Fridays to help investors understand how our systematic process is navigating through markets. Before diving into our ETF Portfolio positions, we think it is essential for subscribers to understand the context within which our systems choose their exposures. Below, we offer our latest Month In Macro note, which contains the conceptual underpinnings of our systematic process within the context of the latest economic data:
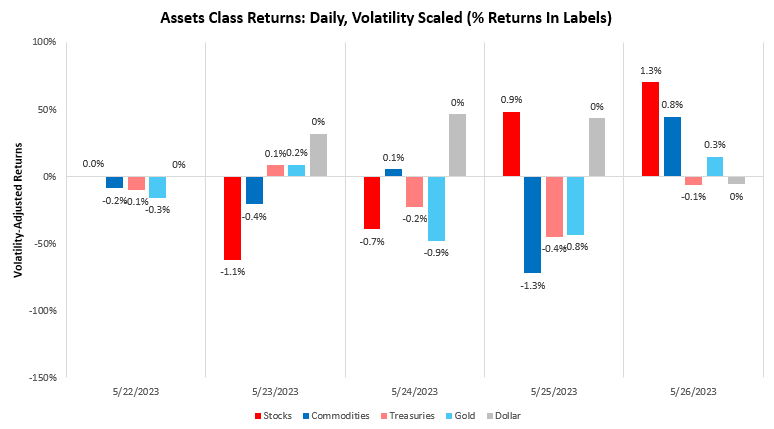
Assets showed mixed performance last week, with stocks up modestly while commodities, treasuries, and gold faltered. The dollar showed significant strength relative to these assets. Below, we show the path of asset markets over the last trading week:
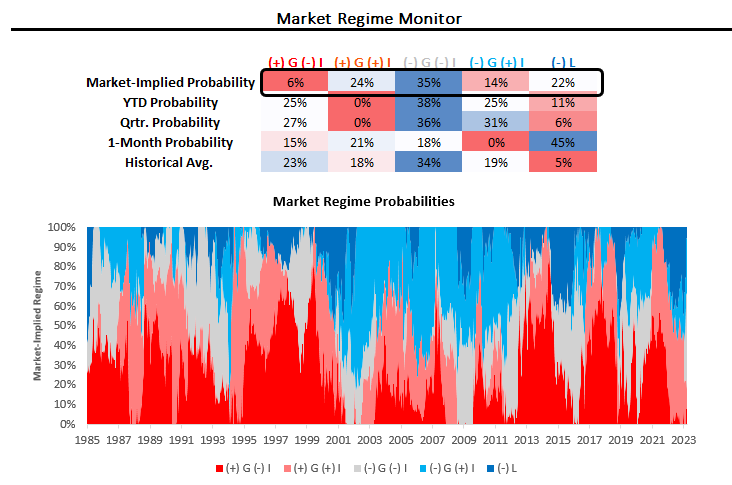
The combination of these moves added to our market-implied odds of tightening liquidity conditions, further flattening the distribution of outcomes for the market, i.e., markets remain indecisive about the current market regime. We show our market regime probabilities below:
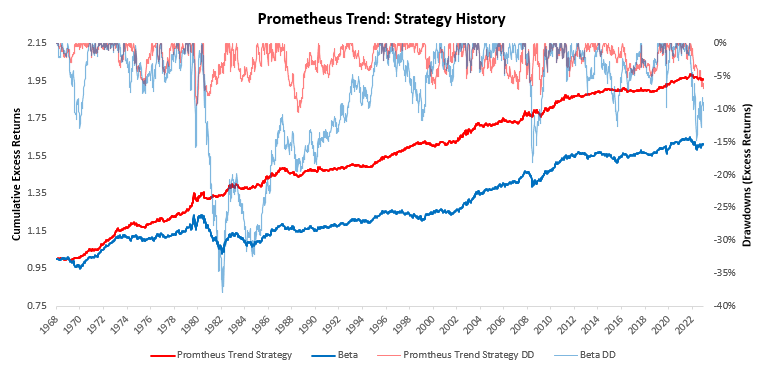
To help contextualize and profit from macroeconomic asset-class moves, we have developed a set of trend filters to help us better evaluate the sustainability of asset-class moves. As always, we have tested these trend measures over time to understand whether they can help reliably generate an edge in markets. As proof of concept, we show how these combined signals have performed relative to an underlying portfolio of the same four assets.
These measures suggest long positions in stocks, flat 10-year Treasuries, short commodities, and long gold.
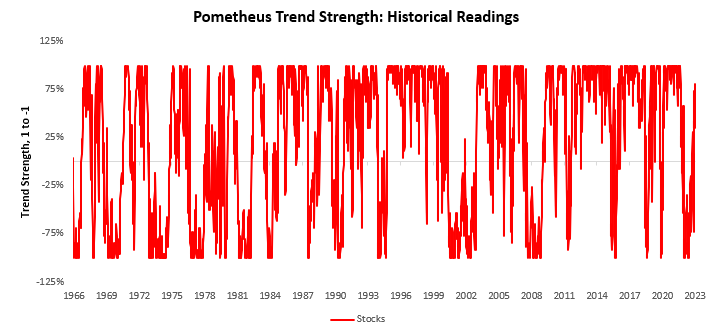
Trend strength remains strong in stocks:
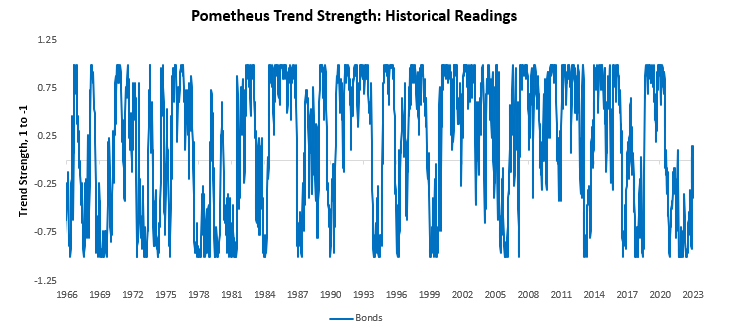
While bonds continue to chop:
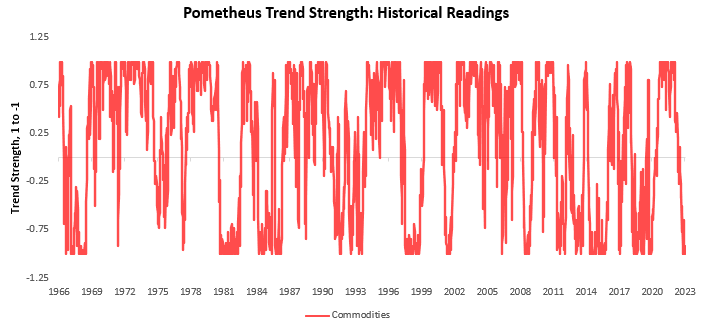
Commodities signals continue to point to short opportunities:
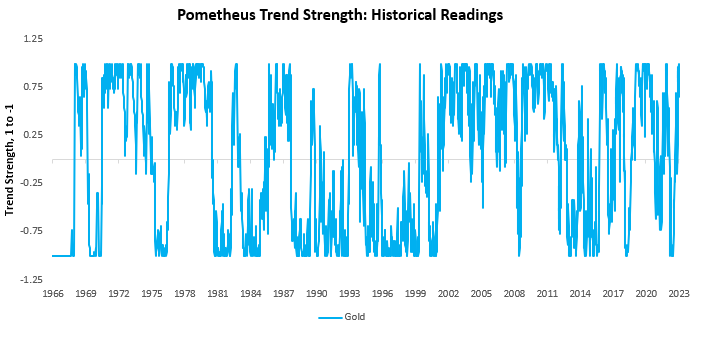
And gold continues to offer attractive trend signals by our measures:
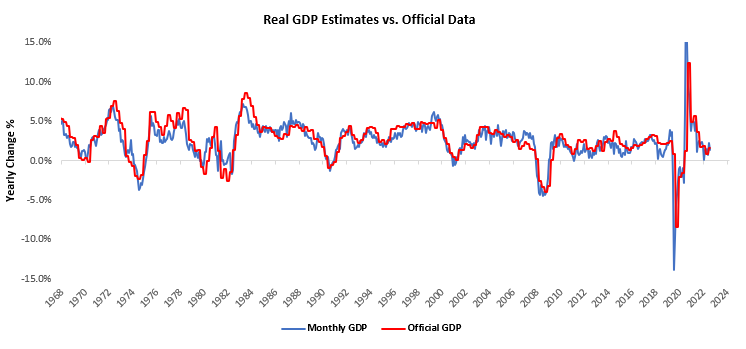
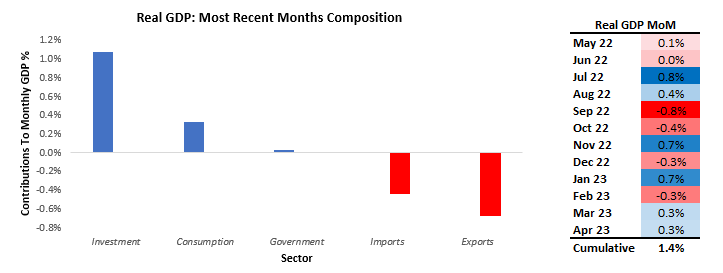
Remember that these signals may not always conform with those in the Prometheus ETF Portfolio due to different objectives and the inclusion of economic factors in the Prometheus ETF Portfolio. However, when these signals align, we have a higher confidence level. In today’s context, we must note the continued mixed reading from bond trend factors. Markets continue to discount aggressive monetary policy easing by the Federal Reserve only to be disappointed as data emerges to suggest this is unlikely. This sustained pattern in markets continues to create mixed trend readings in bonds. The next likely sustained trend in bonds (if any) will be when bond market discounting aligns with the fundamental economic picture. Said differently, the next sustained trend in bonds is likely to be if we begin to see recessionary conditions that force the Federal Reserve to cut interest rates more than currently discounted. Currently, it doesn’t look like we will get there in the very near term. We have seen this dynamic in our latest GDP estimates. Through April, our systems place Real GDP growth at 1.37% versus one year prior. Below, we show our monthly estimates of Real GDP relative to the official data:
Below, we show the weighted contributions to the most recent one-month change in real GDP, along with the recent history of month-on-month GDP. Additionally, we show the contribution by sector to monthly GDP in the table below. April saw an improvement in investment activity, contributing significantly to GDP data:
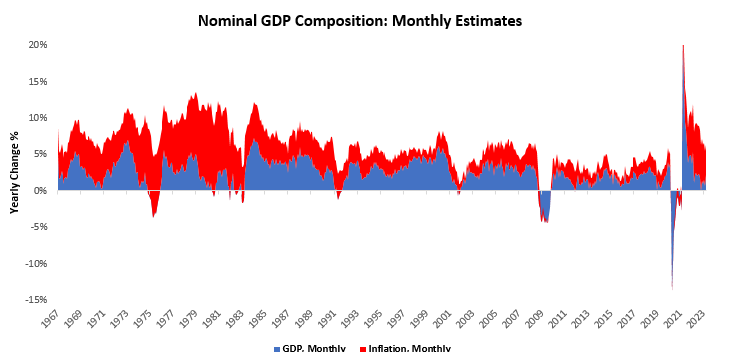
Combined with our inflation estimates, this place nominal GDP at 5.31% versus one year prior:
Overall, this picture does not look like one where inflationary pressures have cooled adequately for the Fed to begin the easing of monetary policy. Against this backdrop, markets continue to be indecisive about their pricing of nominal growth conditions, which remain roughly unchanged (though somewhat recomposed, with a bias towards higher real growth vs. inflation).
We do not gain our economic views based on market pricing. However, consistent market pricing is required for us to exploit our economic views. Our systematic view is that we are headed toward a stagflationary recession. This suggests contracting real GDP growth and higher than comfortable nominal spending, creating inflation above the Fed’s inflation target. Within this bigger picture view, we have also flagged that markets will likely price the slowing of inflationary pressures following last year’s price shocks we think a significant part of this move is likely to be behind us. Looking ahead, headwinds continue to accumulate for assets. We think capital preservation is the most important thing today as these macro cross-currents resolve themselves. The time to ride consistency in macro market pricing will come, and we expect to participate significantly when it does.
Turning to our ETF Portfolio over the last week, the Prometheus ETF Portfolio was down by -0.06%. Below, we show the contributions to this portfolio performance across securities:
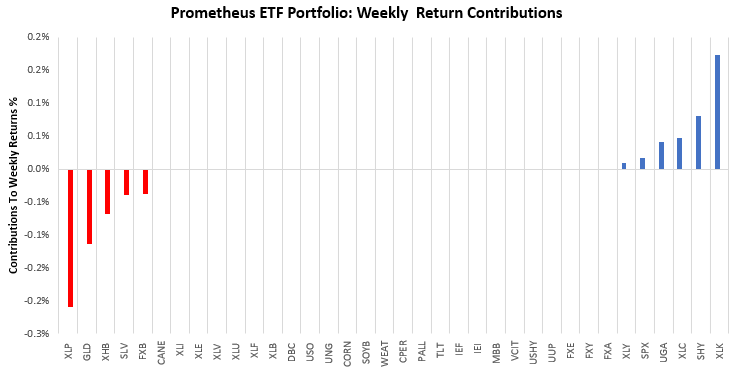
While our bet on shorting Treasuries paid off, we also see that positions in gold and consumer staples dragged on performance. Turning to next week, our systems are looking to position the Prometheus ETF Portfolio, as shown below. The portfolio contains 11 positions heading into next week. We show these below:
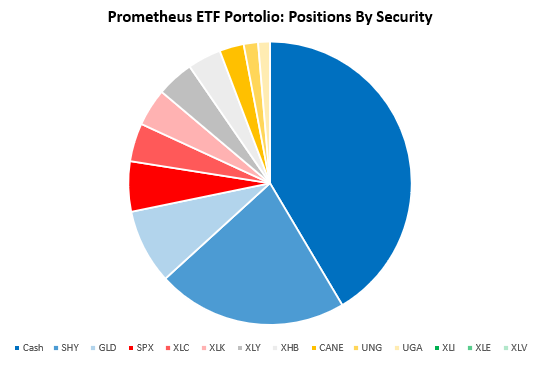
POSITIONS: Cash: 41.48% SHY : -21.76% GLD : 8.53% SPX : 5.73% XLC : 4.37% XLK : 4.28% XLY : 4.25% XHB : 3.83% CANE: 2.78% UNG : -1.64% UGA : 1.35% . Please note if cash position is negative it implies leverage.
Additionally, we show these positions aggregated into asset class allocations below:
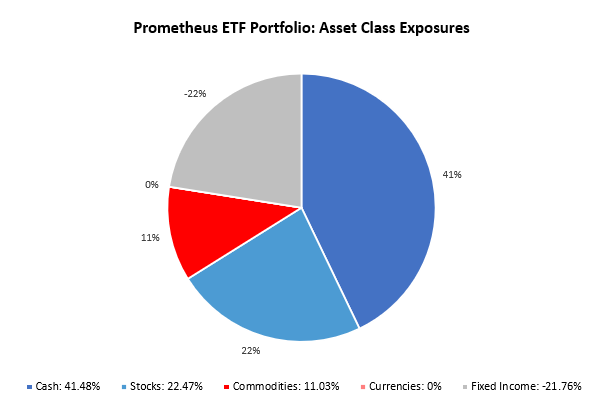
The portfolio has a net exposure (ex-cash) of 11.74%, with a gross exposure (ex-cash) of 58.52%. This allocation has an expected volatility of 5%, with a maximum expected volatility of 10%. We think there is a modest potential for achieving maximum volatility, with a significant amount of labor market data later next week which may impact growth-sensitive positions in stocks and commodities in unison. However, these would be somewhat offset by fixed-income shorts, which would benefit from the pricing of further Fed tightness. Markets remain indecisive on macroeconomic outcomes, and managing volatility here is essential. Until next time.