Staying Long Stocks & Bonds
Welcome to our official publication of the Prometheus ETF Portfolio. The Prometheus ETF portfolio systematically combines our knowledge of macro & markets to create an active portfolio that aims to offer high risk-adjusted returns, durable performance, & low drawdowns. Given its systematic nature, we have tested the Prometheus ETF Portfolio through decades of history and have shown its durability. For those of you who are unacquainted with our systematic process, we offer a detailed explanation here:
In this publication, we will discuss the performance, positioning, & risks of the Prometheus ETF Portfolio and it will be published every week on Fridays to help investors understand how our systematic process is navigating through markets. Before diving into our ETF Portfolio positions, we think it is important for subscribers to understand the context within which our systems choose their exposures. Below, we offer our detailed Month In Macro note, which contains the conceptual underpinnings of our systematic process within the context of the latest economic data:
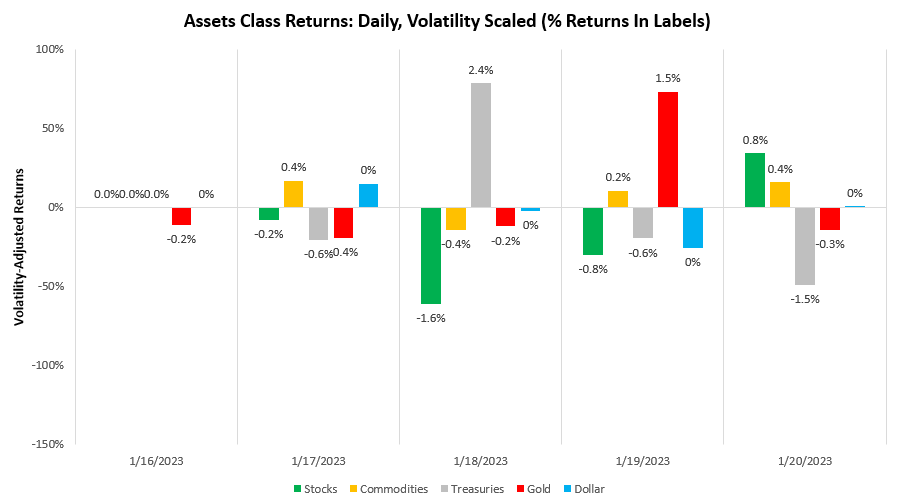
After taking a break for the holiday season, our team will resume publishing Month In Macro for 2023, starting with the January edition. We highly recommend you catch up on our outlook prior to our next release. Turning to the week that was, we saw markets in flux, ending the week with markets pricing inflationary conditions:

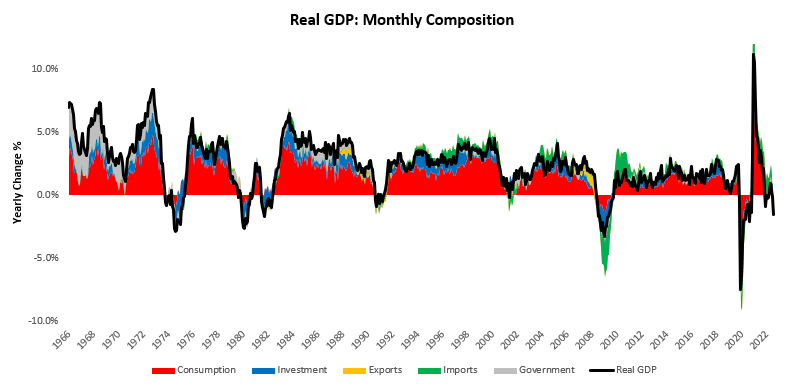
This market pricing came amidst economic data that continued to signal a weakening economy. Our latest estimates of US real GDP now show growth in contraction:
For those looking for more detail on the underlying drivers of these estimates, you can find our updates here:
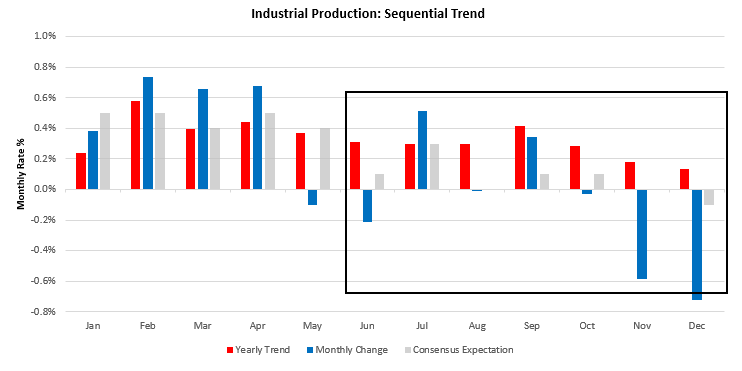
It is important to note that we are seeing a broad-based weakening of the manufacturing sector, which we have expected to be the next step toward a profit contraction. This week’s industrial production offered further confirmation of this incremental trend. Industrial production decreased -0.72% in December, disappointing consensus expectations of -0.1%. This print contributed to a sequential deceleration in the quarterly trend relative to the yearly trend. Below, we show the monthly evolution of the data relative to its 12-month trend and consensus expectations.
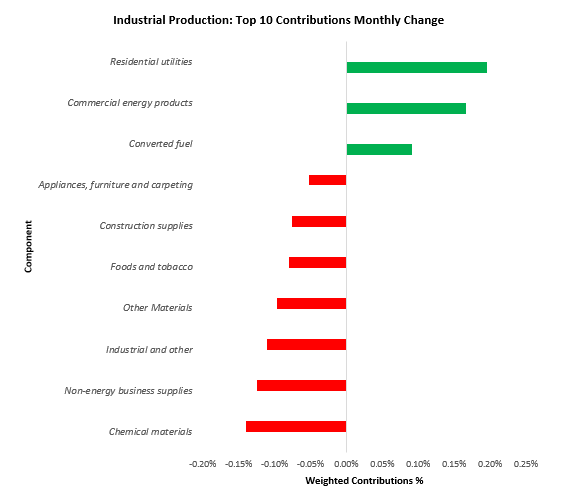
As we have noted, these declines have been broad-based, which we show below:
Consistent with this weakness in real output, we have seen a weakening in production-related real incomes. Below, we show our estimates of employee compensation to showcase the bifurcation in total employee compensation in the economy, separated into two categories: those sectors with increasing real income vs. those with declining real income:
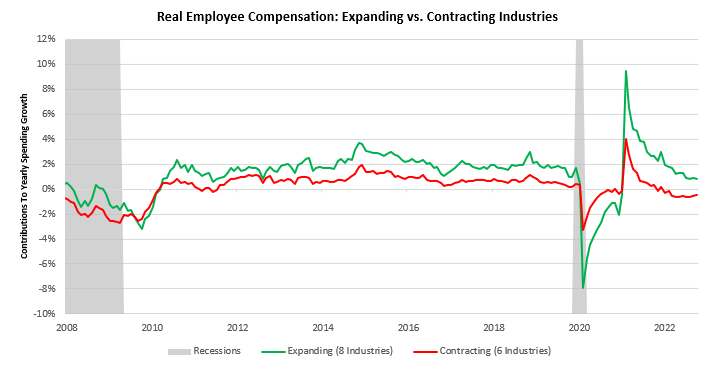
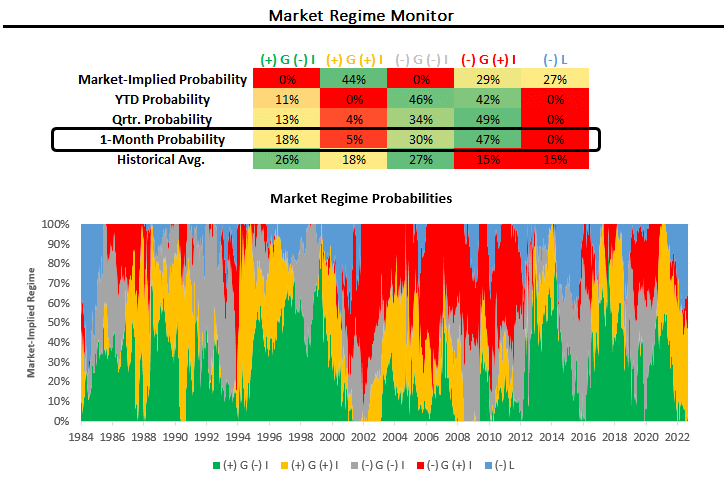
Industries with contracting incomes are goods, trade, and financial services. This divergence in real incomes is typically seen during turning points in the economic cycle, and weakness is likely to spread. This declining growth impulse can be seen in markets through the lenses of our market regime monitors, which show an increasing market pricing of slowing growth regimes, i.e. (-) G regimes, over the last month:
The question ahead of us is whether this transient market pricing can sustain itself. Our expectations for economic activity suggest that it will likely do so. Furthermore, our expectation remains that inflation volatility will likely reduce significantly while growth volatility remains elevated. Consistent with these expectations, our systems have positioned the Prometheus ETF Portfolio to have long exposures to long exposures to stocks and bonds, i.e., a growth-neutral bet on a slowing inflation impulse. These positions suffered a loss of 0.40% this week as markets reversed during the second half of the week. We show the portfolio contributions below:
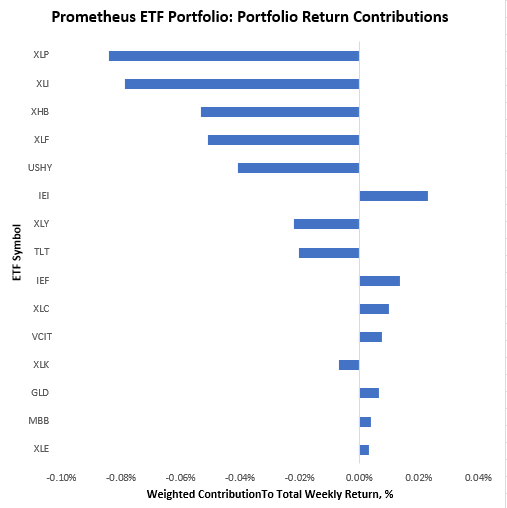
Our equity positions generally weighed on the portfolio, and we see potential conditions evolving to support a complete exit from equity positions with eventual short opportunities. This would come alongside a sizing up of gold and fixed-income positions however, we are not there yet. Heading into next week, our systems are looking to position as follows:
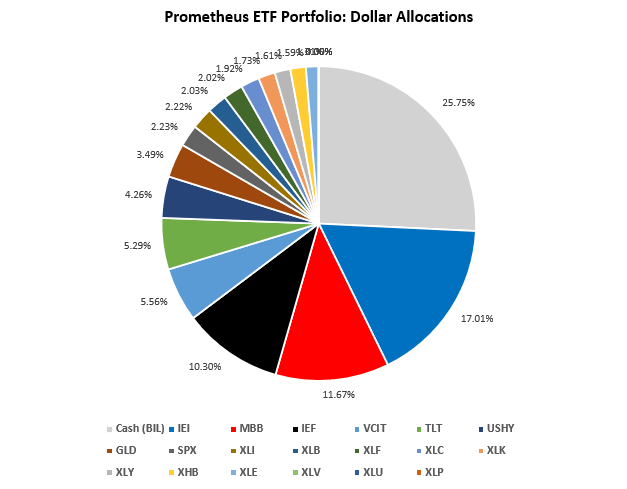
SIZING: IEI : 17.02% MBB : 11.67% IEF : 10.3% VCIT: 5.55% TLT : 5.29% USHY: 4.27% GLD : 3.49% SPX : 2.23% XLI : 2.23% XLB : 2.03% XLF : 2.02% XLC : 1.92% XLK : 1.73% XLY : 1.61% XHB : 1.59% XLE : 1.31%
For visual simplicity, we show the same, grouped into asset class exposures:
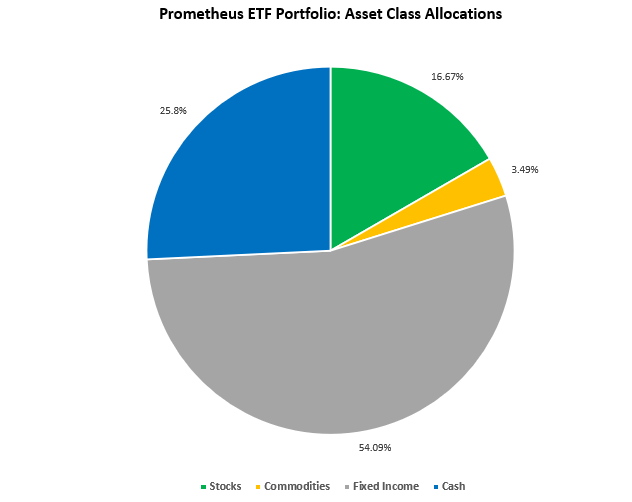
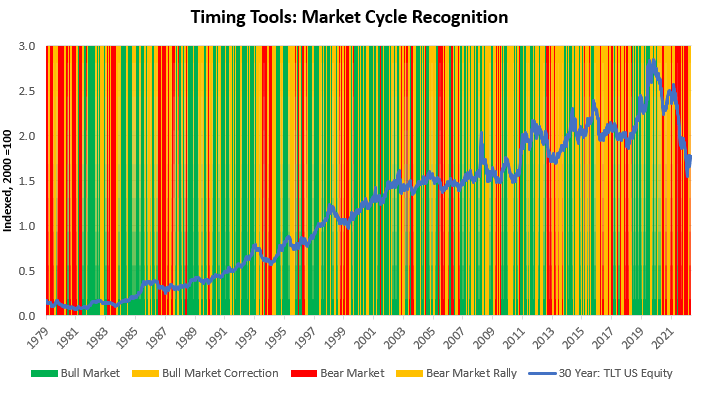
This allocation has an expected volatility of 7.8% and a maximum expected volatility of 10%. Barring PCE data next week, most data is tilted toward growth. PCE data is unlikely to be majorly market-moving as it corresponds with CPI. Therefore, we expect our growth-neutral allocation to have a low probability of achieving maximum volatility. For further context, we provide some commentary on select assets below. We focus on tenors across the Treasury curve to show the consistency in a potential regime change being signaled across the curve:
-
TLT: 20-30 Year remains in a Bear Market Rally. Bear market rallies can initiate regime change, and current market pricing suggests beta capture opportunities.
-
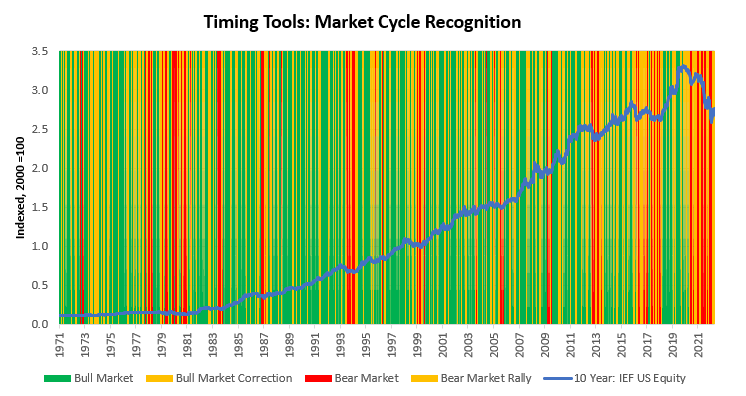
IEF: 10 Year remains in a Bear Market Rally. Bear market rallies can initiate regime change, and current market pricing suggests beta capture opportunities.
-
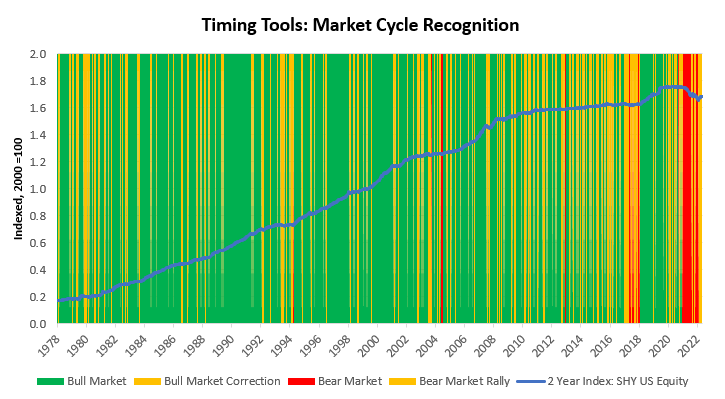
SHY: 2-Year Index remains in a Bear Market Rally. Bear market rallies can initiate regime change, and current market pricing suggests beta capture opportunities.
We continue to navigate a transition into a contractionary growth environment. The transition continues to form, but uncertainty remains. Navigating this turn will be important to avoid drawdowns in lieu of the next regime, whatever it may be. Until next time.
Hello! Do you know if they make any plugins to assist with Search Engine Optimization? I’m trying to get my website
to rank for some targeted keywords but I’m not seeing
very good gains. If you know of any please share.
Thanks! You can read similar art here: Wool product
Hey! Do you know if they make any plugins to assist with SEO?
I’m trying to get my blog to rank for some targeted keywords but I’m not seeing very good gains.
If you know of any please share. Thank you! I saw similar article here: Your destiny
I’m extremely impressed together with your writing
talents as neatly as with the structure on your blog. Is this a
paid subject or did you modify it yourself? Anyway
keep up the nice quality writing, it is uncommon to look a nice blog like this one today.
HeyGen!
I am really impressed along with your writing skills as
well as with the format to your weblog. Is that this a paid subject matter or did you customize it your self?
Either way keep up the excellent high quality
writing, it is rare to peer a nice blog like this one these days.
Blaze ai!
I’m extremely impressed together with your writing talents and also with the layout in your blog. Is this a paid topic or did you modify it yourself? Either way keep up the nice quality writing, it is rare to peer a great blog like this one these days. I like prometheus-research.com ! My is: Instagram Auto follow