Long Cash & Diversified Beta
Welcome to our official publication of the Prometheus ETF Portfolio. The Prometheus ETF portfolio systematically combines our knowledge of macro & markets to create an active portfolio that aims to offer high risk-adjusted returns, durable performance, & low drawdowns. Given its systematic nature, we have tested the Prometheus ETF Portfolio through decades of history and have shown its durability. For those of you who are unacquainted with our systematic process, we offer a detailed explanation here:
In this publication, we will discuss the performance, positioning, & risks of the Prometheus ETF Portfolio and it will be published every week on Fridays to help investors understand how our systematic process is navigating through markets. Before diving into our ETF Portfolio positions, we think it is important for subscribers to understand the context within which our systems choose their exposures. Below, we offer our latest Month In Macro note, which contains the conceptual underpinnings of our systematic process within the context of the latest economic data:
Over the last week, risk assets posted weak performance, consistent with a tightening of liquidity conditions. Assets broadly showed weak performance this week, with commodities showing significant losses:
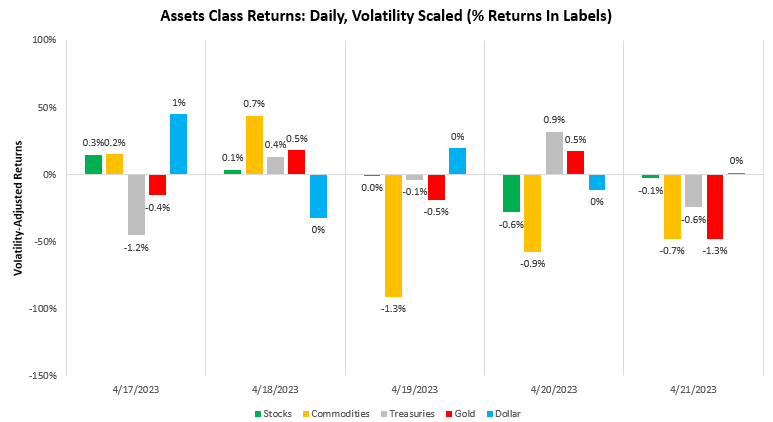
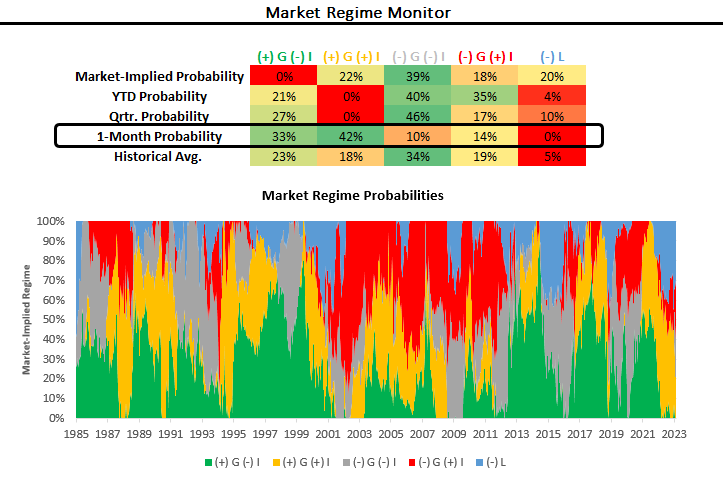
These markets movements were a pull-back in the conditions we have seen over the last month, during which markets primarily priced rising growth conditions:
Zooming out, we show the big-picture evolution of market pricing of growth and inflation below:
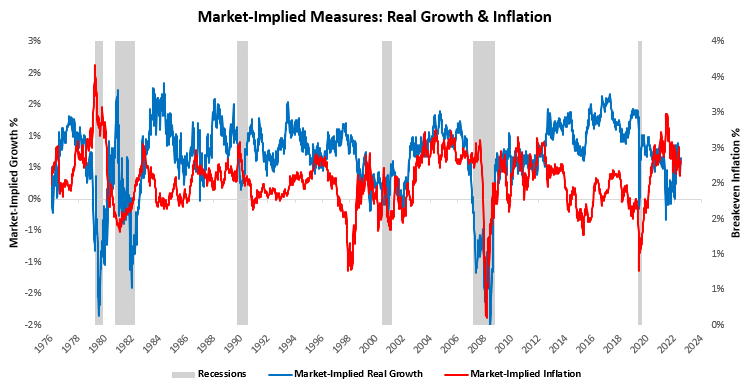
As we can see above, after peaking in April 2022, markets have largely moved to price-in lower inflation expectations. Around the same time, our market-implied measures of real growth bottomed and continued to show improvement, though not enough to outweigh cross-asset inflationary pressures, resulting in markets pricing stagflationary nominal growth. In 2023, markets have gone back and forth on both growth and inflation expectations, leaving them roughly flat. We zoom in on these measures below:
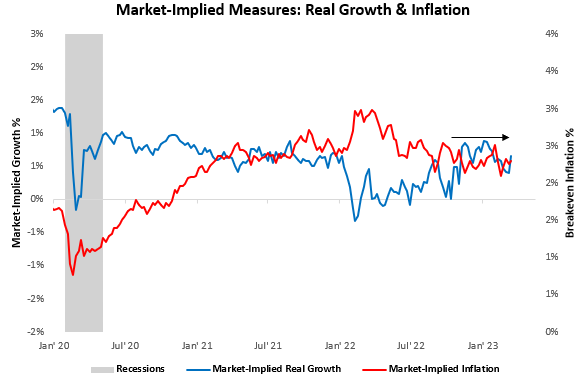
Overall, markets have continued to price stable nominal growth outcomes. This pricing has been partly consistent with our expectations and partly not. Our expectations were two-fold. First, our systems guided us to think that inflation would be likely moderate to a number well above the Feds target but with considerably less volatility. This expectation has played out as expected and has been the primary support to a portfolio of stocks and bonds.
Second, our estimates of future growth led us to believe that economic data would begin to deteriorate meaningfully in H2 of this year, as we detailed in our Month In Macro. While we have seen some degree of sequential softening in monthly data, market pricing has been far from recessionary thus far.
Below, we show our updated Real GDP Monitor, which updates our GDP estimates weekly as new data is available one of many new tools which will be available to subscribers on a daily basis:

As we can see, while data in January was strong, subsequent months have shown softening and looking through the drivers of the economic cycle, we find it likely that the growth data will continue to worsen. While having a wide array of indicators and signals that continue to point to this trajectory, we think it is important to evaluate this expectation, given recent market pricing.
It is crucial to recognize that the ongoing slowdown in economic activity is likely to be different from previous cycles for two reasons. First, the increase in household cash balances relative to income alongside heightened nominal activity is likely to keep nominal spending more resilient than otherwise. Below, we show the spike in savings coming from government transfers that enabled heightened nominal spending by households:
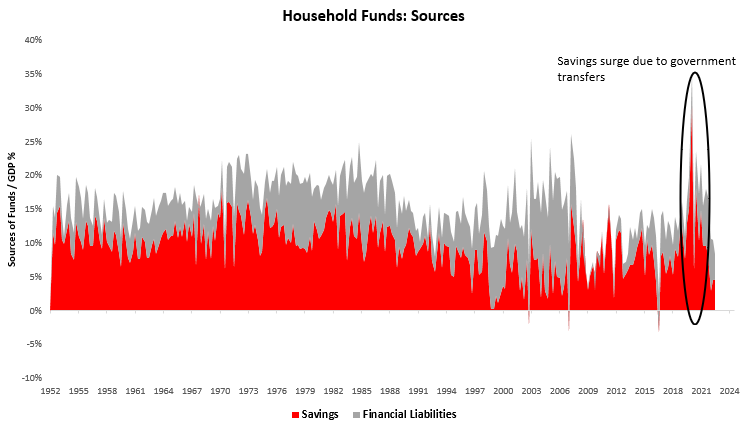
This means that deposits and other short-term monetary balances were a large source of financial asset purchases and, eventually, spending. While this has indeed been true, the impulse of this increase in cash balances relative to GDP continues to fade. In fact, short-term deposits and money market fund deposits are in aggregate in contraction:
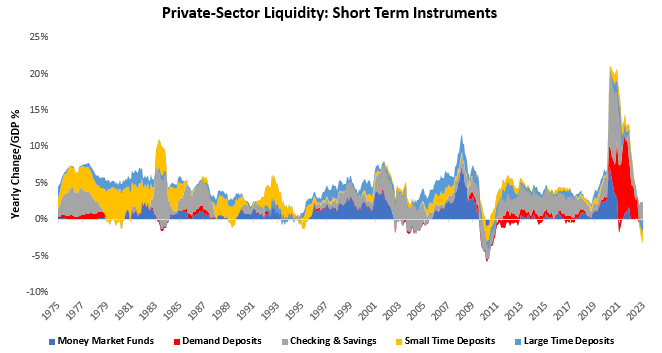
While the contraction in these liquid cash balances has begun, it is only likely to worsen as quantitative tightening proceeds. Therefore, we think it is less and less likely that the sale of these assets to finance consumption will continue to push the economic cycle forward.
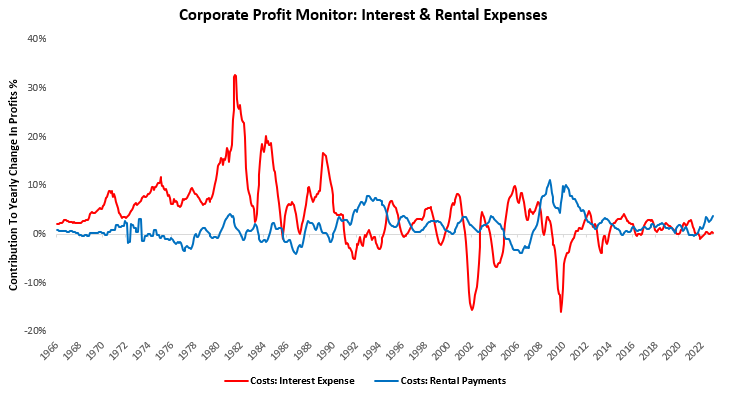
The second reason the ongoing slowdown in economic activity is likely to be different from previous cycles is the pace at which the Federal Reserve hiked interest rates. During usual economic cycles, the Fed hikes far more gradually, which allows the impacts of interest rate hikes to flow through to corporations’ interest expenses. We have yet to see this happen.
Below, we show our estimates for corporate interest payments and rental expenses from our Profits Monitor while will also soon be available to subscribers daily:
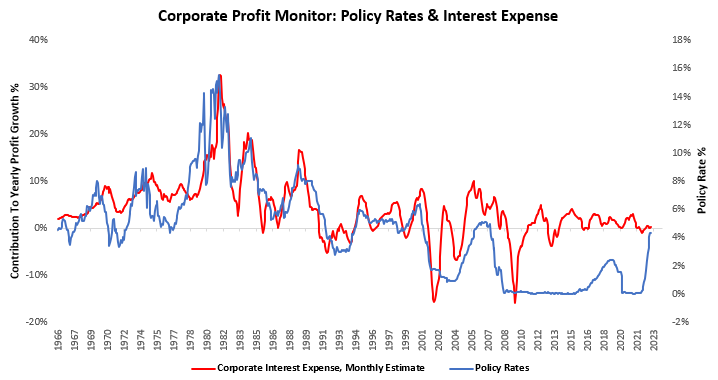
Below, we show how policy rates have typically resulted in higher interest expenses for businesses:
Therefore, looking at these drivers of current conditions, we think that these tailwinds are largely behind us rather than ahead of us. Thus, when we assess our current expectations and signals, our expectations remain roughly the same, i.e., we are likely to see lower inflation volatility and higher growth volatility in 2023 than in 2022, and markets will move accordingly. Nonetheless, it is important to recognize that nominal growth market pricing remains flat thus far. We will only look to benefit from deteriorating growth conditions once they begin to show in markets, not before, i.e., we swim with the tide.
With these expectations in mind, we turn to our positioning for next week. Our positions this week suffered a 0.20% loss, largely coming from fixed-income bets:
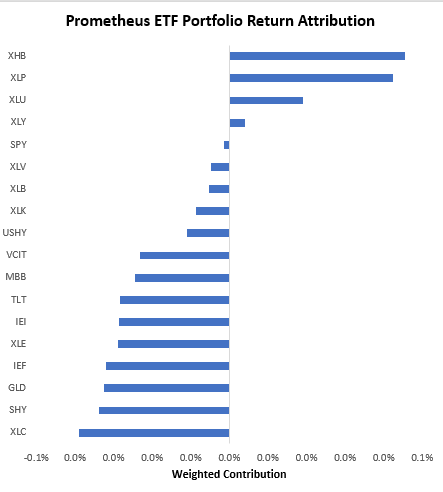
Turning to next week, our systems are looking to position the Prometheus ETF Portfolio as follows:
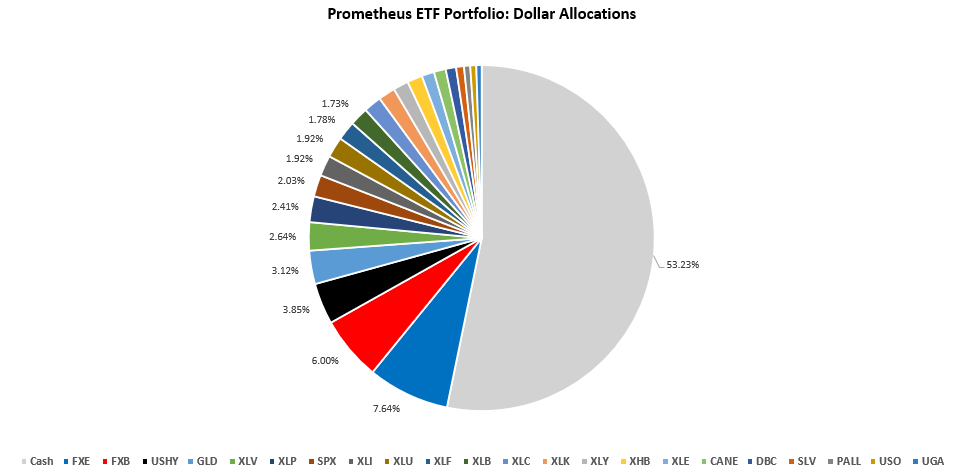
POSITIONS: Cash: 53.23% FXE : 7.64% FXB : 6% USHY: 3.85% GLD : 3.12% XLV : 2.64% XLP : 2.41% SPX : 2.03% XLI : 1.92% XLU : 1.92% XLF : 1.78% XLB : 1.73% XLC : 1.67% XLK : 1.58% XLY : 1.43% XHB : 1.42% XLE : 1.17% CANE: 1.11% DBC : 0.97% SLV : 0.73% PALL: 0.58% USO : 0.56% UGA : 0.5%
Below, we show the portfolio at the asset class level:
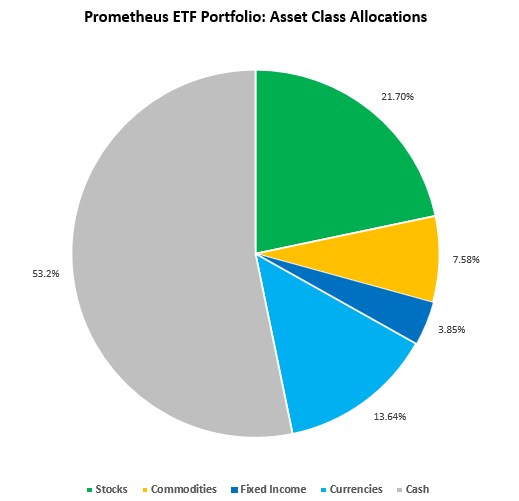
This portfolio has an expected volatility of 7.7%, with a maximum expected volatility of 10%. The portfolio reflects a broad bet on assets, driven by an improvement in liquidity conditions catalyzed by the Federal Reserve. It is unlikely this liquidity improvement will continue to support markets indefinitely. However, we trade the market that is in front of us. Overall, signal strength remains low across assets as our timing factors continue prohibiting our systems from taking positions on a deteriorating macroeconomic outlook. When market factors align with our fundamental picture, we will likely see more decisive bets. Until next week.
Your point of view caught my eye and was very interesting. Thanks. I have a question for you.
arnold schwarzenegger steroids
bodybuilding forum supplements