
We’re incredibly excited to announce the official launch of the Prometheus ETF Portfolio. Over the last year, we’ve shared many iterations of our various systematic strategies to help investors through one of the most turbulent investment landscapes on record. Today, we take another step forward on our journey to help democratize investment research with the official launch of the Prometheus ETF Portfolio. This strategy is the first of many systematic portfolio products to come, which will help guide users on how to best position for the current and coming economic environment. Download the document here or continue reading.
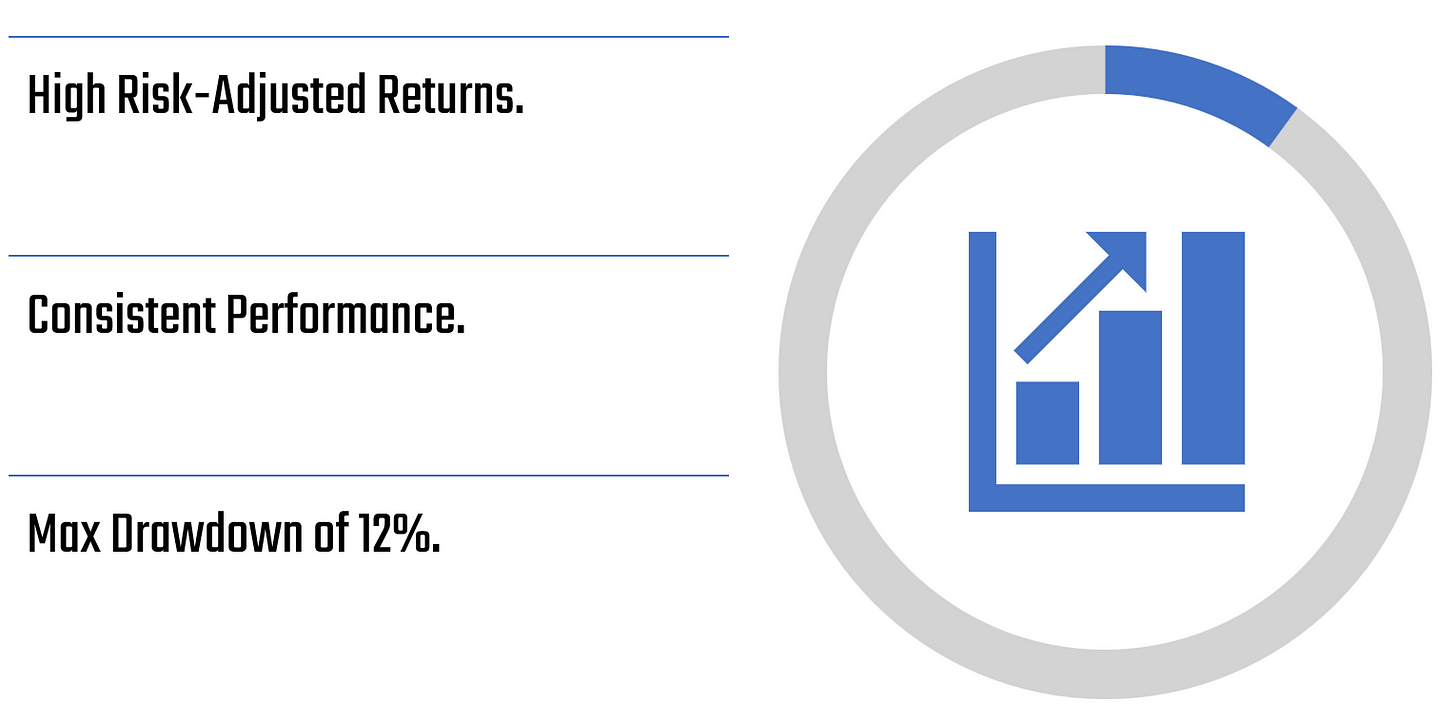
The Prometheus ETF Portfolio was designed with a straightforward core objective to provide strong risk-adjusted returns across economic regimes in a manner accessible to all investors. The portfolio leverages our systematic macro process to go long or short within a universe of 37 ETFs to achieve these investment objectives. Summarily, the objectives of the portfolio are as follows:
We designed this portfolio to be risk-scalable, i.e., if we wish to take more risk (volatility or potential losses), the portfolio can be sized up/leveraged. In contrast, if we want to reduce risk, we need to increase our cash allocation. This construction allows individuals to adjust the portfolio to their required level of risk while maintaining a stable return-risk ratio.
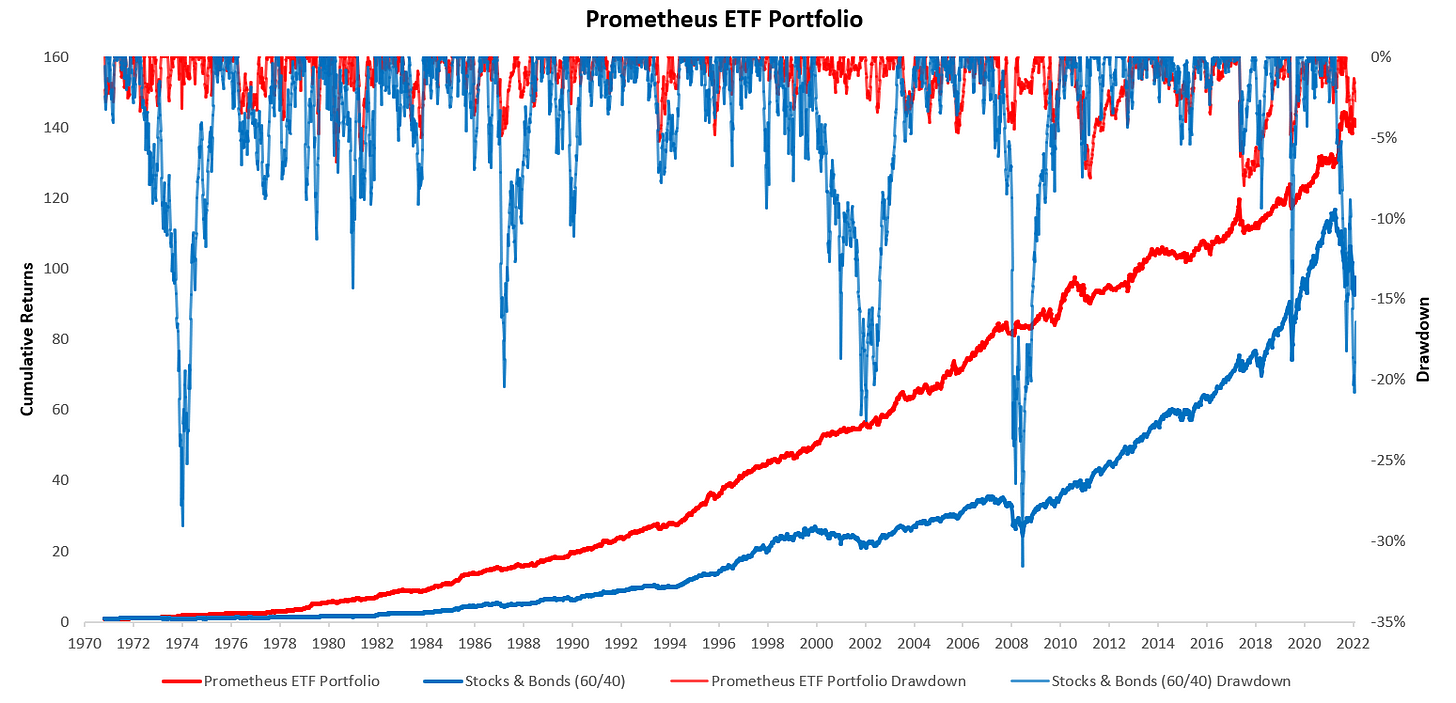
We’ve tested our systems over an extremely long history to evaluate the durability & persistence of our investment framework. The result is a systematic portfolio that we think not only meets the objectives above but does so durably. Below, we show the full-sample backtests of the Prometheus ETF Portfolio versus a 60/40 Stocks + Bonds portfolio:
In the pages that follow, we explain the systematic process that underlies the construction of the Prometheus ETF Portfolio, along with how our users can apply it.
Prometheus: Investment Principles
Before we dive into the construction of the Prometheus ETF Portfolio, we must convey the conceptual principles upon which we built the strategy. If these principles resonate with you, then this portfolio will likely be something you can use. Below, we highlight the three major principles that underly our thinking on active investment portfolios:
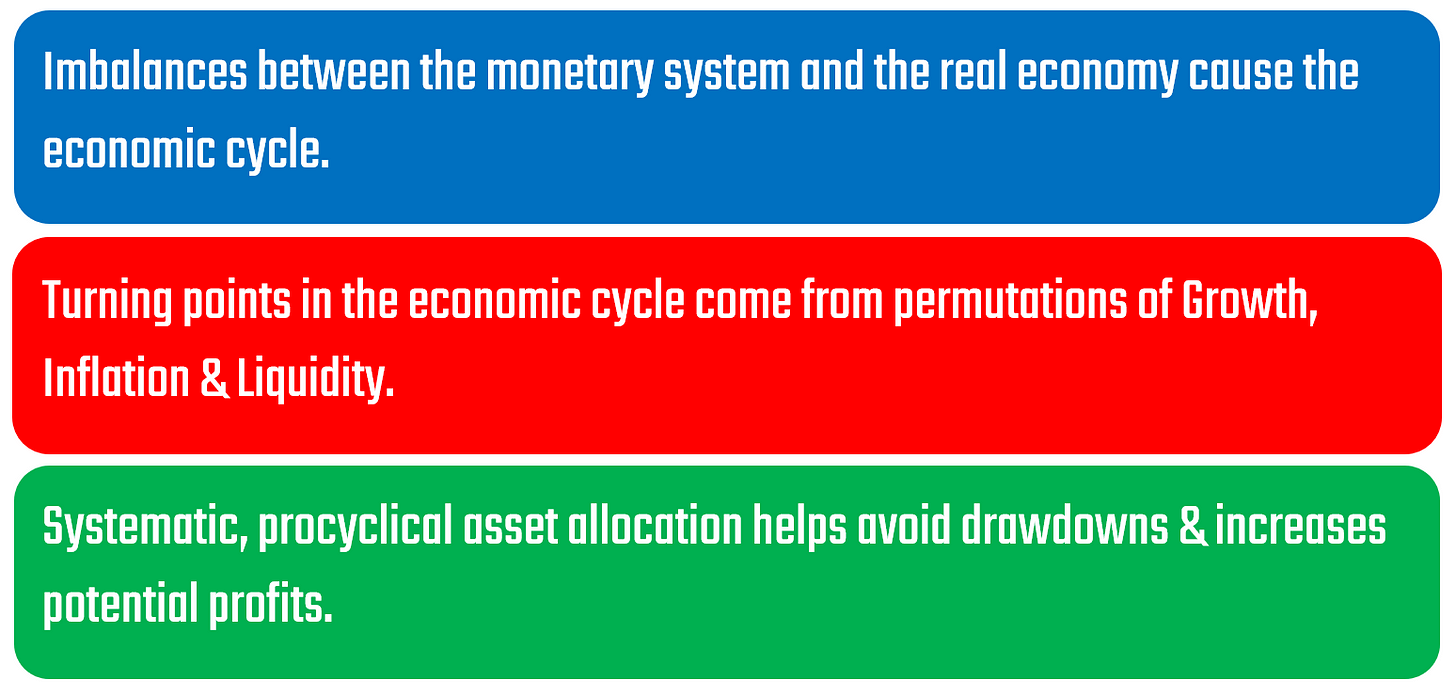
We believe in blending economic forecasting systems that attempt to stay ahead of the business cycle with a pro-cyclical approach to investing, i.e., buying assets as they rise or shorting them as they fall. A pro-cyclical approach aims to harvest returns imminently rather than wait for returns to unfold over a longer time horizon, as is often the case with traditional investment strategies. We have found this approach creates a much more reliable return stream relative to conventional allocations, allowing investors to weather any environment rather than waiting for a favorable climate to emerge.
We believe that this approach to investing creates a reliable return stream for two reasons. The first is that pro-cyclical allocation helps avoid sizable and sustained losses, also called drawdowns. The second is that correctly forecasting economic environments that other market participants do not expect puts our portfolio in a position to make outsized profits, as markets need to move to re-price a change in conditions relative to prior expectations. Therefore, we think an optimal approach would attempt to combine the best of “winning by not losing” and “winning when others are not.” Now that we have outlined our investment principles let us get into the levers we pull to engineer these outcomes.
Prometheus ETF Portfolio: Process
Below, we show the filtering process through which each security in our universe of 37 ETFs passes before we decide on positions for the portfolio at any given time:
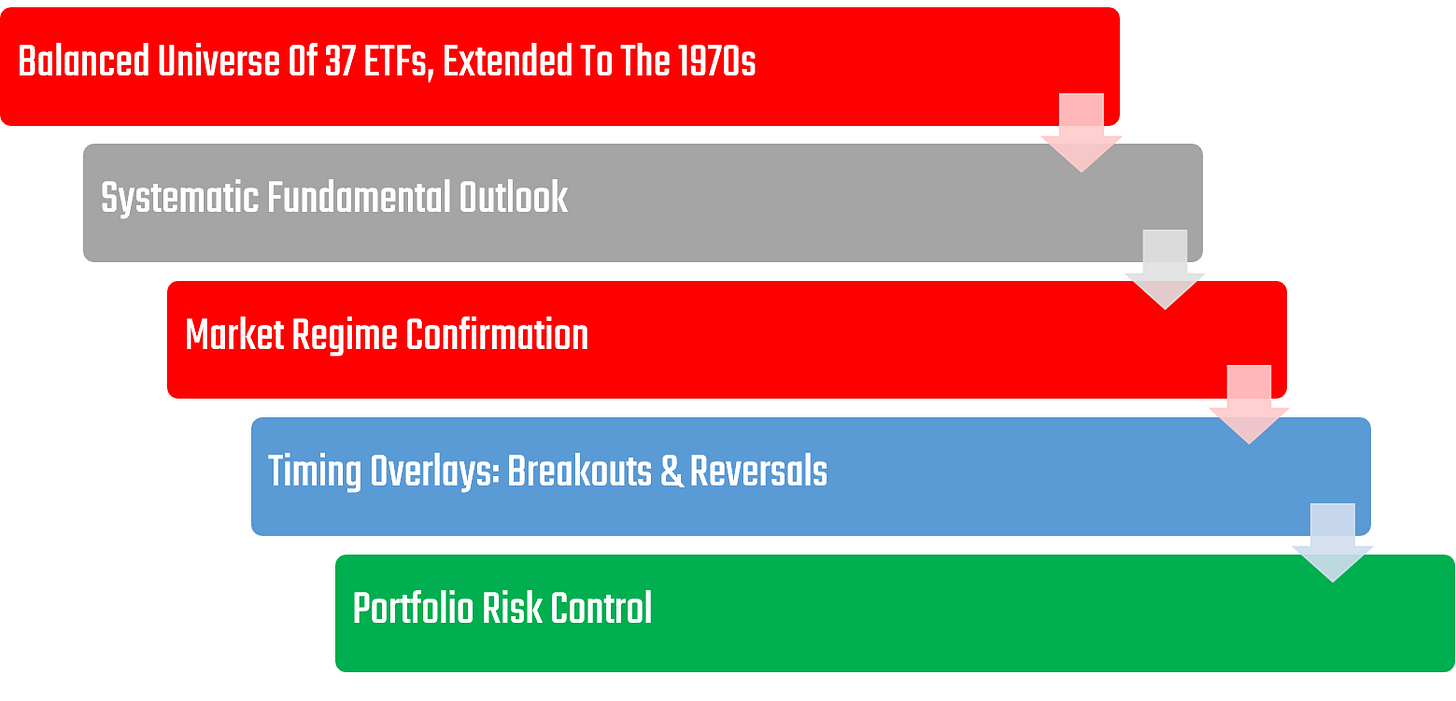
We begin by creating a universe of securities balanced to economic outcomes- i.e., a universe of securities that includes investments that can do well in every economic environment. Our research has shown that the primary drivers of the economic cycle are the permutations of Growth, Inflation, & Liquidity. To have the highest probability of creating a portfolio that can durably perform in an environment, we maintain a diverse array of ETFs to go long or short:
- Stocks: SPY, XLI, XLE, XLK, XLV, XLU, XLF, XLY, XLP, XLB, XLC, XHB.
- Commodities: DBC, USO, UGA, UNG, CORN, SOYB, CANE, WEAT, CPER, SLV, GLD, PAL.
- Fixed Income: TLT, IEF, IEI, SHY, MBB, VCIT, USHY.
- Currencies & Cash: UUP, FXE, FXB, FXY, FXA, BIL.
Each of these assets is pre-packaged to perform better or worse based on the permutations of growth, inflation, and liquidity, i.e., they have an inherent economic bias. Below, we show the decision tree we use to find the bias of a given investment asset:
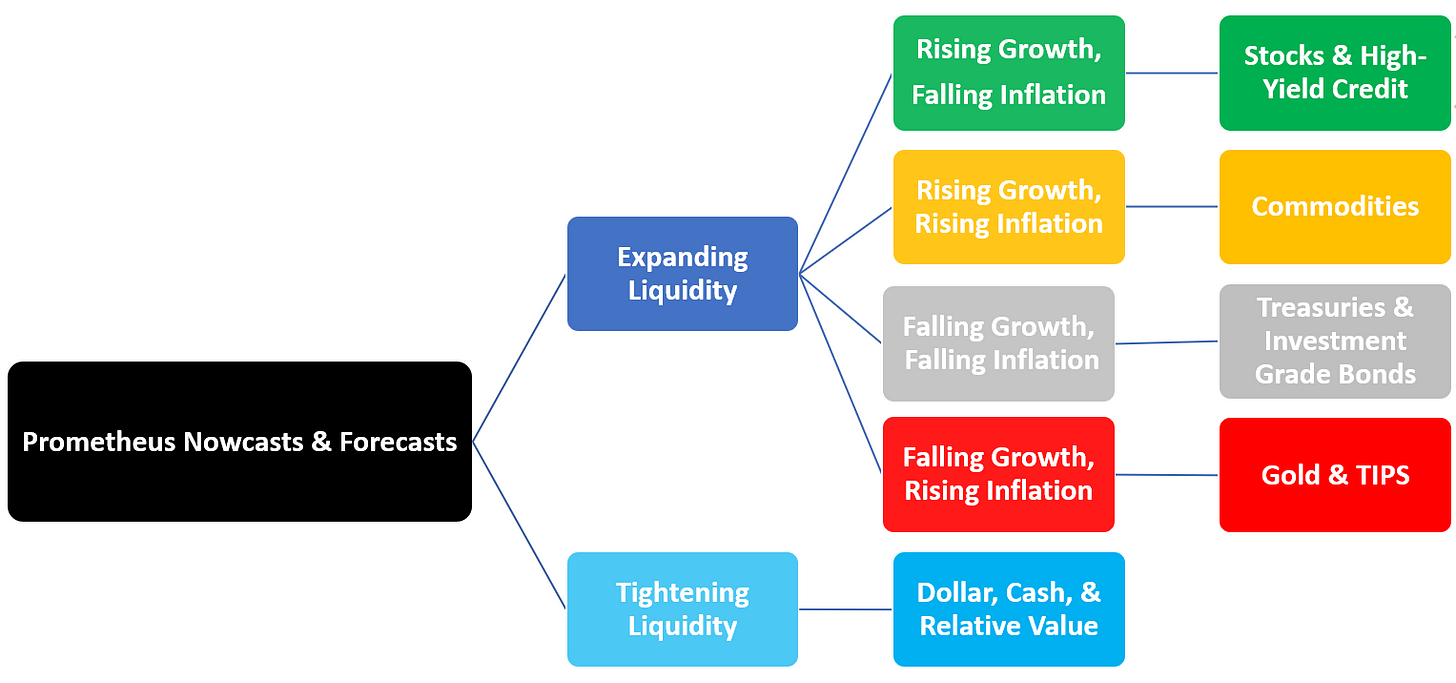
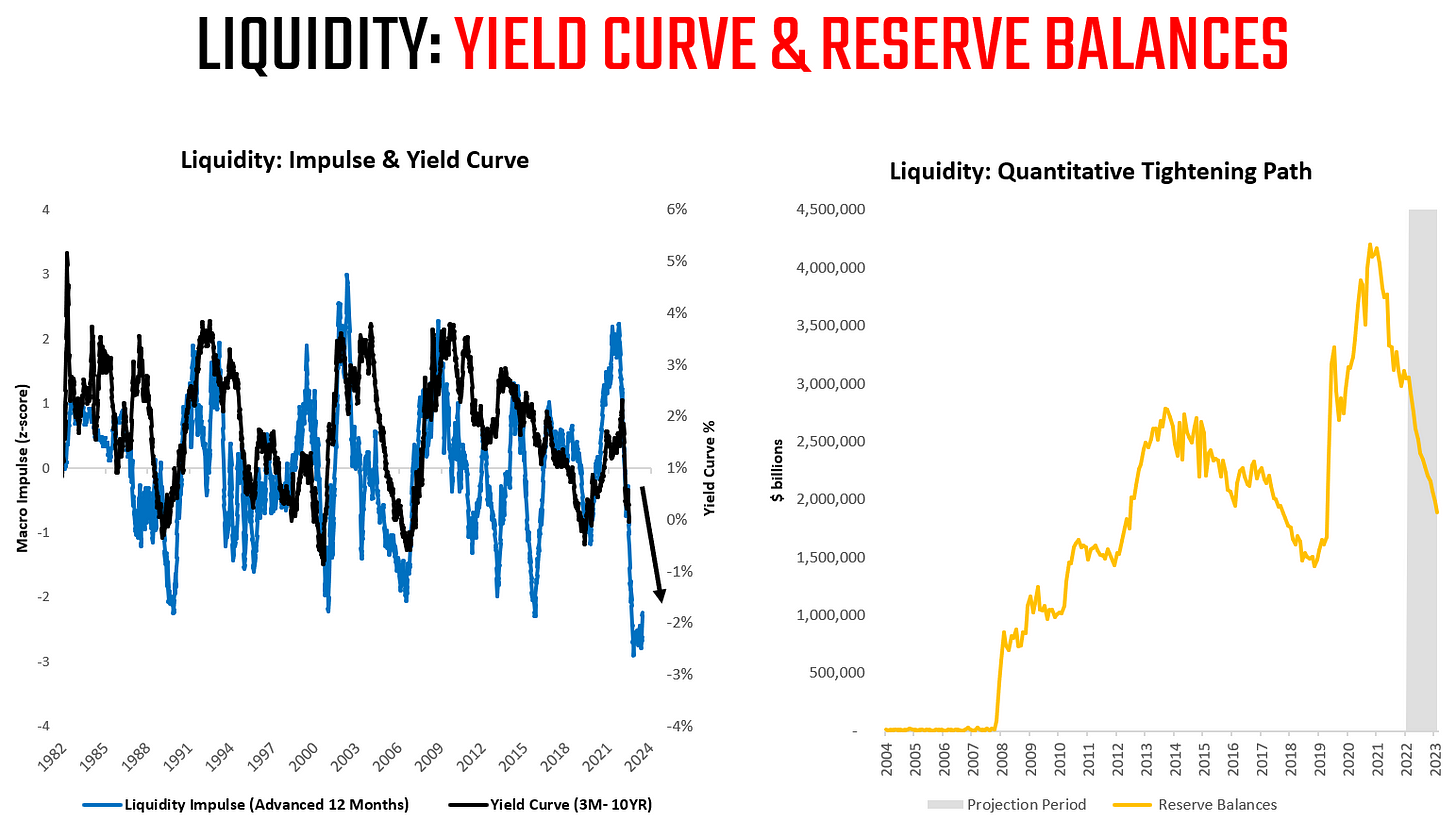
We begin by broadly dividing periods, based on nowcasts & forecasts, into periods of expanding or tightening liquidity. Liquidity is the stock of cash-like assets in the economy, which potentiates future economic and market activity. When liquidity is expanding, the likelihood of future economic activity being positive is high, and capital flows from cash to riskier places, i.e., to investment assets like stocks, bonds, commodities, and tangible assets. Further, the distribution of asset class returns is driven by the balance between growth and inflation stocks prefer real growth, fixed income prefers disinflation, and commodities outperform during stagflationary periods. Conversely, when liquidity contracts (usually through tighter monetary or fiscal policy), the dry powder that supports investments begins to dry up, resulting in an environment where investment assets face headwinds during these periods, dollar assets and cash tend to be the only game in town. It is important to understand that choosing an asset universe with securities that can perform in each environment is imperative to creating a successful portfolio. While we hope to know the economic regime over the six months, we simply don’t know the distribution of regimes over the next decade. Therefore, creating a universe that can deal with any environment is imperative to success.
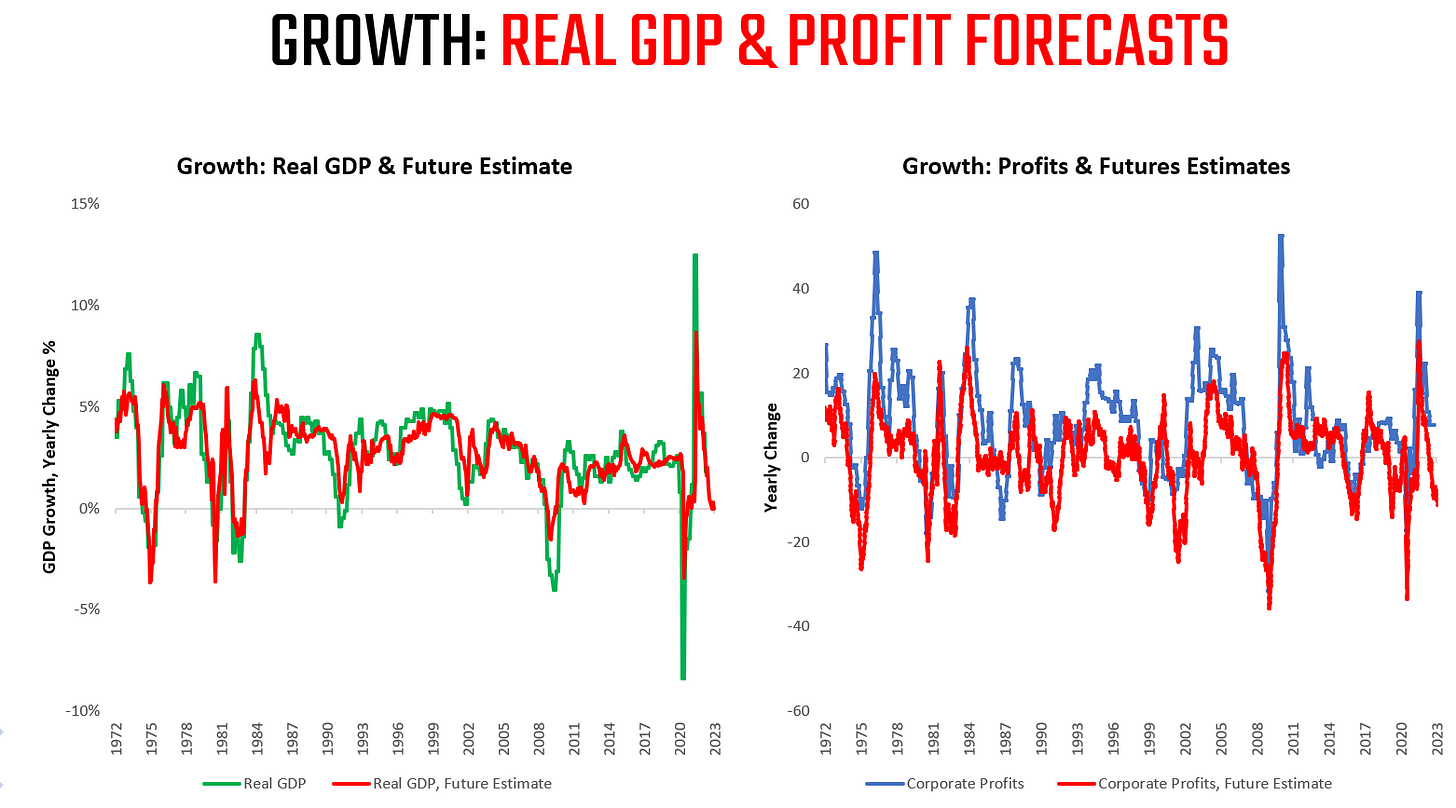
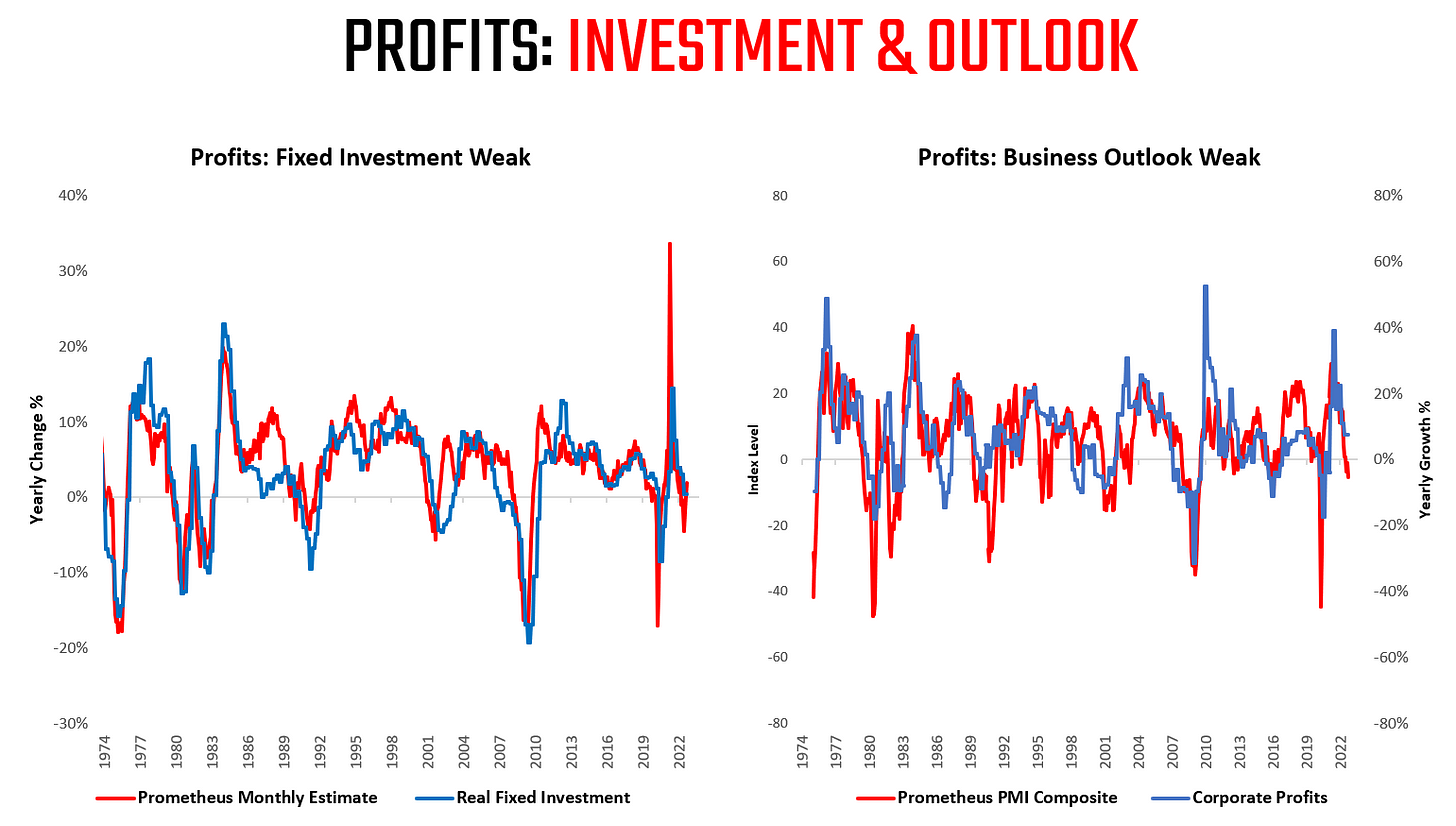
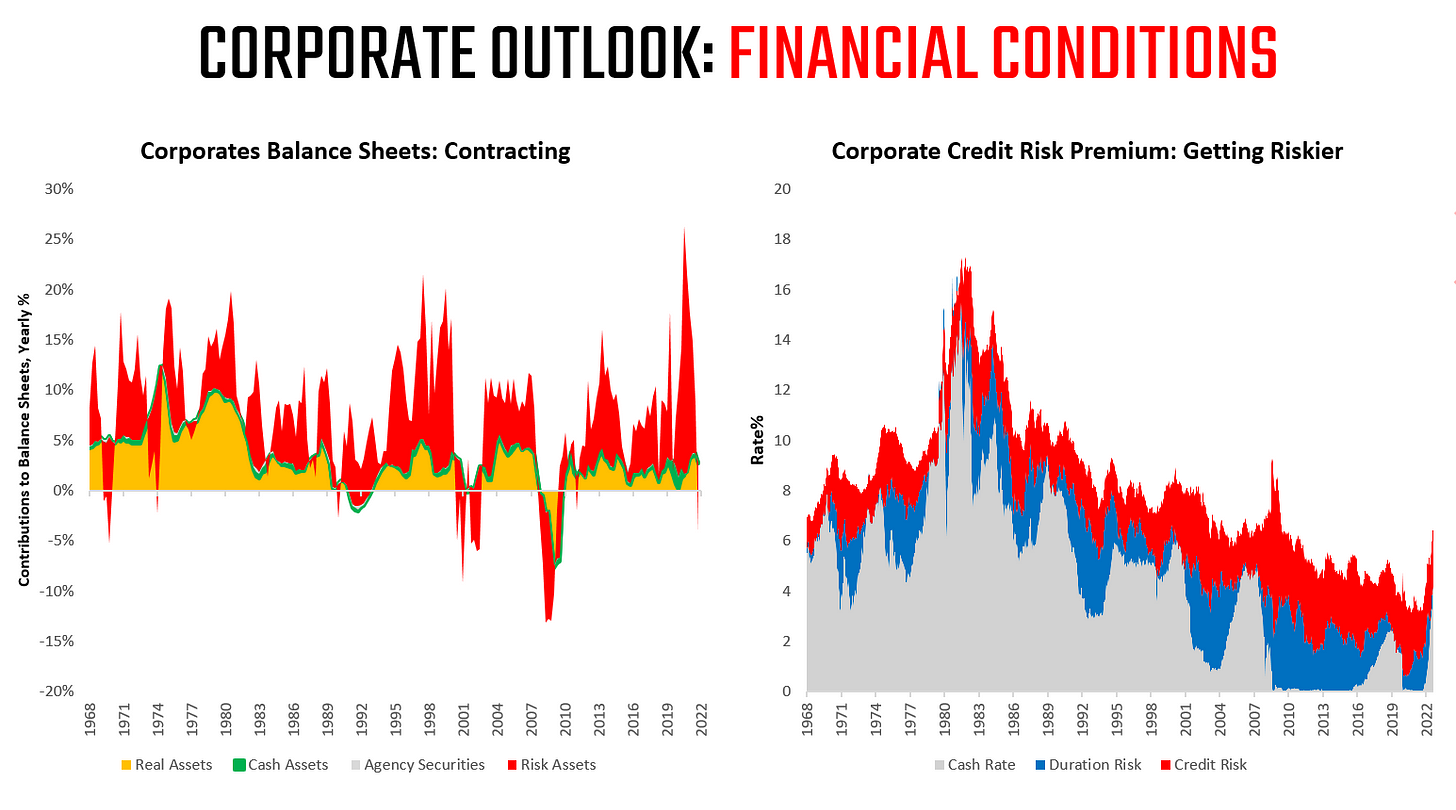
Now that we have defined our investment universe, we can turn to the next stage in our systematic process. We systematically nowcast and forecast economic conditions to leverage our mechanical understanding of asset class biases. We show some samples of the bigger picture inputs that go into this process below:
Our fundamental forecasting system is proprietary, and we do not share the inner workings and mechanisms that drive our outlook to protect our edge in markets. However, we provide the intuitions and logic that underlie our outlook in great depth via our Month In Macro report. We have one of the most comprehensive trackings of economic conditions available, which allows us a degree of granularity that is difficult to compete with. You can always follow our Month In Macro reports, alongside our updates from The Observatory, to understand what is driving our macroeconomic outlook. Find the latest Month In Macro here.
After our systems have projected our outlook for Growth, Inflation, & Liquidity we next turn to markets. Markets are continuously discounting future probabilities and using our understanding of cross-asset pricing; we are able to infer the economic regime being priced into asset markets. This process of regime recognition allows us to understand the probability of a macroeconomic environment as evidenced by cross-asset movements which allows us to identify the dominant and durable trend in markets. This feature is critical as it allows us to visualize if market probabilities are moving to confirm our expected outlook for the macro-economy on the margin, thus creating opportunities to potentially buy assets as they rise and short them as they fall. Below, we show how our regime recognition has categorized various periods of history, telling us the dominant environment in real time:
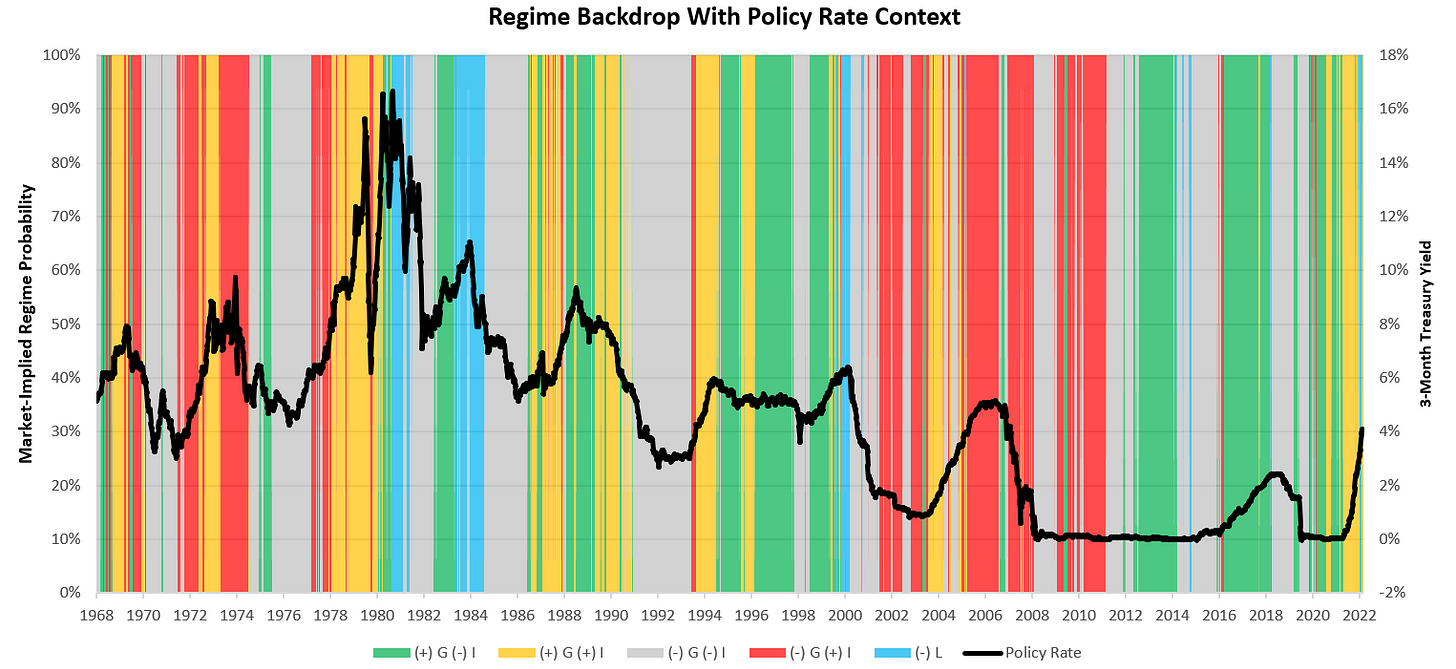
Permutations of growth, inflation, and liquidity allow for markets to price eight different regimes with varying probabilities:
- (+) G (-) I (+) L: Rising Growth, Falling Inflation, Expanding Liquidity
- (+) G (+) I (+) L: Rising Growth, Rising Inflation, Expanding Liquidity
- (-) G (-) I (+) L: Falling Growth, Falling Inflation, Expanding Liquidity
- (-) G (+) I (+) L: Falling Growth, Rising Inflation, Expanding Liquidity
- (+) G (-) I (-) L: Rising Growth, Falling Inflation, Tightening Liquidity
- (+) G (+) I (-) L: Rising Growth, Rising Inflation, Tightening Liquidity
- (-) G (-) I (-) L: Falling Growth, Falling Inflation, Tightening Liquidity
- (-) G (+) I (-) L: Falling Growth, Rising Inflation, Tightening Liquidity
While every permutation of these regimes brings its unique characteristics, we compress all four tightening liquidity regimes into one regime, i.e., tightening liquidity. The reason for doing so is to isolate the dramatic impact of tightening liquidity environments on all investment assets. Therefore, we focus on the market-implied probabilities of five regimes. We show our market regime monitor below:
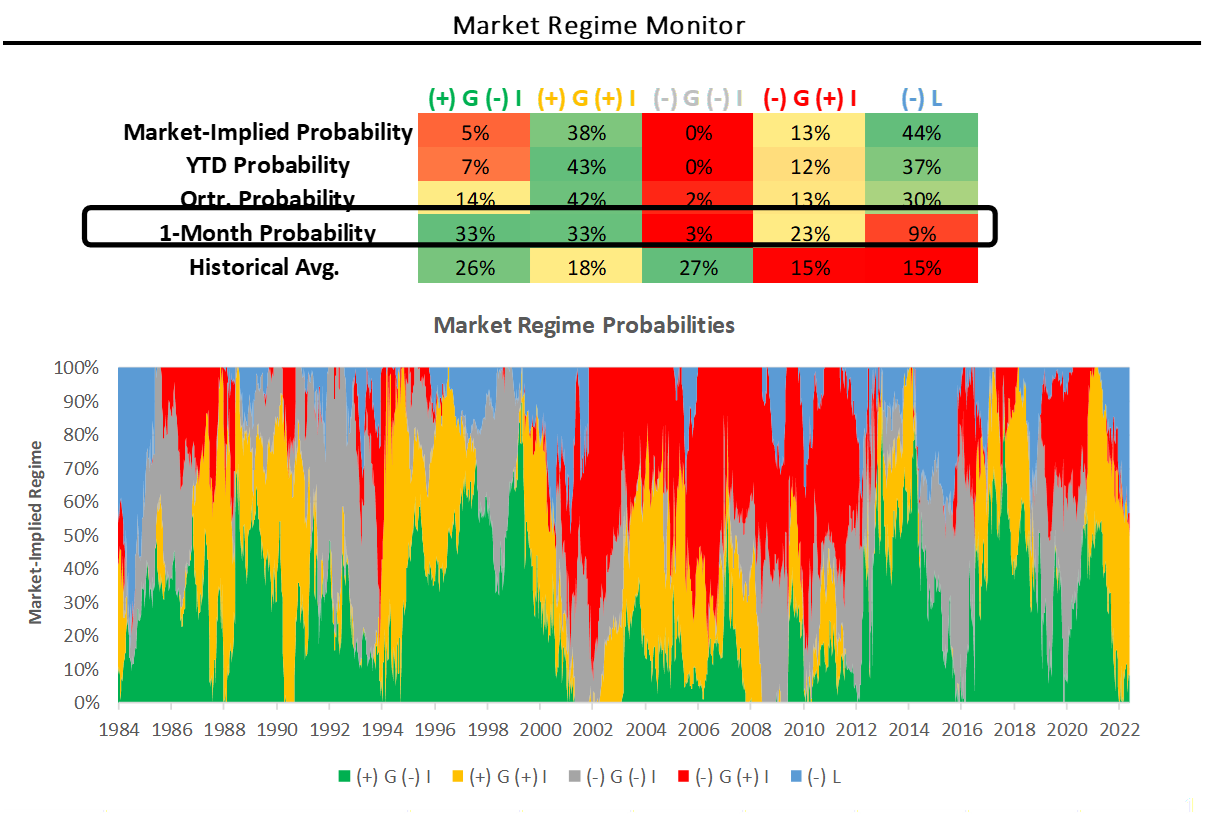
This regime recognition process is extremely helpful to our systematic approach, as it allows us to create a range of outcomes that we can expect for a given economic outlook. Therefore, we can use our regime recognition to understand how an asset has performed historically in an environment analogous to today. This allows us to create return and risk expectations for a given macroeconomic environment. We show this for our universe of ETFs below: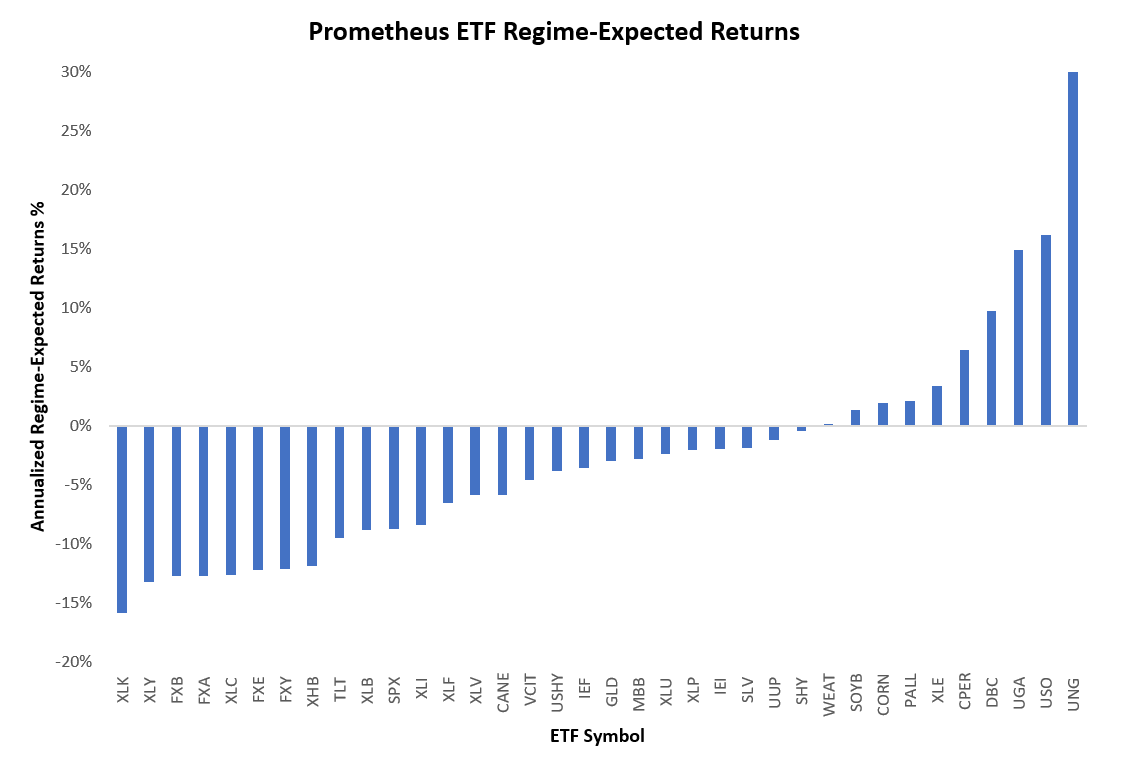
These estimates of market-implied probabilities and expected returns evolve daily as new information becomes available in markets, allowing us to re-evaluate our expectations and prospective positioning continually. Combined with our daily tracking and forecasting of unfolding economic conditions, this creates a comprehensive and ever-evolving tracking of macroeconomic conditions.
Now, while the economic cycle happens over months, our risk-taking takes place over weeks to ensure the timely implementation of our systematic economic views. To optimize the implementation of our macroeconomic views, we use a range of quantitative techniques aimed at tailoring strategies that best suit the ever-evolving characteristics of the time series that represent our ETFs. Our approach is to diagnose time series to be able to spot bull and bear markets in real-time and then trade them based on their statistical characteristics. Below, we show the decision tree that our systems go through to understand how to trade assets for a given macroeconomic & market-regime setup:
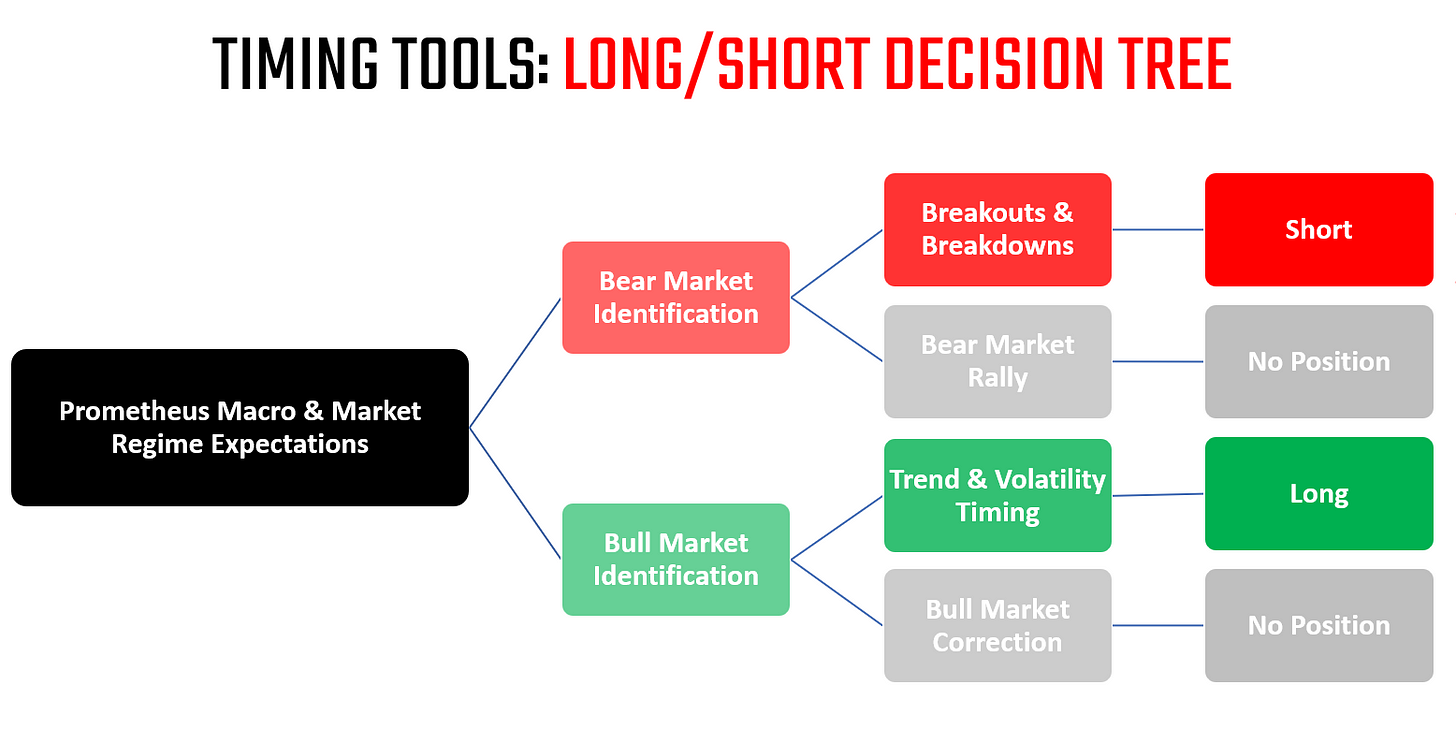
In constructing these Timing Tools, our objective has been not only to be timely but to be agnostic to any particular volatility regime or autocorrelation structure, i.e., we don’t want our strategies to be unable to perform during high volatility, low volatility, sustained trends, or choppy markets. Therefore, it is essential to understand that while this is indeed about timing, it is also equally about the durability of this timing. We illustrate some of our Market-Cycle Identification tools below:
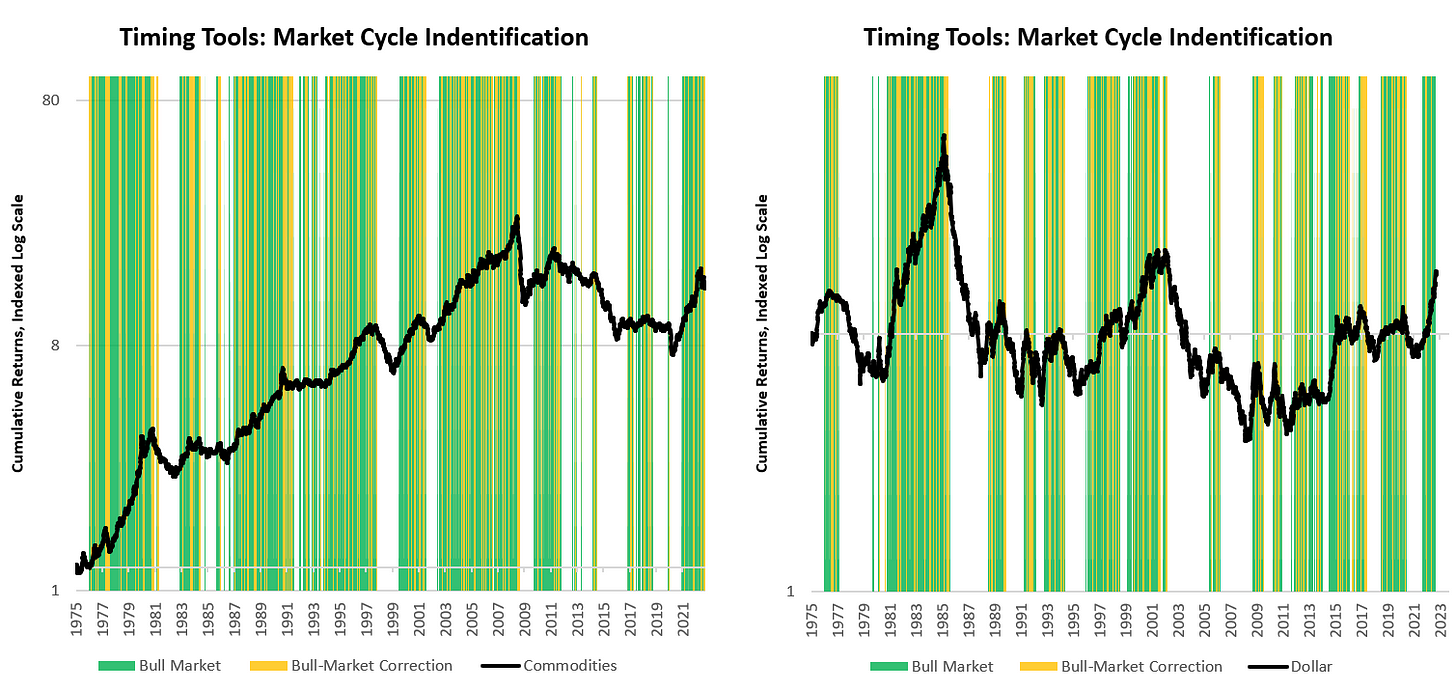
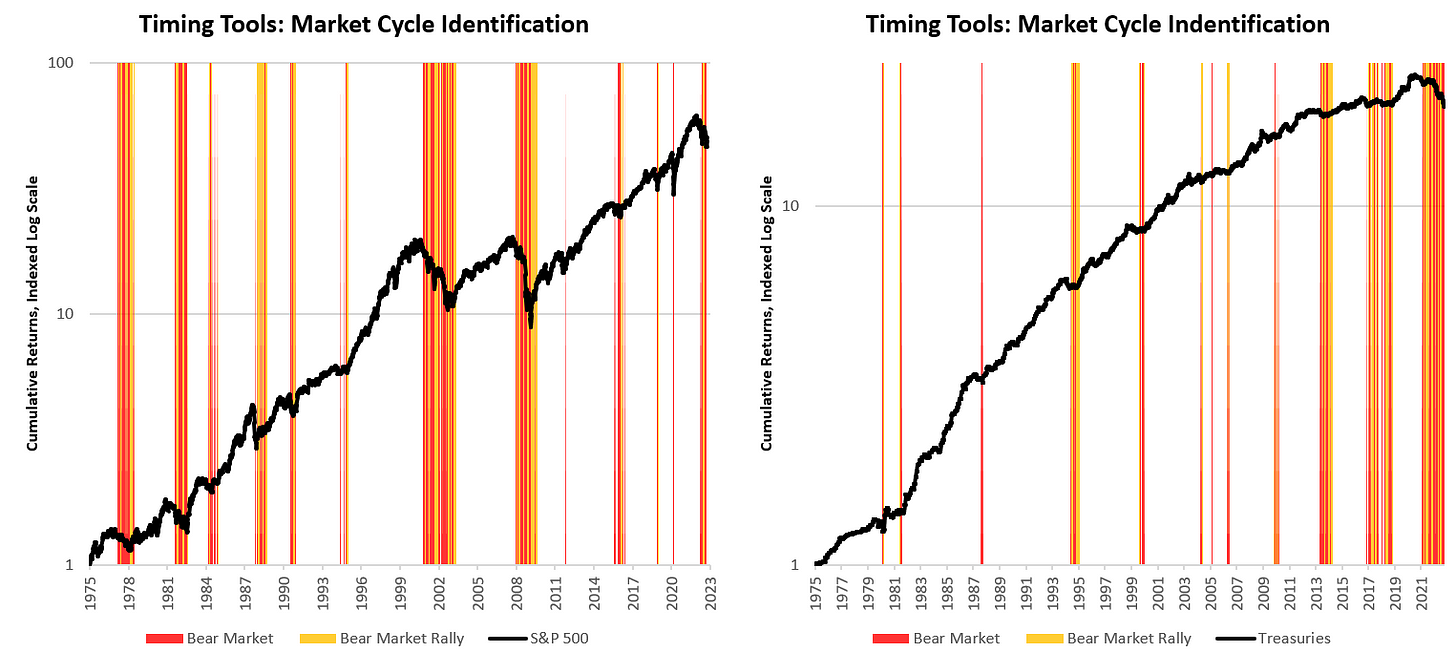
Our objective with these Timing Tools is not to be perfect but rather to create timeliness in our expression of our macroeconomic views while immunizing our risk to any particular pattern of time-series returns.
With our timing triggers in place, we turn to risk management controls. First, we begin by equalizing risk contributions across the portfolio. However, we overlay this equal-risk framework with signal weighting, i.e., the more conviction our systems have on a position, the more units of risk will be allocated to the position.
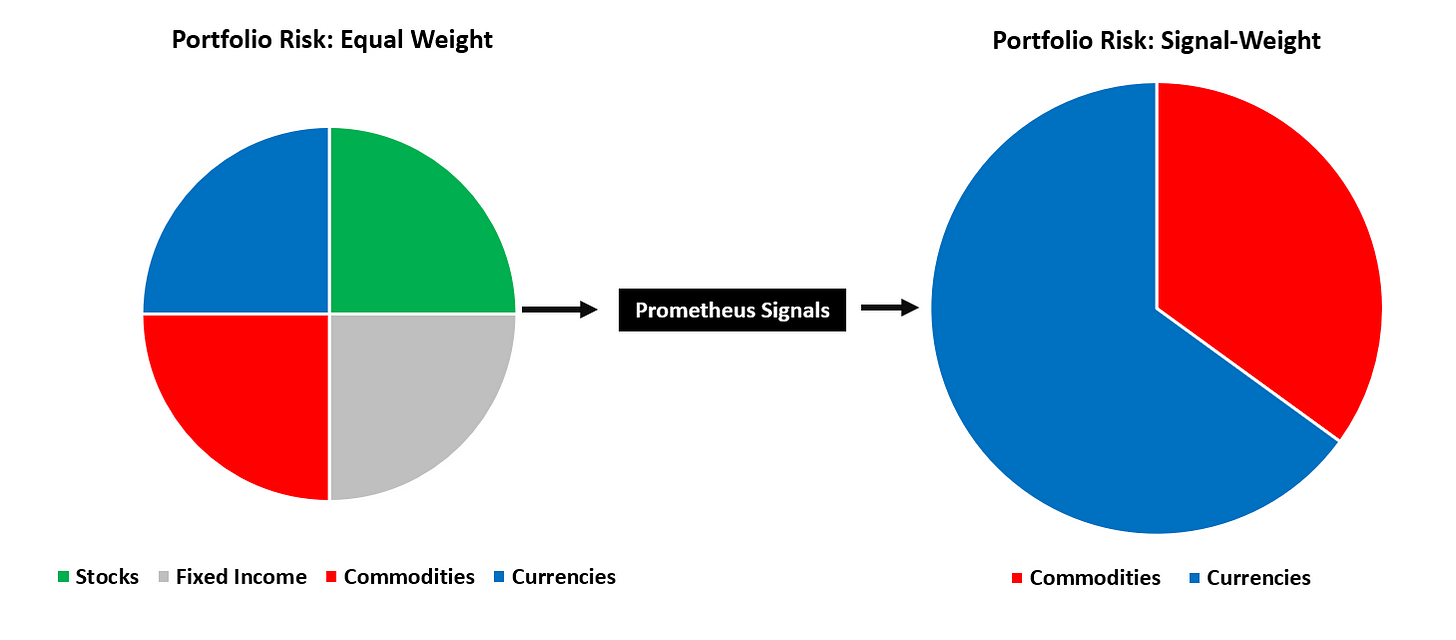
We believe that this blend of conviction and risk weighting allows for a mix of diversification and concentration (when appropriate). By blending these two approaches, we think it allows for the Prometheus ETF Portfolio to benefit from diversification but also from the times when its bets are playing out as expected. After constructing a framework for managing intra-position risk, we turn to the final phase of our portfolio construction process, i.e., portfolio-level risk.
Our portfolio risk framework is simple but practical we manage portfolio risk to never have maximum volatility in excess of a value consistent with our maximum drawdown objective. While many choose to focus on portfolio volatility as a primary target, our research has shown that volatility targeting exposes portfolios to correlation risks, which result often result in multi-standard deviation moves in the portfolio as correlations intermittently change, resulting in larger-than-expected losses. Our approach is, therefore, to control the end outcome, i.e., total losses. We do so by understanding the expected loss on our portfolio should all our positions go against us. We then size our annualized maximum portfolio volatility to comply with an expected maximum drawdown of 12%. Below, we show how this approach has fared in capping drawdowns:
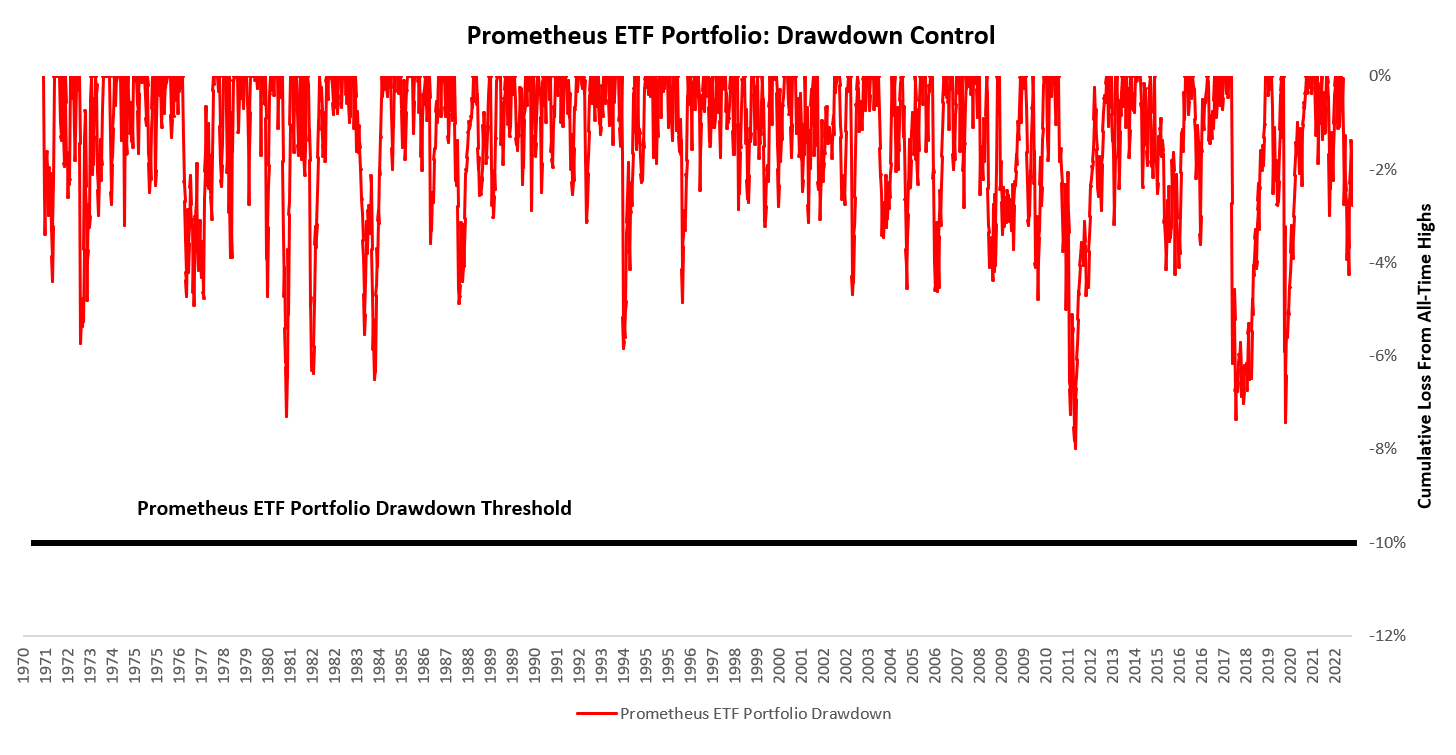
As we can see above, our drawdown control is extremely stringent and conforms to the expectations set by our expected loss function. The Prometheus ETF Portfolio controls to have a maximum drawdown of 12%, with a threshold set at 10% for emergency position restriction. The main lever used to achieve this drawdown control is the increase and decrease of cash. Additionally, the portfolio will use leverage to obtain its desired risk level; however, we conservatively cap this amount at 2X leverage, as we believe it to be accessible to most. For those concerned about excessive use of leverage the portfolio typically does not need leverage (just at particular points in the cycle), with a mean leverage ratio of 1.09X we will cover this more in the next section. With this, we have completed the overview of our process it is time to dive into our simulations.
Prometheus ETF Portfolio: Simulation
Before we dive into the simulated performance of the Prometheus ETF Portfolio we think it is important to ground expectations. Our objective in backtesting our strategies is to asses the durability and robustness of our methods; therefore, when we provide our users with any output, we know that the mechanics have withstood the test of time. However, we do not intend to impart any sense of false certainty with these results. Most importantly, these results should by no means be interpreted as investment advice or solicitation for any investment & and are for informational purposes only.
To evaluate the persistence of our strategies, we began by testing them through the data we had available, and over time, we’ve been able to extend our strategies as far back as the 1970s. This has allowed us to understand how the Prometheus ETF Strategy would have fared over a multitude of different environments. We start by showing the cumulative performance of the Prometheus ETF Portfolio versus a 60/40 Stocks & Bonds Portfolio (60/40) as a benchmark:
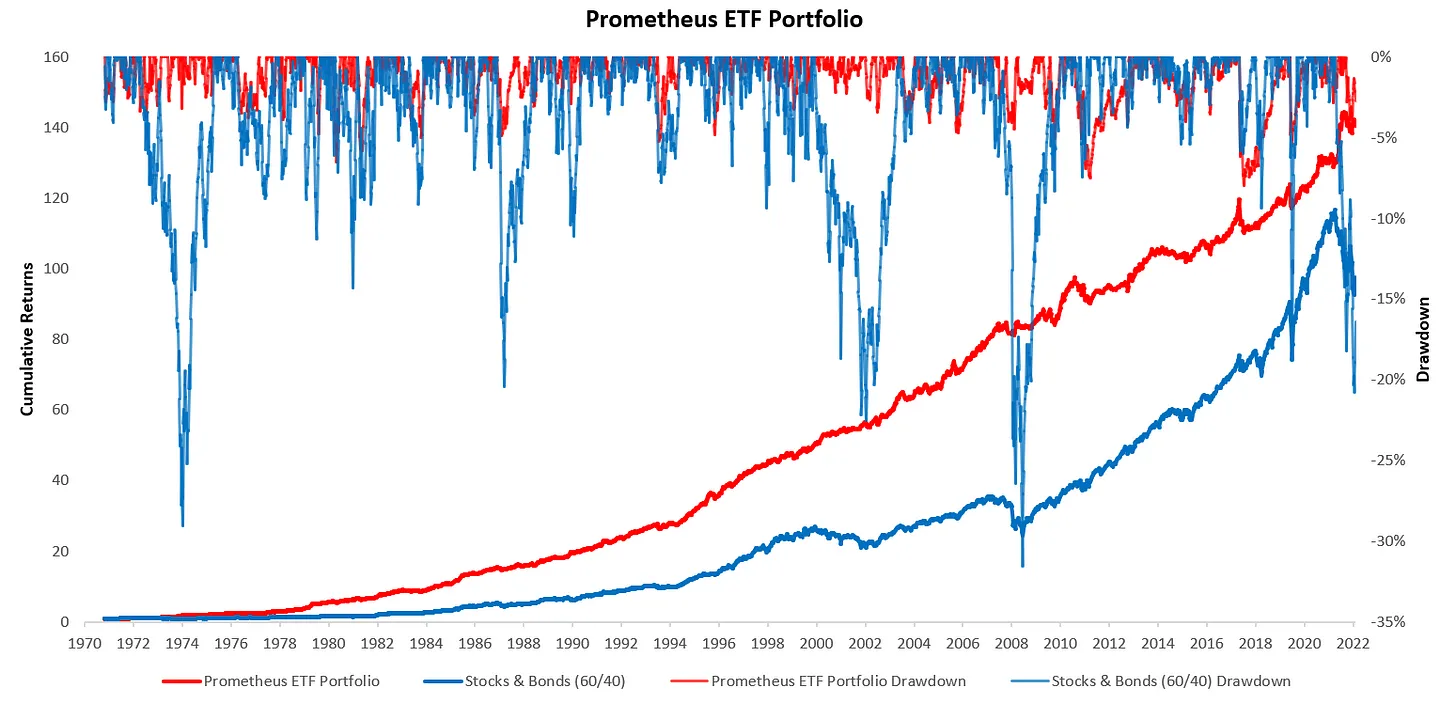
As we can see above, the cumulative returns and drawdown of the Prometheus ETF Portfolio far outperform those of the 60/40 Portfolio. To better understand the reward/risk dynamics of the portfolio, we look at various measures of risk-adjusted returns (vs. 60/40), along with the distribution of returns:
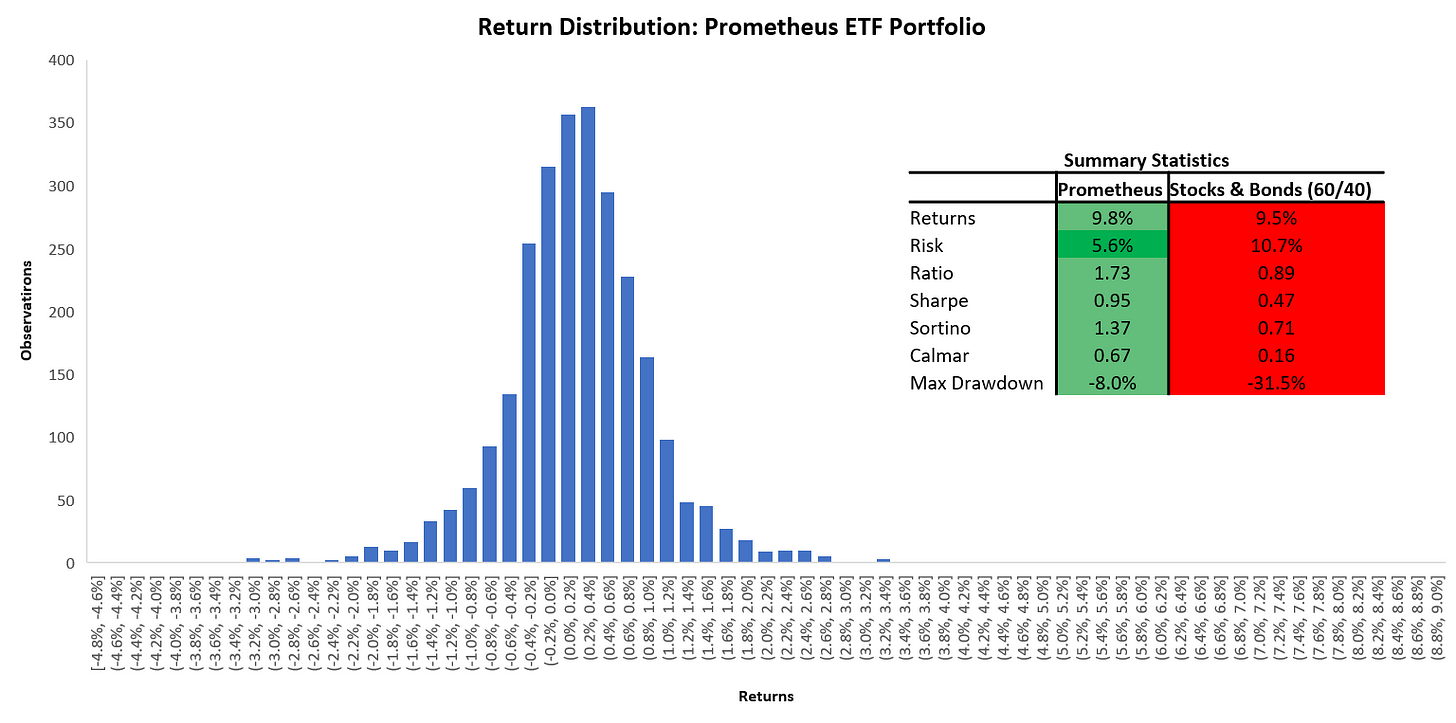
Once again, our strategy far outperforms the conventional strategy across every single measure of risk and return. Next, to better understand this performance’s path, we examine our portfolio’s simulated calendar-year gross risk-adjusted returns. Below, we show the calendar year gross risk-adjusted returns for the Prometheus ETF Portfolio versus the 60/40 Portfolio. Below, we offer how our simulated portfolio avoids the pitfalls of 60/40 drawdowns, as intended:
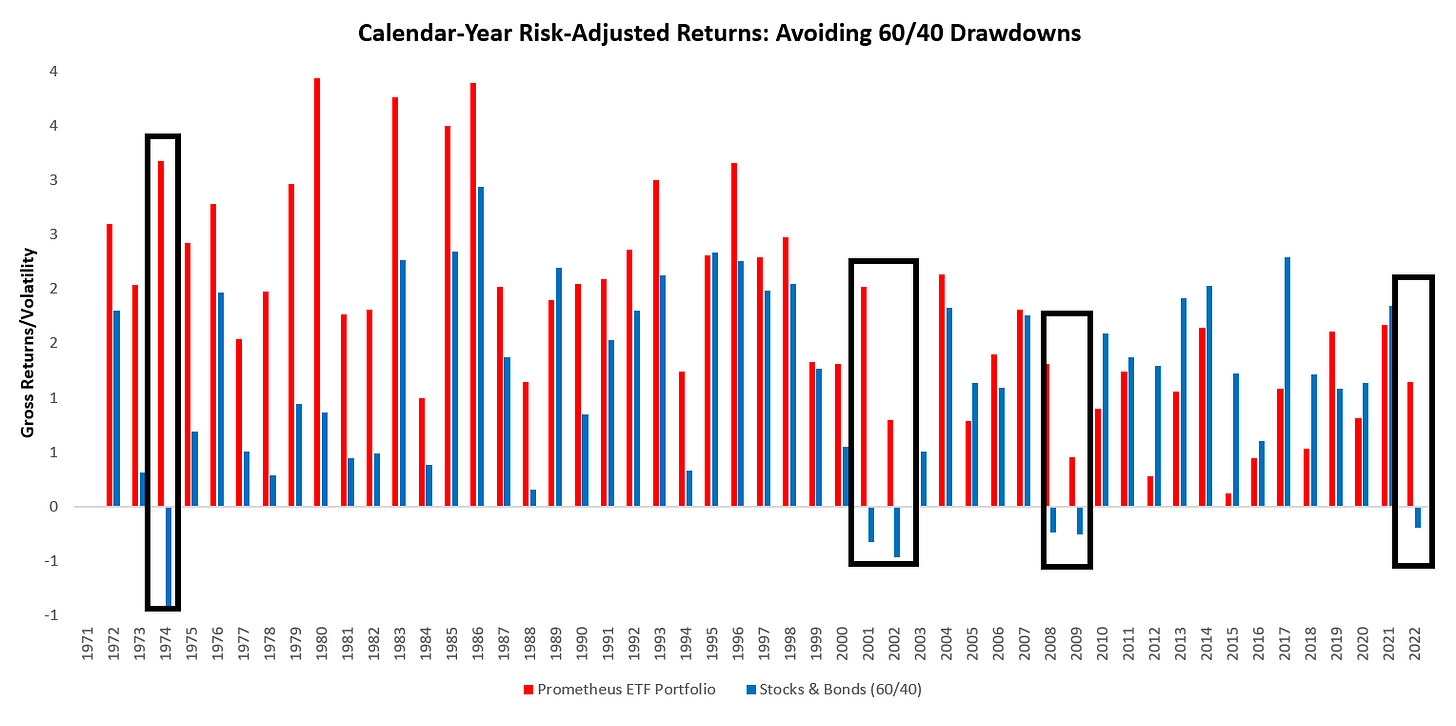
Above, we have chosen shown gross returns, i.e., returns that include cash returns, as this is what the end investors receive and is also responsible for the downward trend in gross return/risk over time as cash rates decreased. We highlight that our portfolio avoids the drawdowns of 60/40, and below, we show why this is the case. The primary driver of large drawdowns in investment portfolios comes from shocks in liquidity conditions emanating largely from monetary policy shocks. Given our constant tracking and forecasting, our systems can short assets into and during these shocks. We show this below:
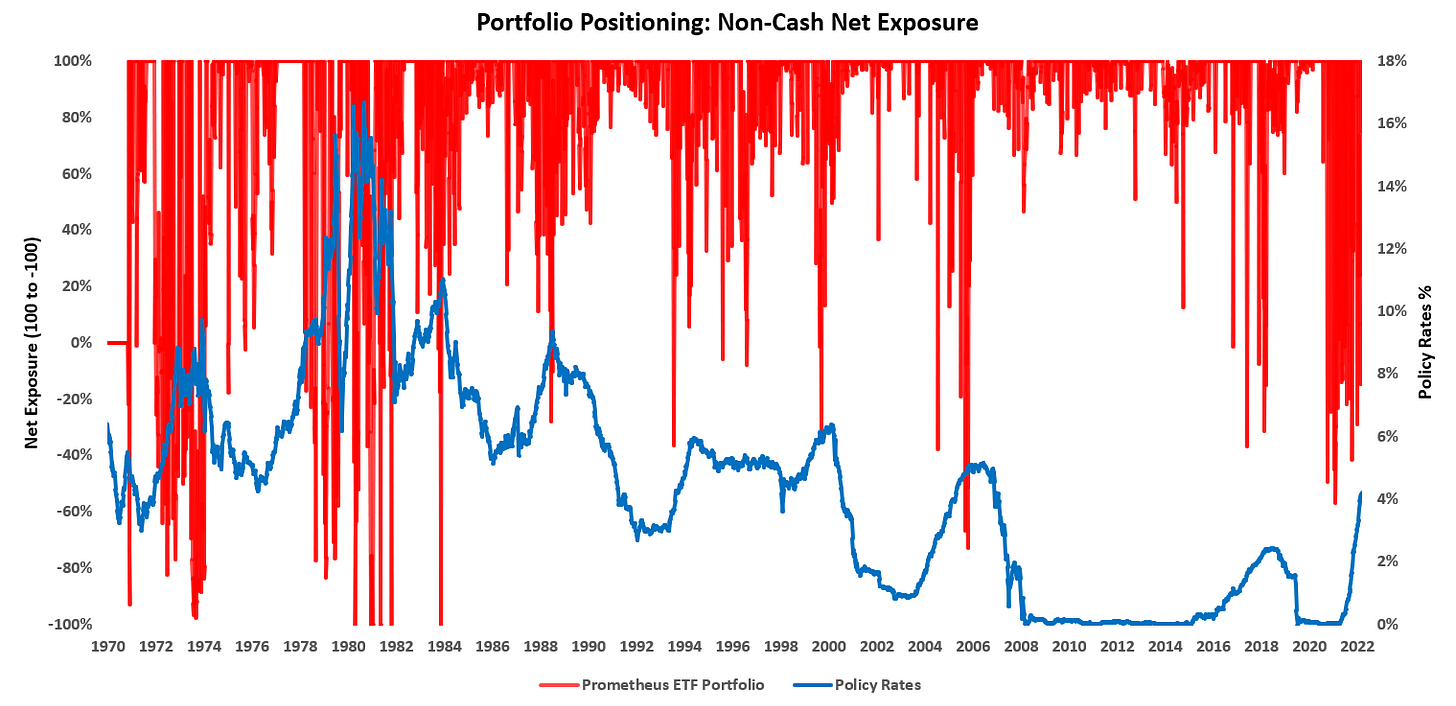
Above, we show the net non-cash exposure of the Prometheus ETF Portfolio which can be between 100% (Long-Only) and -100% (Short-Only). As we can see above, the portfolio does a good job of increasing short exposure heading into monetary policy hiking cycles. This short exposure is beneficial on two fronts. First, it creates a potential profit source, and second, it makes a set of potentially uncorrelated or inversely correlated bets to the markets the strategy may prefer. The combination of these factors creates a mix that helps control losses & potentially add winners during periods of tightening liquidity & policy shocks.
While we have a fair degree of confidence in catching liquidity shocks, we need to understand how the strategy performs in various economic environments. To understand this, we turn to our regime recognition process to evaluate simulated portfolio returns during all major regimes. We show this below:
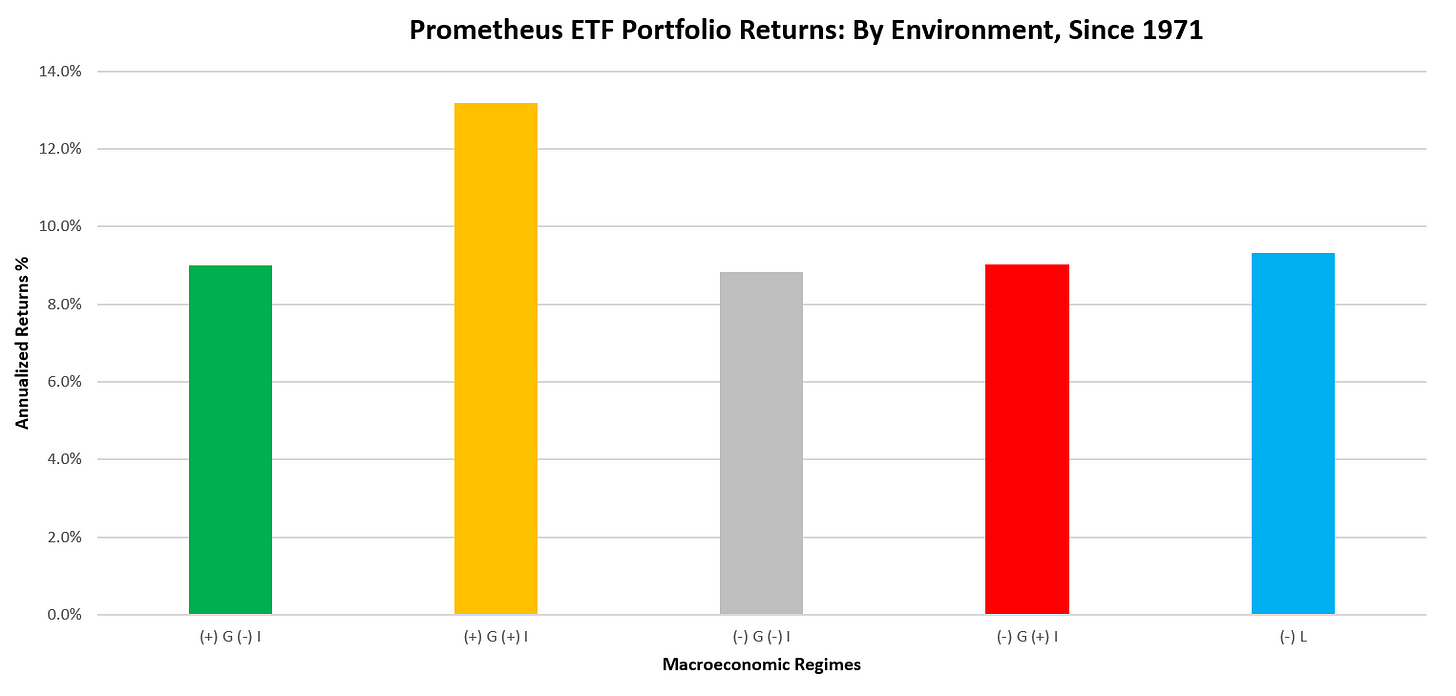
As we can see above, the portfolio generally shows stable returns across various regimes. Of particular note, however, is the outsized performance during the (+) G (+) I regime. Based on our analysis, this outperformance is not because of a bias to the regime but rather due to the extremely large and aberrant moves that occurred during the 1970s, i.e., the period when (+) G (+) I was most common. Strong directional volatility is typically positive for macro strategies; therefore, we are comfortable with this potential upside performance. Having now looked through regime-based performance, we now turn to time-based performance. To get a sense of how investors would experience the strategy over a five-year investment horizon, we look at the average rolling returns on the portfolio for every each five-year window since 1971:
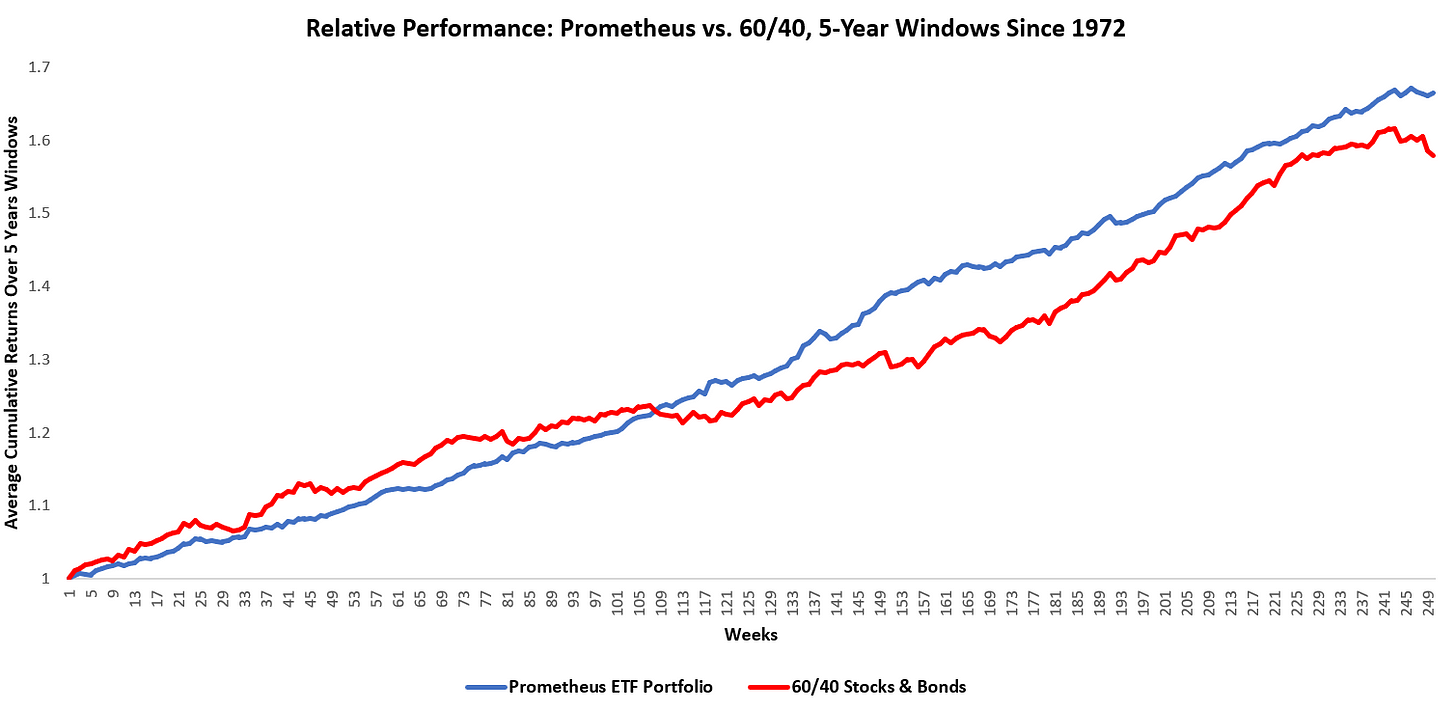
As we can see above, the portfolio shows durability over various periods. Furthermore, the portfolio does so without being leveraged on average, though it is leveraged at particular points to achieve risk objectives. We show portfolio-level leverage below:
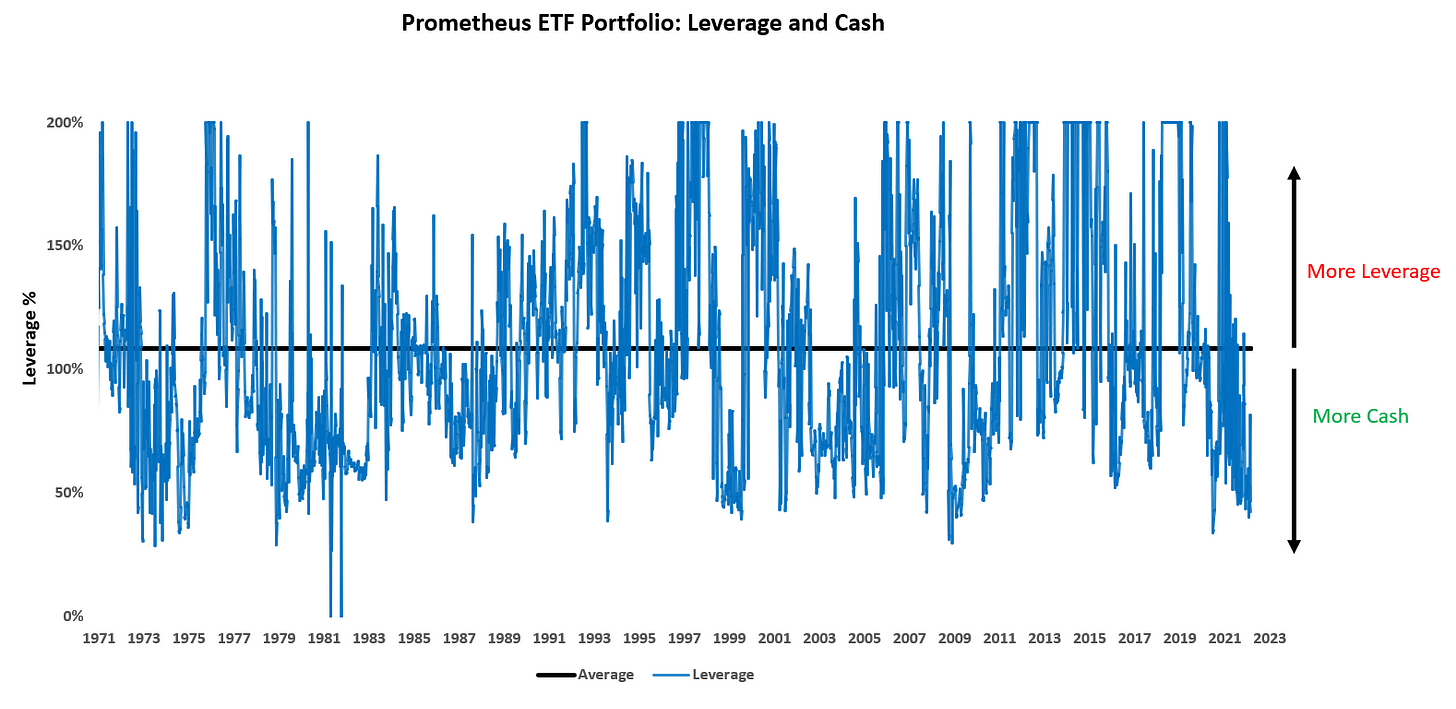
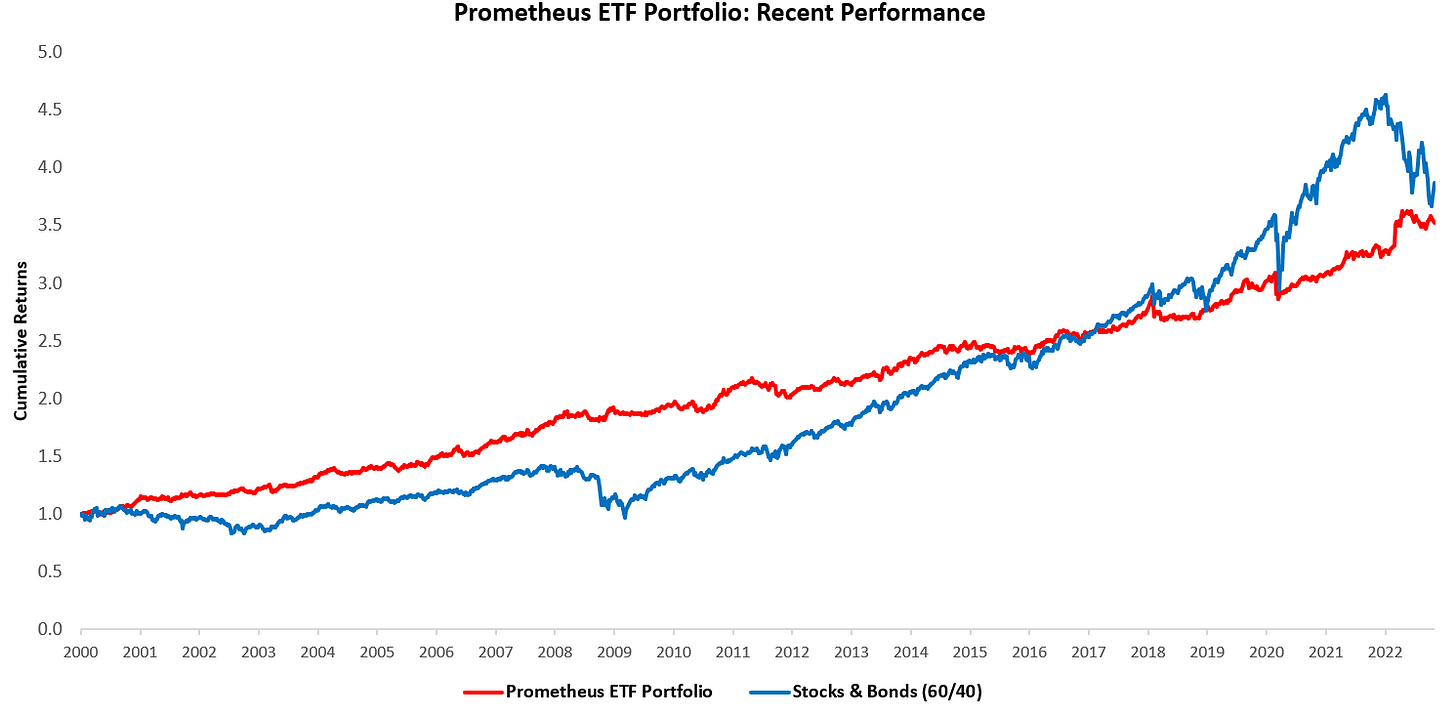
As we can see above, our conservative approach results in portfolio levering and, equally importantly, de-levering, i.e., increasing cash allocations. Over time, the portfolio has generally not needed excessive leverage to perform strongly. Nonetheless, we believe that leverage is an essential component of generating returns over the investment cycle and therefore continue to think prudent usage is imperative to success. Finally, we offer the cumulative returns on the Prometheus ETF Portfolio versus 60/40 for the more recent past. Our portfolio underperformed 60/40 during this period, but risk-adjusted returns were significantly better (Sharpe Ratio 0.76 vs. 0.49). Furthermore, the portfolio has managed to keep pace, despite one of the largest monetary & fiscal-fueled asset bubbles in history.
Overall, our tests for durability suggest that the Prometheus ETF Portfolio will likely maintain its ability to generate a solid risk-adjusted return, consistent performance, and a maximum drawdown of 12%, consistent with our objectives. At the same time, we continuously innovate to find weaknesses in our approach and evolve our process as we learn from markets. We will continue to iterate on our process in a manner consistent with maintaining our ability to generate our desired objectives. The investment landscape is continuously evolving, and we will continue to evolve with it to bring our users the best possible systematic macro edge.
Prometheus ETF Portfolio: Usage and Risks
This portfolio will be published weekly on Fridays, with positions turning over before the week’s close. The portfolio will be calibrated to have a 10% maximum volatility but scaling up or down maximum volatility is possible with some simple arithmetic. The portfolio will be published alongside accompanying diagnostics & macroeconomic analysis.
The portfolio will always be published with gross exposure summing up to 100%, i.e., the absolute value of all positions will always be 100%, but the net exposure will vary over time. We show an example below:
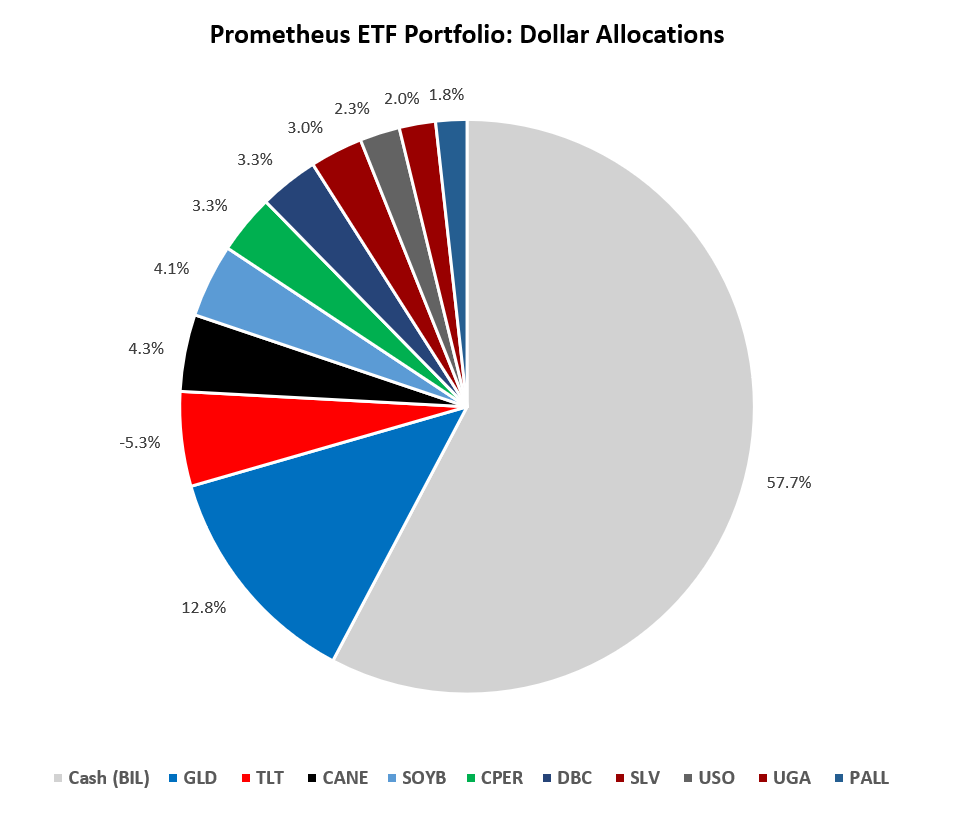
Complementing this will be the degree of leverage (or excess cash, as shown above) used by the portfolio to achieve its max volatility target. As we must note, risk is always associated with any investment approach. The primary risks to our strategies are as follows:
- Our estimates of the current and future macroeconomic conditions prove wrong.
- Catastrophic loss intra-week.
- Our risk controls result in under-exposure or over-exposure.
That said, we’re continuously assessing and evaluating conditions to improve our strategies further and minimize risks. We’re incredibly excited to share the Prometheus ETF Portfolio with you starting next week on Friday, and we think it will excellently complement our Month In Macro & The Observatory.
Another step toward the democratization of finance. Until next time.
DISCLAIMER: All information, views, and opinions provided herein are for informational purposes only and should not be construed or relied upon as investment advice, an offer to sell, or a solicitation for any form of investment. The information contained in this website is the most recent information available to us (except otherwise noted); however, all of the information herein is subject to change without notice. Certain information included in this website is based on data obtained from sources considered to be reliable; however, no representation is made with respect to the accuracy or completeness of such data. All opinions, estimates, and forward-looking statements, including any market forecasts or projections, involve a number of assumptions that may not prove to be valid. Past performance does not guarantee future results. The value of investments will fluctuate, and a loss of principal may occur. Any mention of an investment decision is intended only to illustrate our investment approach. Prometheus Investments Research LLC will not be held liable for any decisions made using its information content.
Здравствуйте, друзья! Сегодня я хочу обсудить актуальном вопросе для владельцев автомобилей концерна VAG –
фирменные брелоки.
Большинство из нас сталкивались с ситуацией,
когда автомобильный ключ внезапно перестает работать или пропадает.
Такое может произойти в самое неудобное время,
заставляя нас чувствовать себя
растерянными и расстроенными.
Вот почему я считаю важным отметить значимость использования исключительно фирменных ключей VAG.
Фирменные брелоки VAG – это не просто электронное устройство.
Это высокотехнологичное устройство, созданное исключительно для вашего
автомобиля. Они обеспечивают высочайший уровень
защиты и совместимость со всеми электронными компонентами вашего авто.
Позвольте привести несколько
аргументов, почему стоит выбирать исключительно фирменные ключи VAG:
Надежность: Фирменные брелоки произведены из высококачественных материалов, что гарантирует
их долговечность.
Безопасность: В них используются инновационные методы кодирования,
оберегающие ваш транспорт от несанкционированного доступа и кражи.
Функциональность: Новейшие брелоки
оснащены расширенным функционалом, такими как дистанционный запуск двигателя или контроль температуры в салоне.
Гарантийное обслуживание: Фирменные брелоки поставляются
с заводской гарантией, что обеспечивает вам
уверенность и защиту в случае неисправности.
Теперь давайте обсудим,
где можно приобрести фирменные ключи VAG.
После тщательного изучения рынка я нашел надежного поставщика
– Ключи Шкода Кодиак. У них
в наличии широкий ассортимент оригинальных брелоков
для всех марок машин VAG, включая Volkswagen,
Audi, Škoda и SEAT.
Что мне особенно понравилось,
так это их профессиональный подход.
Они не просто продают ключи – они обеспечивают полный спектр услуг, включая настройку и синхронизацию брелока с вашим автомобилем.
Это критически необходимо, так как некорректно настроенный брелок может не работать или даже повредить электронику вашего авто.
Кроме того, их цены вполне
разумны, особенно если учесть
качество обслуживания и оригинальность продукции.
Они также предлагают различные варианты доставки, что весьма практично, если
вы не имеете возможности
приехать к ним самостоятельно.
Подводя итог, отмечу, что инвестиция в фирменный брелок VAG – это вклад в защиту и надежность вашего автомобиля.
Не экономьте на этом важном элементе – ваша
безопасность намного важнее.
А вы уже сталкивались с заменой ключа для
своего автомобиля VAG? Расскажите о своих впечатлениях в комментариях
под постом!
As a devoted golf enthusiast, I can’t stress sufficient exactly how vital the ideal devices are to not only taking pleasure in the game however likewise enhancing your performance on the training course.
Golf is as a lot a mental video game as it is physical, and having the appropriate equipment can truly make a distinction in how
you come close to each round.
To start with, allow’s talk about golf handwear covers.
Several gamers ignore the significance of a good glove.
It’s not practically preventing blisters; a handwear
cover aids you maintain a regular hold on your club, which is essential for controlling your
shots. Especially in damp or wet conditions, an excellent handwear cover can be
the difference in between a solid drive
and a wild piece. Handwear covers with a snug fit made from high-quality leather tend to supply the most
effective efficiency. They mold to your turn over time,
providing both comfort and dependability.
One more commonly forgotten accessory is the golf tee.
Yes, it’s a small product, yet the appropriate
tee can really impact your video game. For instance, utilizing much
longer tees with your chauffeur can help you attain far better launch angles, while much shorter
tees are ideal when you need even more control with your irons.
Personally, I like utilizing biodegradable or plastic tees due to the fact that they’re a lot more resilient and green.
Golf bags are an additional vital that are worthy of even more attention than they generally obtain. A properly designed golf bag isn’t just about style– it has to do with
functionality and comfort. If you favor strolling the course, a light-weight stand bag with
great storage space alternatives can make your round far more satisfying.
On the other hand, if you’re riding in a cart, a cart bag with a lot of space for all your
equipment is a must. The best golf bag assists you stay organized, which
is critical when you need to concentrate on your game.
One device that’s ending up being increasingly popular is
the rangefinder. I can not tell you how much this little
gadget has actually boosted my video game. Understanding the exact range to the pin or hazards permits
you to choose the right club with confidence. Whether you choose a laser
rangefinder or a GPS one, the accuracy these tools supply is important.
Finally, never undervalue the significance
of a good golf towel and umbrella. A towel keeps your clubs and balls tidy, making certain far
better contact and precision, while an umbrella is a lifesaver during unforeseen weather changes.
These tiny things add to the total top quality of your video game.
In conclusion, buying the right golf accessories
is vital for any individual major concerning boosting
their game. Whether it’s a handwear cover that fits
perfect, a resilient golf bag, or a modern rangefinder, having the right tools can make
every round extra enjoyable and successful. For anyone looking for comprehensive reviews and expert suggestions on the most effective golf gear, I extremely
suggest taking a look at https://abdulmoiznadeemqayum.bloggersdelight.dk/2024/10/20/in-depth-golf-club-reviews-which-clubs-can-take-your-game-to-the-next-level/.
Hi there friends, how is all, and what you would
like to say concerning this piecce of writing, iin my view iits really awesome in support of me. https://Lvivforum.pp.ua/
Efficient service with a personal touch.
can you get generic lisinopril without rx
Some trends of drugs.
Medscape Drugs & Diseases.
order cytotec without insurance
Their online portal is user-friendly and intuitive.
They’ve revolutionized international pharmaceutical care.
gabapentin 300 mg cap teva
Their commitment to international standards is evident.
I love the convenient location of this pharmacy.
can i purchase cheap cipro without insurance
Global expertise that’s palpable with every service.
A pharmacy that truly understands international needs.
can i buy cytotec tablets
Some trends of drugs.