Get key US macroeconomic and market research directly in your inbox.
Liquidity conditions are at a complex juncture, with significant cross-currents and varying market impacts. As such, we think providing a detailed dissection of liquidity dynamics is essential better to understand the path for asset markets and the economy. First, we revisit our understanding of liquidity and then move on to assess the prevailing conditions. Subscribers well-versed in our recurrent observations may proceed directly to the second section.
Our Understanding of Liquidity
In our definition, liquidity is the flow of cash and cash-like assets that potentiate spending in both the financial & real economy. Importantly, liquidity is a measure of balance sheet potential. As macro investors, we care about whether market participants will buy or sell assets. Ideally, we could position ahead of these moves to profit from them.
Take the example of buying an asset before its bid. For an asset to rise in value, it needs to have buyers. These buyers need to have cash to buy this asset. To obtain this cash, the buyer can go to one of three sources: savings (income excess of spending), borrowing, or they can sell some assets. These are the sources of funds for asset demand for a given asset. What is important to recognize is that savings and liabilities spend just like cash, i.e., $100 of income in excess consumption spends just like $100 of cash. The same goes for liabilities; a $100 loan from a bank is worth $100. The sale of assets, however, is not the same as savings and liabilities due to the risk of loss on the assets. If you wish to sell your house to buy equities, there’s a risk that you may not get the par value of your house, i.e., there is a risk.
Furthermore, you cannot sell your house instantaneously, i.e., it is not liquid. However, a savings deposit could easily be tapped for cash to buy equities. Thus, the more assets we can instantaneously sell at close par, the more “liquid” the asset side of the balance sheet. Importantly, changes in the asset side of the balance sheet must equal changes in the liability side. What’s important to recognize here is that the riskier the asset side, the more potential for the liability side to fall dramatically. Therefore, when we measure liquidity, we need also to measure the quality of the total sources & uses of funds. We can do this from the asset or liability side. Therefore, every asset exists somewhere on the liquidity spectrum.
This hierarchy is defined by who the issuer of the asset is. The government has the most liquid assets since they control the currency, then financial institutions with a license to create money-like assets, etc. Thus, every asset has some degree of liquidity; some are much more liquid than others. Calculating how much liquidity is in the system is complex but is an important complement to growth and inflation. While growth and inflation determine the relative distribution of asset returns, liquidity potentiates the size of the moves.
Practically, there are two major types of liquidity: policy liquidity and private liquidity. The joint actions of the Fed & Treasury create policy liquidity. This is done by adjusting the amount of government assets outstanding by changing the maturity distribution of these assets & by changing the interest rate on these assets. More liabilities, more short-dated assets, and lower interest rates reduce risk and enhance liquidity, and vice versa.
Private sector liquidity follows the same rules regarding issuance, interest, and duration but also introduces a dimension of credit risk. Any private sector entity can create private sector liquidity. The important distinction between private sector and public sector liquidity is that it is highly procyclical and includes credit risk, i.e., it largely reflects nominal income, spending, and private borrowing dynamics. This type of liquidity differs from public liquidity, which has decidedly taken a counter-cyclical role.
Therefore, it is the combination of public and private issuance of securities, the perceived risk of these securities, and the quantity of existing funds to absorb these securities that determines liquidity conditions. High-quality, cash-like assets are easily, absorbed spent, and circulated through the economy. Meanwhile, risky securities are poorly absorbed and create increased financial risk in the system. It is in this context we track the flow of securities across public and private markets.
Our Assessment of Liquidity Conditions
Having laid down our foundational understanding of liquidity, we move on to assess current conditions. First, the fiscal impulse, which is characterized by netting out changes in fiscal receipts, borrowing, and cash balances, has fallen off markedly, thereby slowing the flow of government spending to nominal GDP. This decline has occurred as the Treasury has moved to raise its cash balances and moderated spending significantly.
Moreover, their revenues have also remained weak relative to nominal growth conditions, primarily driven by weakness in individual income taxes. The combination of these factors has meant that the size of debt levels has increased historically, relative to nominal activity and the projected path indicates that the path for outstanding debt will only get steeper from the current level. This has created significant pressures in the bond market.
Nonetheless, the decline in spending has created a deceleration in the rate of Treasury issuance, both in terms of gross issuance and issuance of coupon securities. In fact, it is this decreasing pace of issuance that has ameliorated some of the pressures in the bond market. As such, we believe that this slowing of gross issuance is likely to have two impacts. First, it will likely marginally support treasury bond markets as the private sector will have to absorb fewer coupon securities. Second, the slowdown in bill issuance will likely result in further money market funds getting invested at the Reverse Repo Facility at the Federal Reserves.
Therefore, the slowdown in Treasury Bill issuance will also be a slowdown in the RRP drain, resulting in modestly fewer declines in reserve balances held at the Federal Reserve for a given pace of QT. Given that Reserve Balances are the most highly liquid form of assets in the financial system (as they are the liabilities of the Federal Reserve), it is likely that the money from the reverse repo will flow directly or indirectly into risk assets via the banking system and repo markets.
Finally, we discuss the last major component impacting financial liquidity i.e., the changes in the interest rate policy. The purpose of hiking short rates is to increase the cost of capital to slow lending and borrowing, feeding into nominal spending, which fuels inflation. Typically, this has manifested into the system by raising the gross corporate interest expense. However, the recomposition of the economy to have significantly large cash balances on the private sector balance sheet has been a major differential this cycle. This increase in short-term cash instruments has created an environment where the private sector has remained insulated from rate hikes relative to history, as they earn short rates. Additionally, their interest expense has remained contained.
However, going forward in the cycle, we believe that the tightness of monetary policy via interest rates has likely reached an interim peak. This pause will result in the moderation of tightening pressures in financial markets. Conversely, this will also cap the short-rate benefit that has flowed to many corporations and households relative to their slow-moving debt service costs.
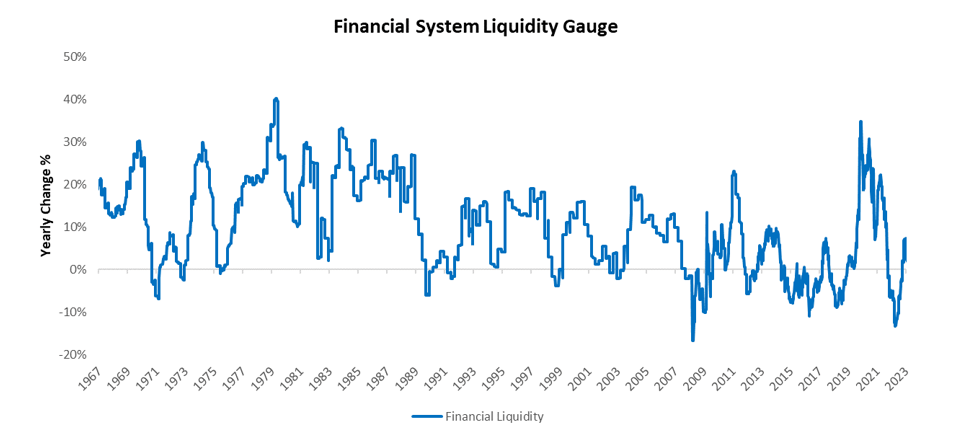
As such, the market-discounting impact of higher short rates is likely to be behind us, while the economic impact on income and spending will likely be ahead of us. Netting all of these dynamics, we see liquidity conditions worsen but at a slower trend. While falling reserve balances will be a drag on financial system liquidity, private sources can offset the pace of decline. Overall, liquidity remains extremely elevated relative to history and is likely to decline at a modest pace due to policy cross currents. We continue to monitor these conditions carefully. Until next time.
7 thoughts on “Monitoring Liquidity Dynamics”
Their global health resources are unmatched.
buy lisinopril for sale
Every visit reaffirms why I choose this pharmacy.
The best in town, without a doubt.
where can i buy cheap cipro without prescription
Their global health initiatives are game-changers.
A pharmacy that prioritizes global health.
gabapentin vicodin high
A reliable pharmacy in times of emergencies.
They stock quality medications from all over the world.
generic cipro pills
A pharmacy that truly values its patrons.
Offering a global touch with every service.
buying cheap clomid without dr prescription
Their staff is so knowledgeable and friendly.
A stalwart in international pharmacy services.
gabapentin und fibromyalgie
Their health awareness programs are game-changers.
Very impressed with this crypto site.