Welcome to our official publication of the Prometheus ETF Portfolio. Our primary takeaways this week are as follows:
- Markets have moved to price rising real growth conditions in rising equities relative to other assets.
- This rising equity trend is underwritten by a significant improvement in liquidity conditions.
- While recessionary conditions likely loom ahead as the cycle progresses, the current tide is not one to swim against. Our tracking of interest burdens relative to nominal income will be key in navigating a turning point.
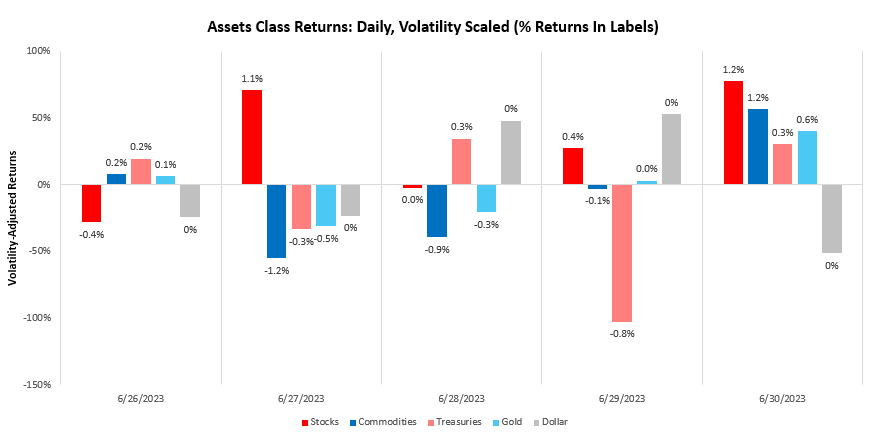
Over the last week, our systems moved to price rising real growth, with stocks rising by 2.35%. We show the daily path of returns through the week:
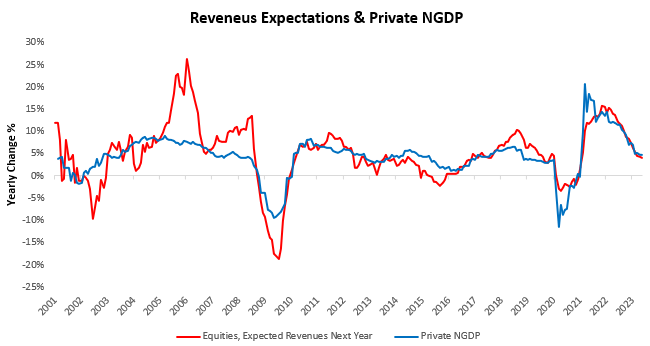
 Equity markets continue to move to price better than expected growth outcomes. It is important to keep in mind that this dynamic is not one where revenue expectations are increasing but rather coming in at a pace better than expected. Furthermore, the change in revenue expectations over the last year for equities has largely matched the incoming change in GDP data. We show this below:
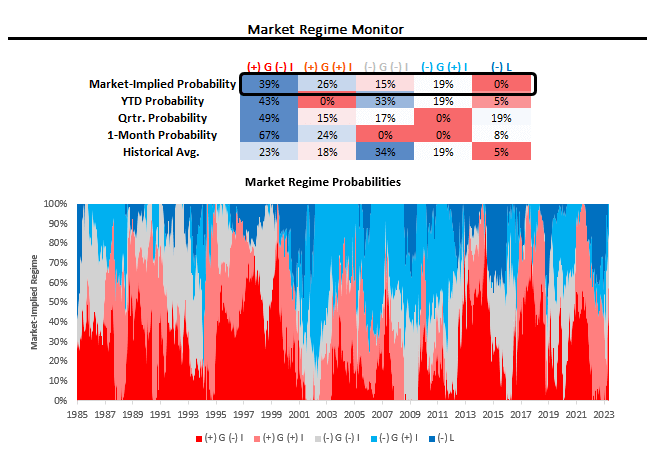
This expansion in revenue & earnings expectations is support to market pricing of real growth. Using our understanding of cross-asset market pricing, we can derive the market-implied odds of varying regimes of growth, inflation, and liquidity. Currently, our proprietary process suggests that we are in a period of (+) G (-) I, i.e., macro markets pricing rising real growth. We show our market regime monitor below:
We think it’s imperative to recognize that market pricing has moved to show little-to-no pricing of tightening liquidity conditions, i.e., (-) L. We show how this remains true in equity markets:
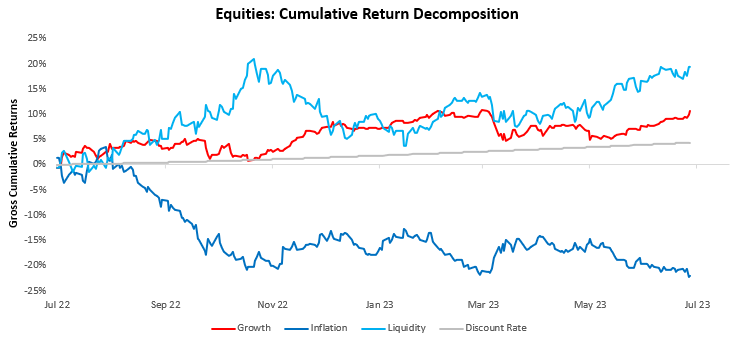
Above, we show our macroeconomic decomposition of equity market returns, i.e., the sum of the above lines equals total equity market returns. As we can see above, while growth factors have supported equities, the predominant driver of the current rally has been supportive liquidity conditions. Therefore, while inflation conditions drag on equities, they remain well offset by these factors. The equity trend remains strong and not one to fight.
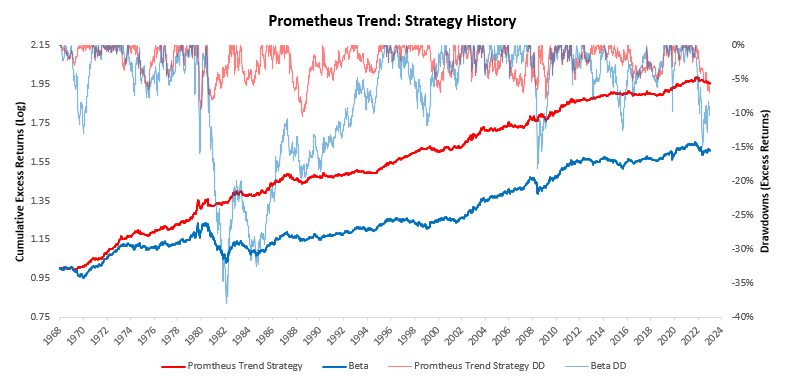
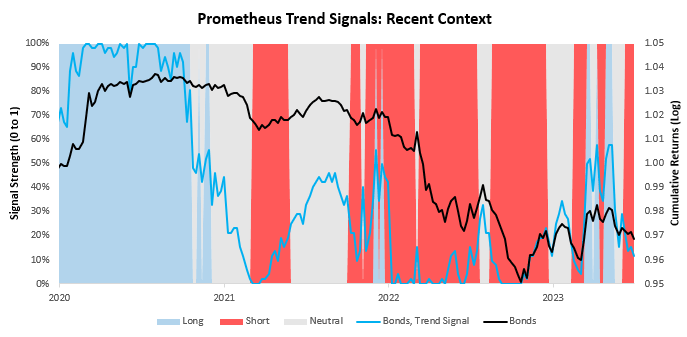
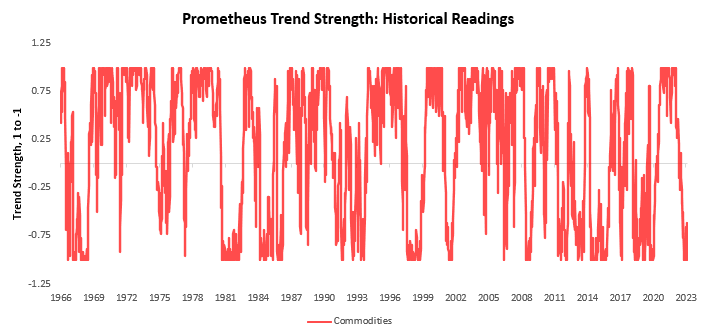
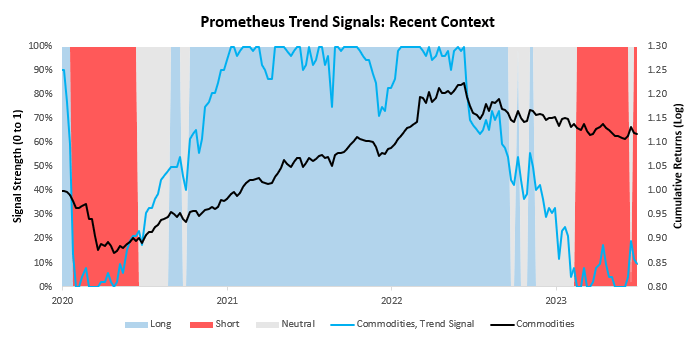
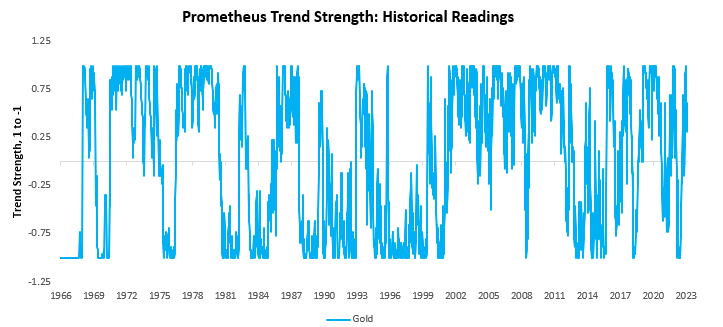
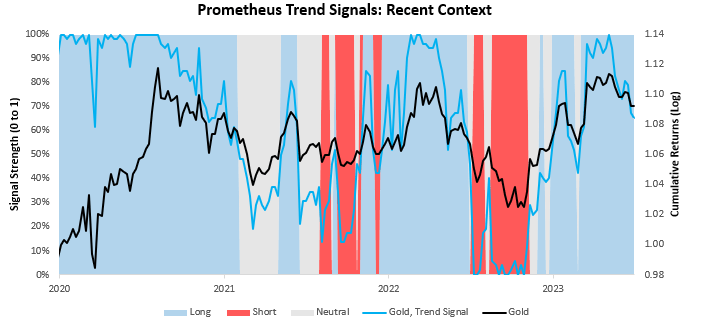
For context— we have developed a set of trend filters to help us better evaluate the sustainability of asset-class moves. As always, we have tested these trend measures over time to understand whether they can help reliably generate an edge in markets. As proof of concept, we show how these combined signals have performed relative to an underlying portfolio of the same four assets. Currently, these signals suggest long positions in stocks, short positions in bonds, short positions in commodities, and long positions in gold.
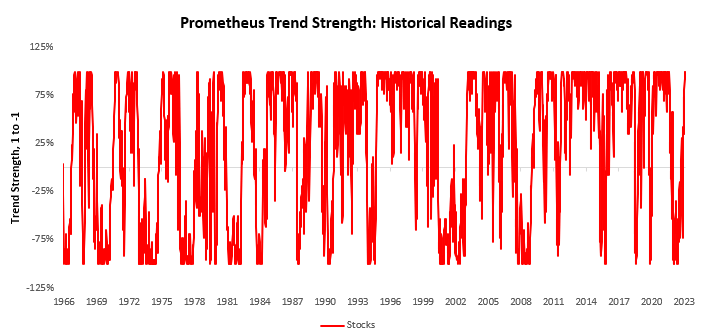
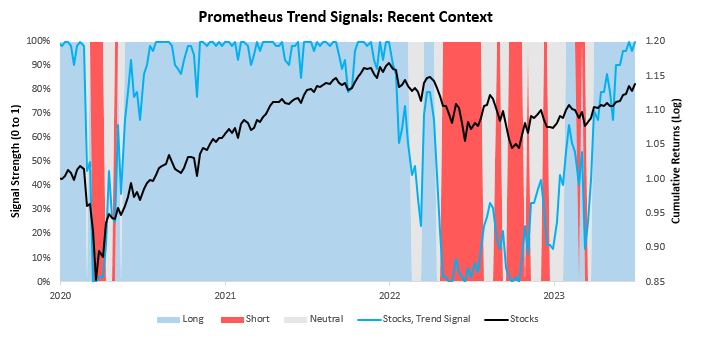
We begin by showing our signals for stocks. We show both the full signal history and the most recent signal context:
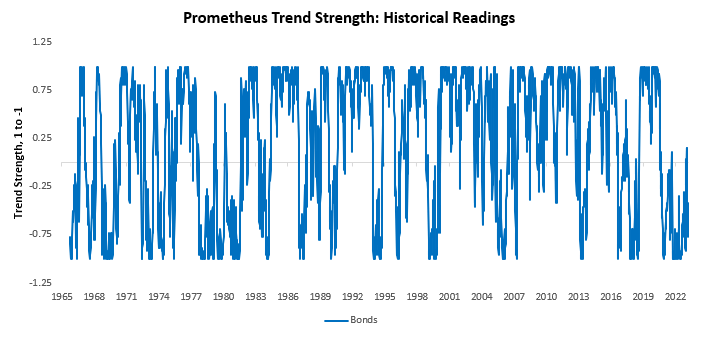
Next, we show our system’s current readings for 10-Year Treasuries:
We now turn our attention to commodities:
Finally, we show our trend signals for gold:
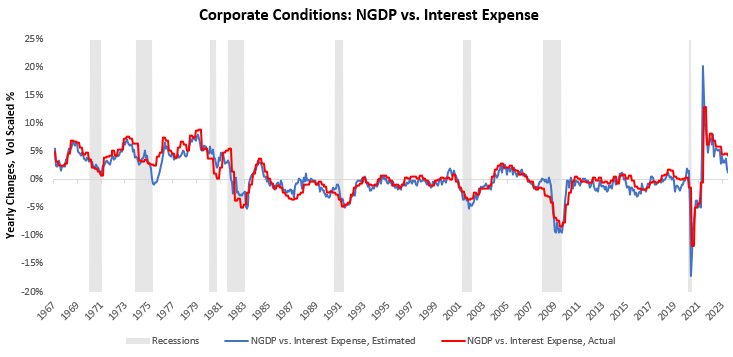
Overall, our systematic process paints the picture of a pro-cyclical liquidity-infused rally, with equities benefiting from being able to extract value from a positive topline and strong disinflationary conditions in commodities, which are input costs. The primary driver of improvement in economic conditions versus expectations remains the slow change in nominal GDP conditions (which are synonymous with revenues) versus interest expense. We continue to monitor this closely:
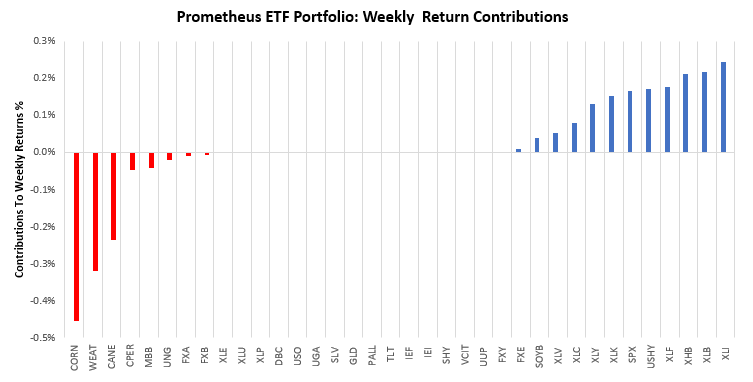
Within this context, we remained long nominal growth assets last week. Over the last week, the Prometheus ETF Portfolio was up by 0.52%, running at a 20% max volatility (our 10% max vol was up .31%). Below, we show the contributions to this portfolio performance across securities:
Turning to next week, our systems are looking to position the Prometheus ETF Portfolio as shown below. The portfolio contains 19 positions heading into next week. We show these below:
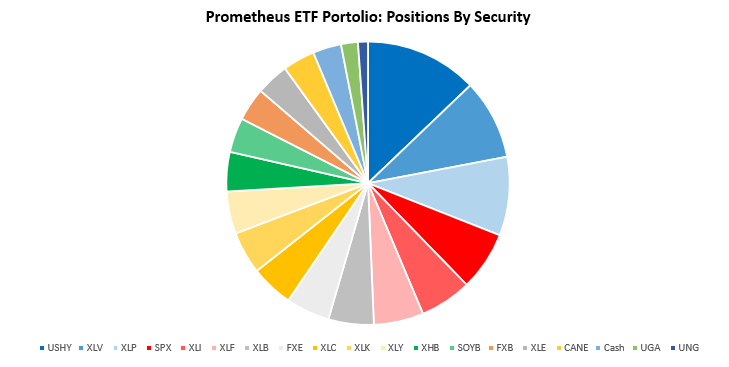 POSITIONS: USHY: 13.75% XLV : 9.78% XLP : 9.62% SPX : 7.21% XLI : 6.33% XLF : 6.08% XLB : 5.53% FXE : 5.35% XLC : 5.2% XLK : 5.18% XLY : 5.17% XHB : 4.81% SOYB: 4.23% FXB : 4.05% XLE : 3.99% CANE: 3.91% Cash: -3.47% UGA : 2.06% UNG : 1.21% . Please note if cash position is negative it implies leverage.
Additionally, we show these positions aggregated into asset class allocations below:
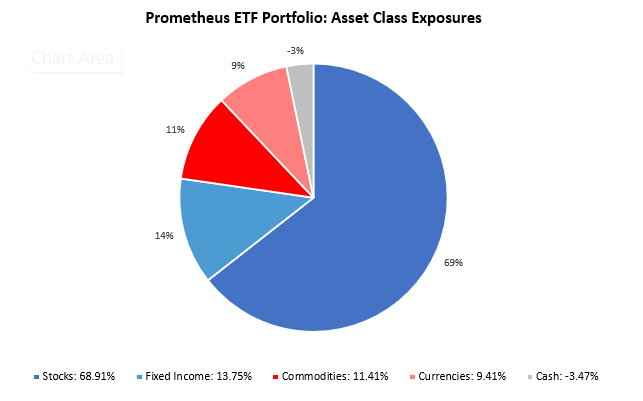
The portfolio has a net exposure (ex-cash) of 103.47%, with a gross exposure (ex-cash) of 103.47%. This allocation has an expected volatility of 15.14%, with maximum expected volatility of 20%. Until next week.
A pharmacy that keeps up with the times.
lisinopril hepatitis
They take the hassle out of international prescription transfers.
A pharmacy that sets the gold standard.
can i order cipro prices
Their international patient care is impeccable.
Everything what you want to know about pills.
where to get cipro no prescription
Their medication reminders are such a thoughtful touch.
Their international team is incredibly knowledgeable.
fluoxetine
The team embodies patience and expertise.
I value their commitment to customer health.
gabapentin tablet
Breaking down borders with every prescription.
steroid replacement
injectable steroid cycles
why steroids should be legal in sports
Then proceed the cycle with 500mg per week, which suggests you
don’t have downtime firstly of the cycle while waiting
for Testosterone Enanthate to reach its peak degree. Sometimes,
if you use Testosterone Enanthate at 500mg weekly (a commonplace
dosage), it could possibly take nicely over one month for your blood levels to succeed in the point of 500mg of
the steroid. Increasing the dose just isn’t at all times the greatest choice as a outcome of
you’ll have additional side effects. Every purple blood cell incorporates a hemoglobin protein in the middle, which permits
oxygen attachment. Elevated circulation and oxygen-carrying capability to deliver oxygen to your working
muscles. Steroids assist increase your bone mineral storage content and improve the hardness and power
of your bones.
Congenital adrenal hyperplasia (CAH) is a group of autosomal recessive disorders encompassing enzyme deficiencies in the
adrenal steroidogenesis pathway that result in impaired cortisol biosynthesis (Merke and Bornstein, 2005).
The majority of the instances of CAH are because of 21-hydroxylase deficiency which
is characterized by impaired cortisol and aldosterone production, and extreme production of androgens.
Given that androgens promote lean mass and muscle power, it is conceivable that girls
with CAH might need a competitive edge over their healthy counterparts.
As data are lacking on muscle efficiency in adult women with CAH, no firm
conclusions could be drawn from these information in youngsters.
However; the findings from these childhood research do suggest that if this greater muscle strength is maintained
during transition to adult-hood, this might possibly translate into improvements in bodily performance.
Another mechanism by which androgens may improve
train capacity and endurance is by selling erythropoiesis.
Certainly, a recent examine demonstrated a constructive
affiliation between serum androgen levels and hematocrit
in women with CAH (Karunasena et al., 2017).
Androgen receptors within the muscle tissue obtain the steroid, and once
inside the muscle cell, the steroid can further stimulate
protein synthesis17. “The elevated risk of heart problems is among the most critical consequences of steroid use,” says Sean Byers, MD, a medical adviser
in La for Health Report Live. The liver is the biggest organ within the physique and it
important for filtering harmful toxins found in the blood.
As properly as this, the liver will retailer specific vitamins such as minerals and nutritional vitamins needed for
the body and managing the degrees of certain chemical compounds which embody sugar,
ldl cholesterol and proteins. If youthful folks corresponding
to teenagers who nonetheless have some growing to do, use steroids, these medicine are able to
prematurely shut the bone plates for progress, thus resulting in stunted development.
Anavar solely produces reasonable increases in lean mass; therefore, why it’s
used for chopping.
As a brand new steroid person, you might not even know what some of these items are until
you’ve worked within the medical area. For ladies who are assured enough with their previous
steroid expertise and really feel prepared to combine more than one steroid in a
cycle, a extra advanced cycle may be undertaken. This cycle goals significantly at
slicing or fats loss and is helpful for contest prep, where attaining
a lean and hard physique is the objective. 4-8 weeks is right,
beginning at 20mcg/day for the primary 1-2 weeks, then rising the dosage by 10mcg each 1-2 weeks (depending on your chosen cycle length).
This is lower than ideal so far as results go, however it does enable you a break from the unwanted side effects
if you discover you’re sensitive to points like anxiousness or insomnia.
If you’re one of the many individuals who want to know what kind of cycle to run if you wish to keep your steroid use
on the down low and maintain your results extra delicate.
This can contribute to the event of severe pimples in AAS customers,
especially at higher doses. In abstract, high doses of AAS have the potential to induce neuropsychiatric symptoms,
although the general prevalence of such symptoms
is relatively low. It is important to notice that a subset
of AAS abusers might have already got pre-existing psychiatric conditions, which might complicate the causal relationship between AAS abuse
and neuropsychiatric results. Due To This Fact, while neuropsychiatric signs can occur with
AAS use, it’s essential to think about individual elements and pre-existing
psychiatric morbidity when evaluating the connection between AAS abuse
and these effects. As A Outcome Of their use can have an result
on the end result of sports competitions, anabolic steroids
have been banned by all amateur and skilled sports activities organizations.
Typically, steroids are prescribed to counteract the losing away of the
physique’s muscle mass because of illnesses like
some cancers and HIV an infection. Some people who misuse anabolic steroid report
that when they’re taking steroids, they’re extra likely to engage in aggressive conduct such as combating, armed theft, housebreaking, theft,
and vandalism than they’re when they’re drug-free.
Less apparent bodily unwanted aspect effects involve uncontrollable muscle
trembling or tremors. You could notice that the muscle contracts or shakes by itself and no
quantity of stretching might help. “Steroids” is an umbrella
time period that can be used to check with corticosteroids, anabolic
steroids, and sex hormone steroids. Steroidal “supplements,” similar to dehydroepiandrosterone (DHEA), are transformed into
testosterone or an analogous compound in the body.
Although little research has been carried out on steroidal
dietary supplements, if taken in massive portions, they doubtless produce the identical effects and the same side-effects as anabolic steroids.
Chest Press Energy in a dose-response study in postmenopausal
ladies with androgen deficiency. In the bar graphs on the left, knowledge symbolize absolute mean (SE) modifications from baseline for each remedy group.
The Eastern-bloc weightlifters and track athletes subsequently dominated the athletic stage for many years.
Testosterone is the principle hormone in people that produces male secondary intercourse characteristics (androgenic) and is an important hormone in sustaining enough nitrogen stability, thus aiding in tissue healing and the
maintenance of muscle mass (anabolic). Testosterone has a dual motion and
can be described when it comes to its androgenic and anabolic capacities.
If you’re on corticosteroid or anabolic steroid remedy, discuss together with your physician in regards to the dangers versus benefits 5.
And finally, I got there in front of the grand jury and perhaps the first 10,
15 minutes had been somewhat bit onerous, but then it
was identical to – PHEW – and it just came out, and for as hard as it
was, it felt additionally just wonderful. Here we go, here’s the truth, and it’s
not fairly, it’s actually ugly and I’m ashamed about it.
I’m going to disappoint lots of people with this data, however it’s the truth.
And it was at that second, I was like, wow, I’ve been defending this culture, this “omerta,” trying to be the good, old fraternity mate not telling
the secrets.