Welcome to our official publication of the Prometheus ETF Portfolio. Our primary takeaways for last week are as follows:
- Markets have moved to price-in-tightening liquidity conditions, in line with our expectations in our latest Month In Macro note.
- Economic data this week moved to show sequential resilience within a cyclical slowing. This data continued to benefit stocks relative to bonds.
- The current mix of policy liquidity conditions is adequate to engineer an economic contraction, but the pressure needs to be sustained by policymakers.
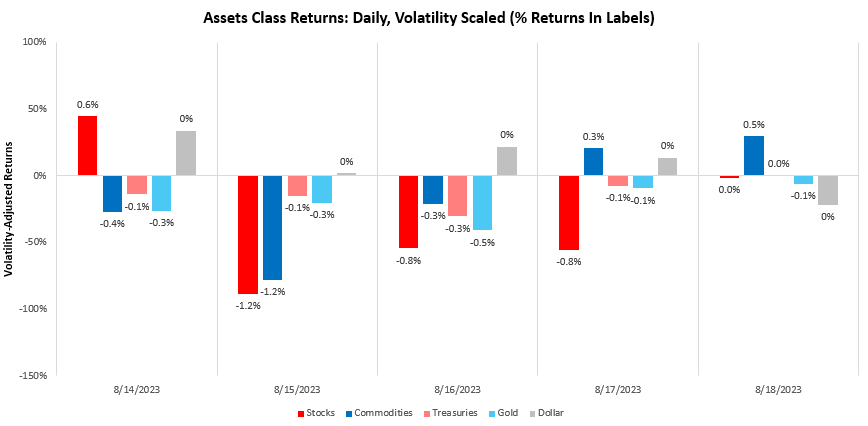
Let’s dive into the data driving our assessment. Over the last week, our systems moved to price in tightening liquidity, with Dollar rising by 0.51%. We show the daily path of returns through the week:
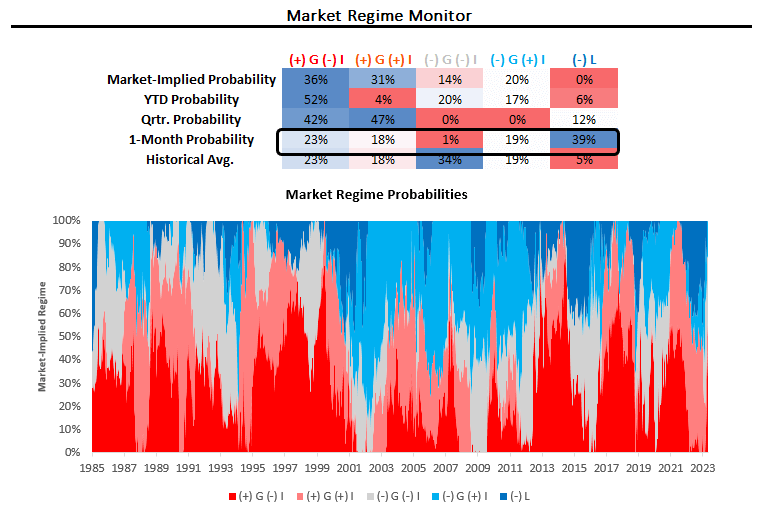
Using our understanding of cross-asset market pricing, we can derive the market-implied odds of varying regimes of growth, inflation, and liquidity. Currently, our proprietary process suggests that we are in a period of (+) G (-) I (-) L. We show our market regime monitor below:

As we can see above, the most recent market pricing has been consistent with tightening liquidity. Now, while liquidity determines returns across asset classes, growth, and inflation determine the relative returns between asset classes. In this context, major economic data this week (i.e., retail sales, industrial production, residential investment, jobless claims) remained consistent with the picture of resilient nominal growth conditions. We briefly take a look at each.
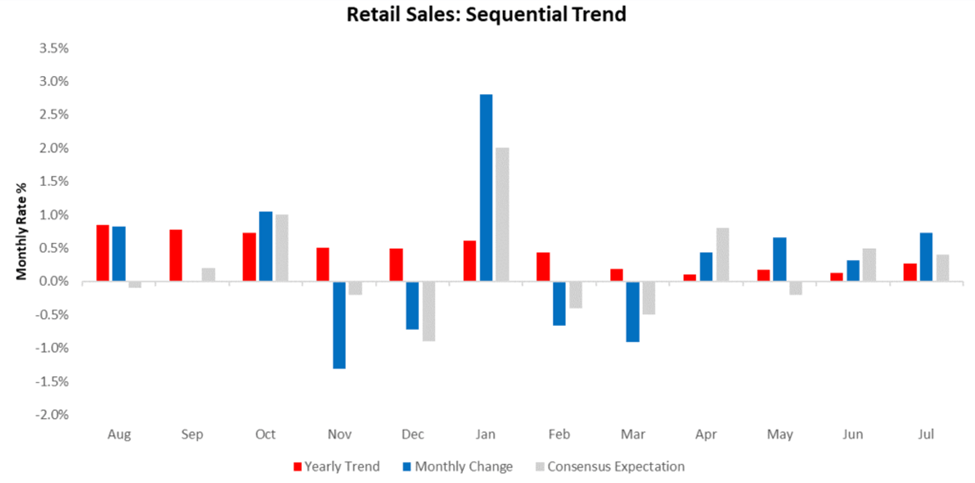
Retail Sales increased by 0.73% in July, surprising consensus expectations of 0.4%. This print contributed to a sequential acceleration in the quarterly trend relative to the yearly trend:
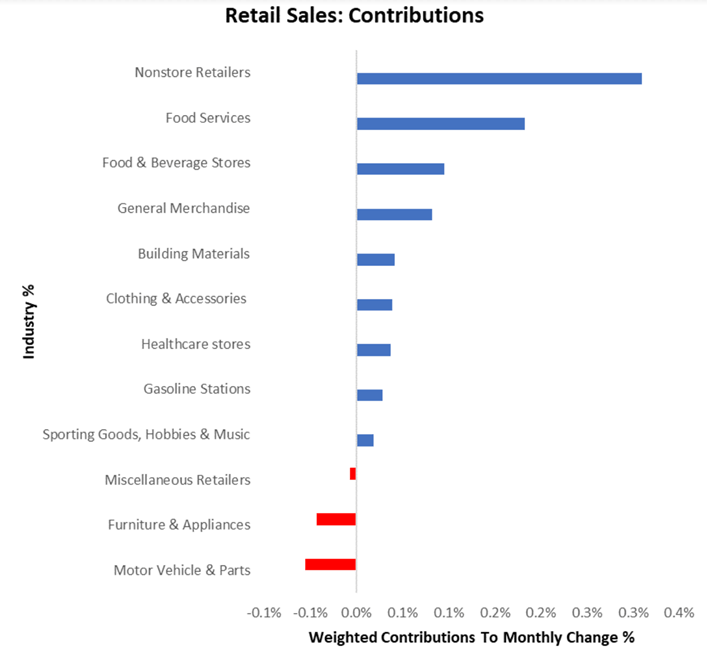
Moreover, the composition of gains was also broad-based:
Over the recent past, our estimates of real retail sales have moderated higher after intense deflation, marginally supporting consumer spending, which is consistent with a resilient nominal economy:
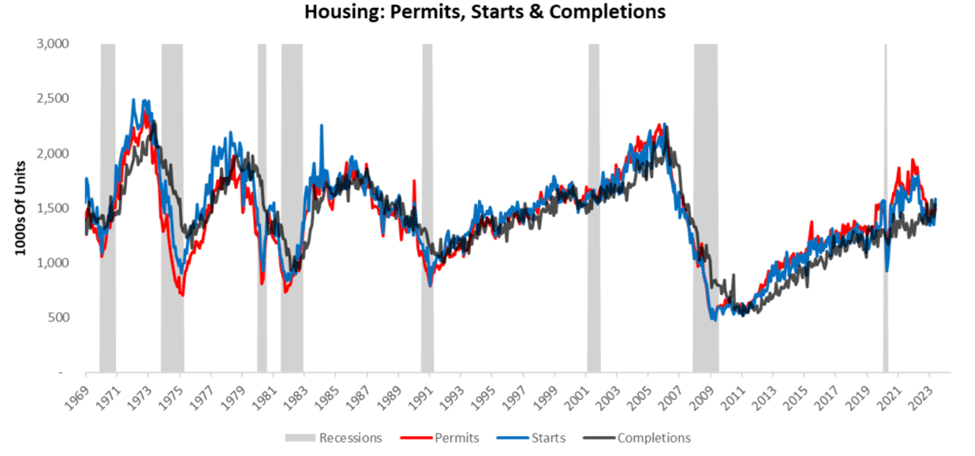
The latest residential data for July showed that housing permits increased by 0.07%, housing starts increased by 3.86%, and housing completions decreased by -11.82%, surprising consensus expectations.
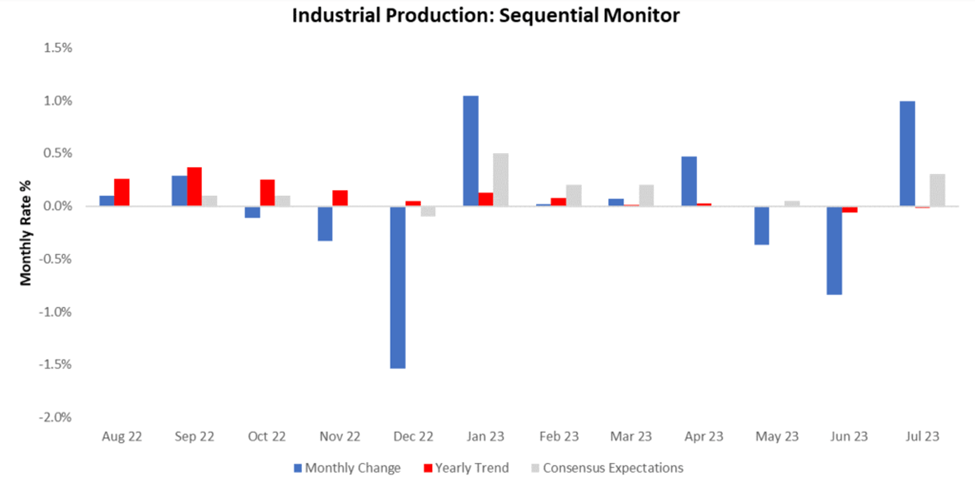
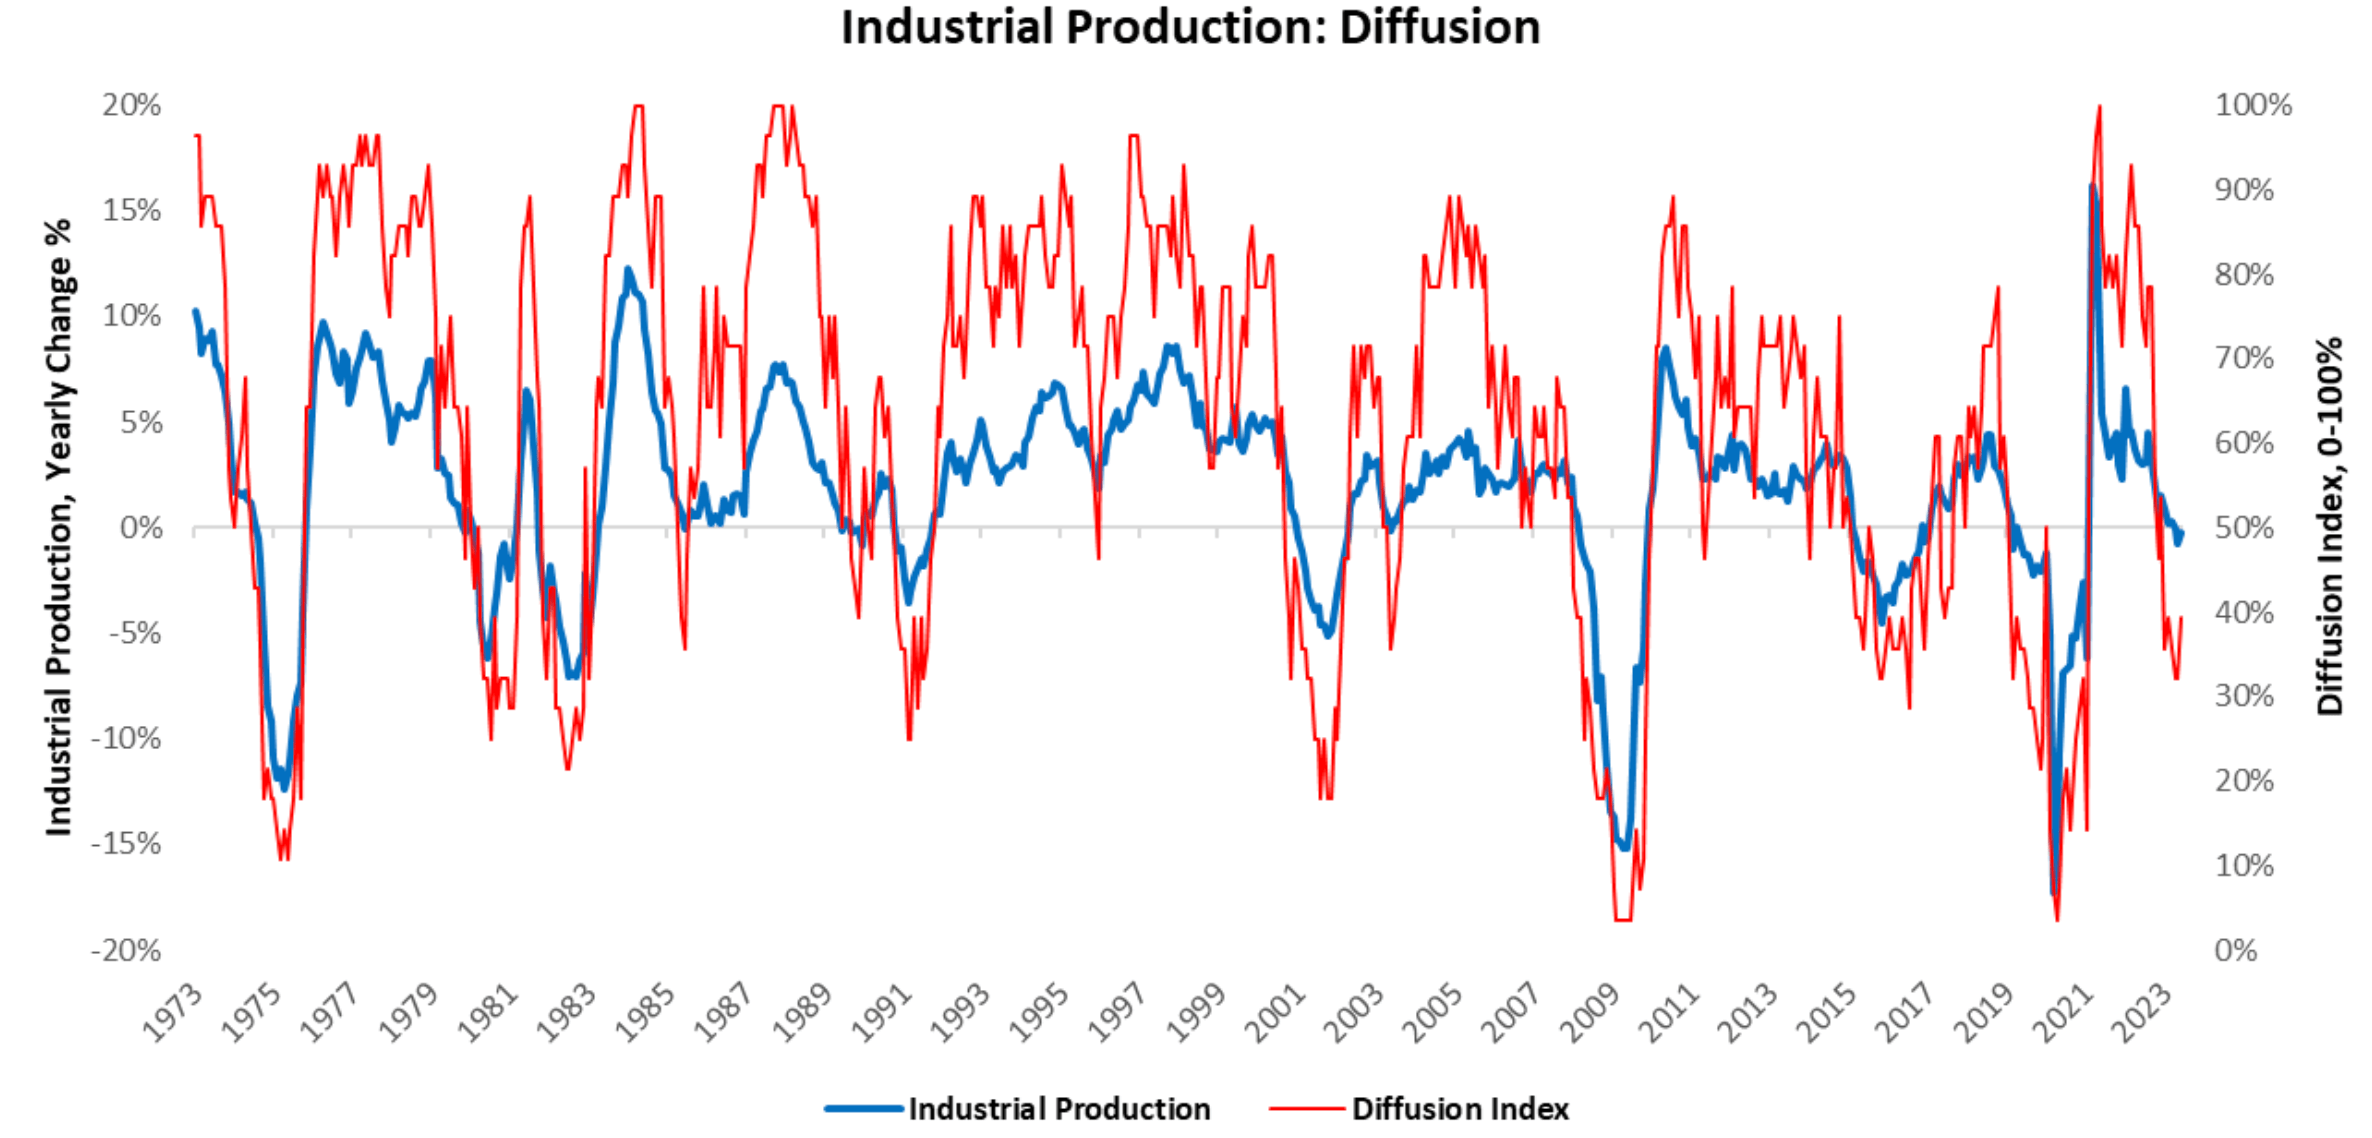
Next, the latest data for industrial production showcased similar dynamics. In July, Industrial Production increased, coming in at 0.99%, surprising consensus expectations.
Energy and Autos were the main categories contributing to this print:
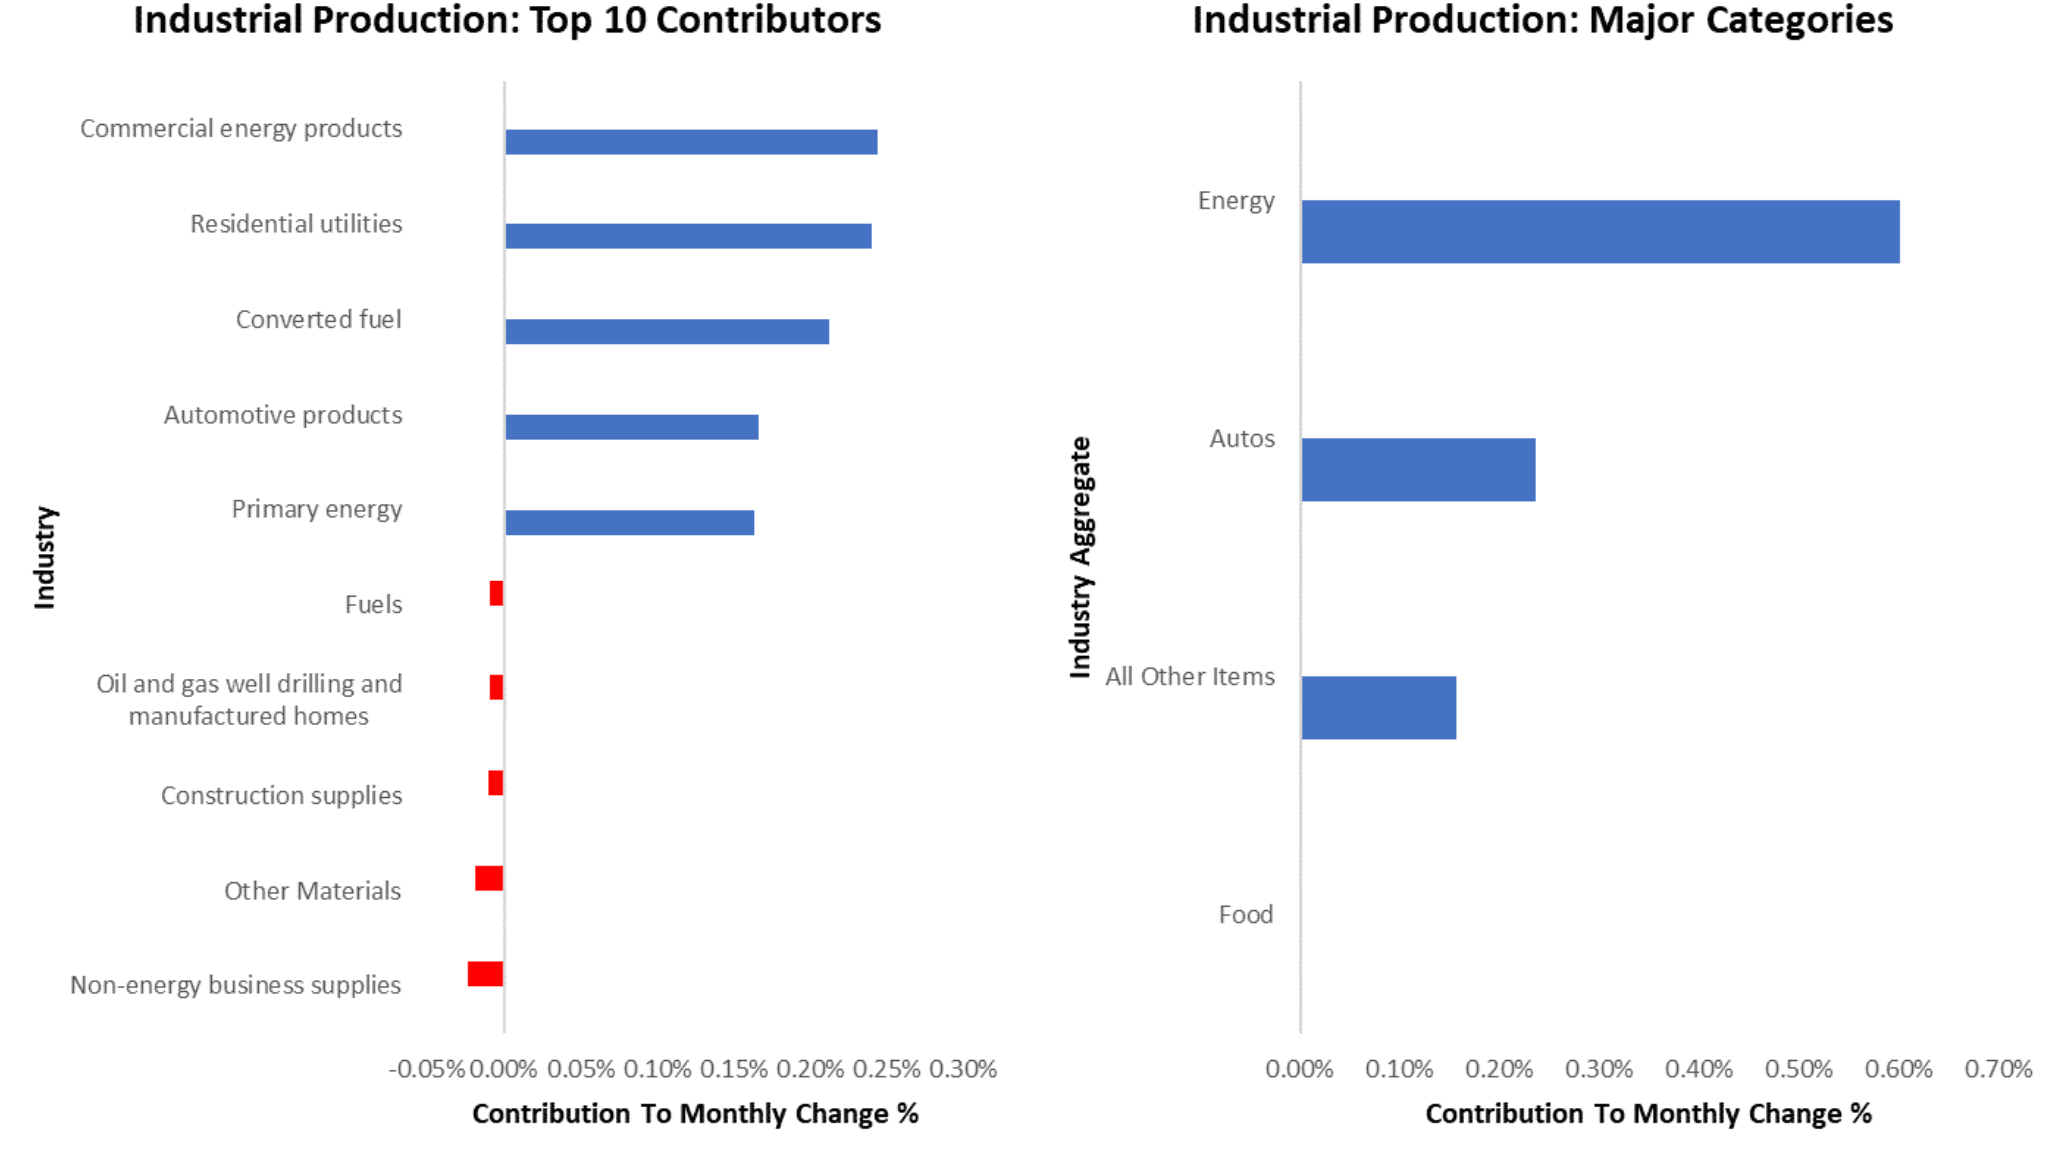
Zooming out, industrial production still remains in the contractionary territory versus one year prior, with 61% of the industries contracting. However, its impact on the wider growth cycle has been negligible.
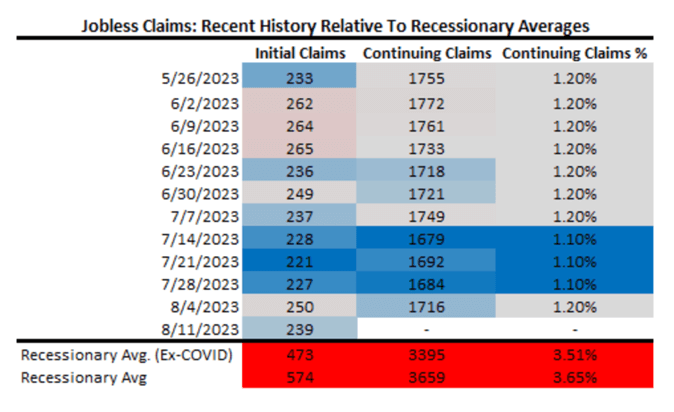
Finally, Initial Claims disappointed expectations coming in at 239 versus the expected 240, while Continuing Claims surprised expectations coming in at 1716 versus the expected 1700.
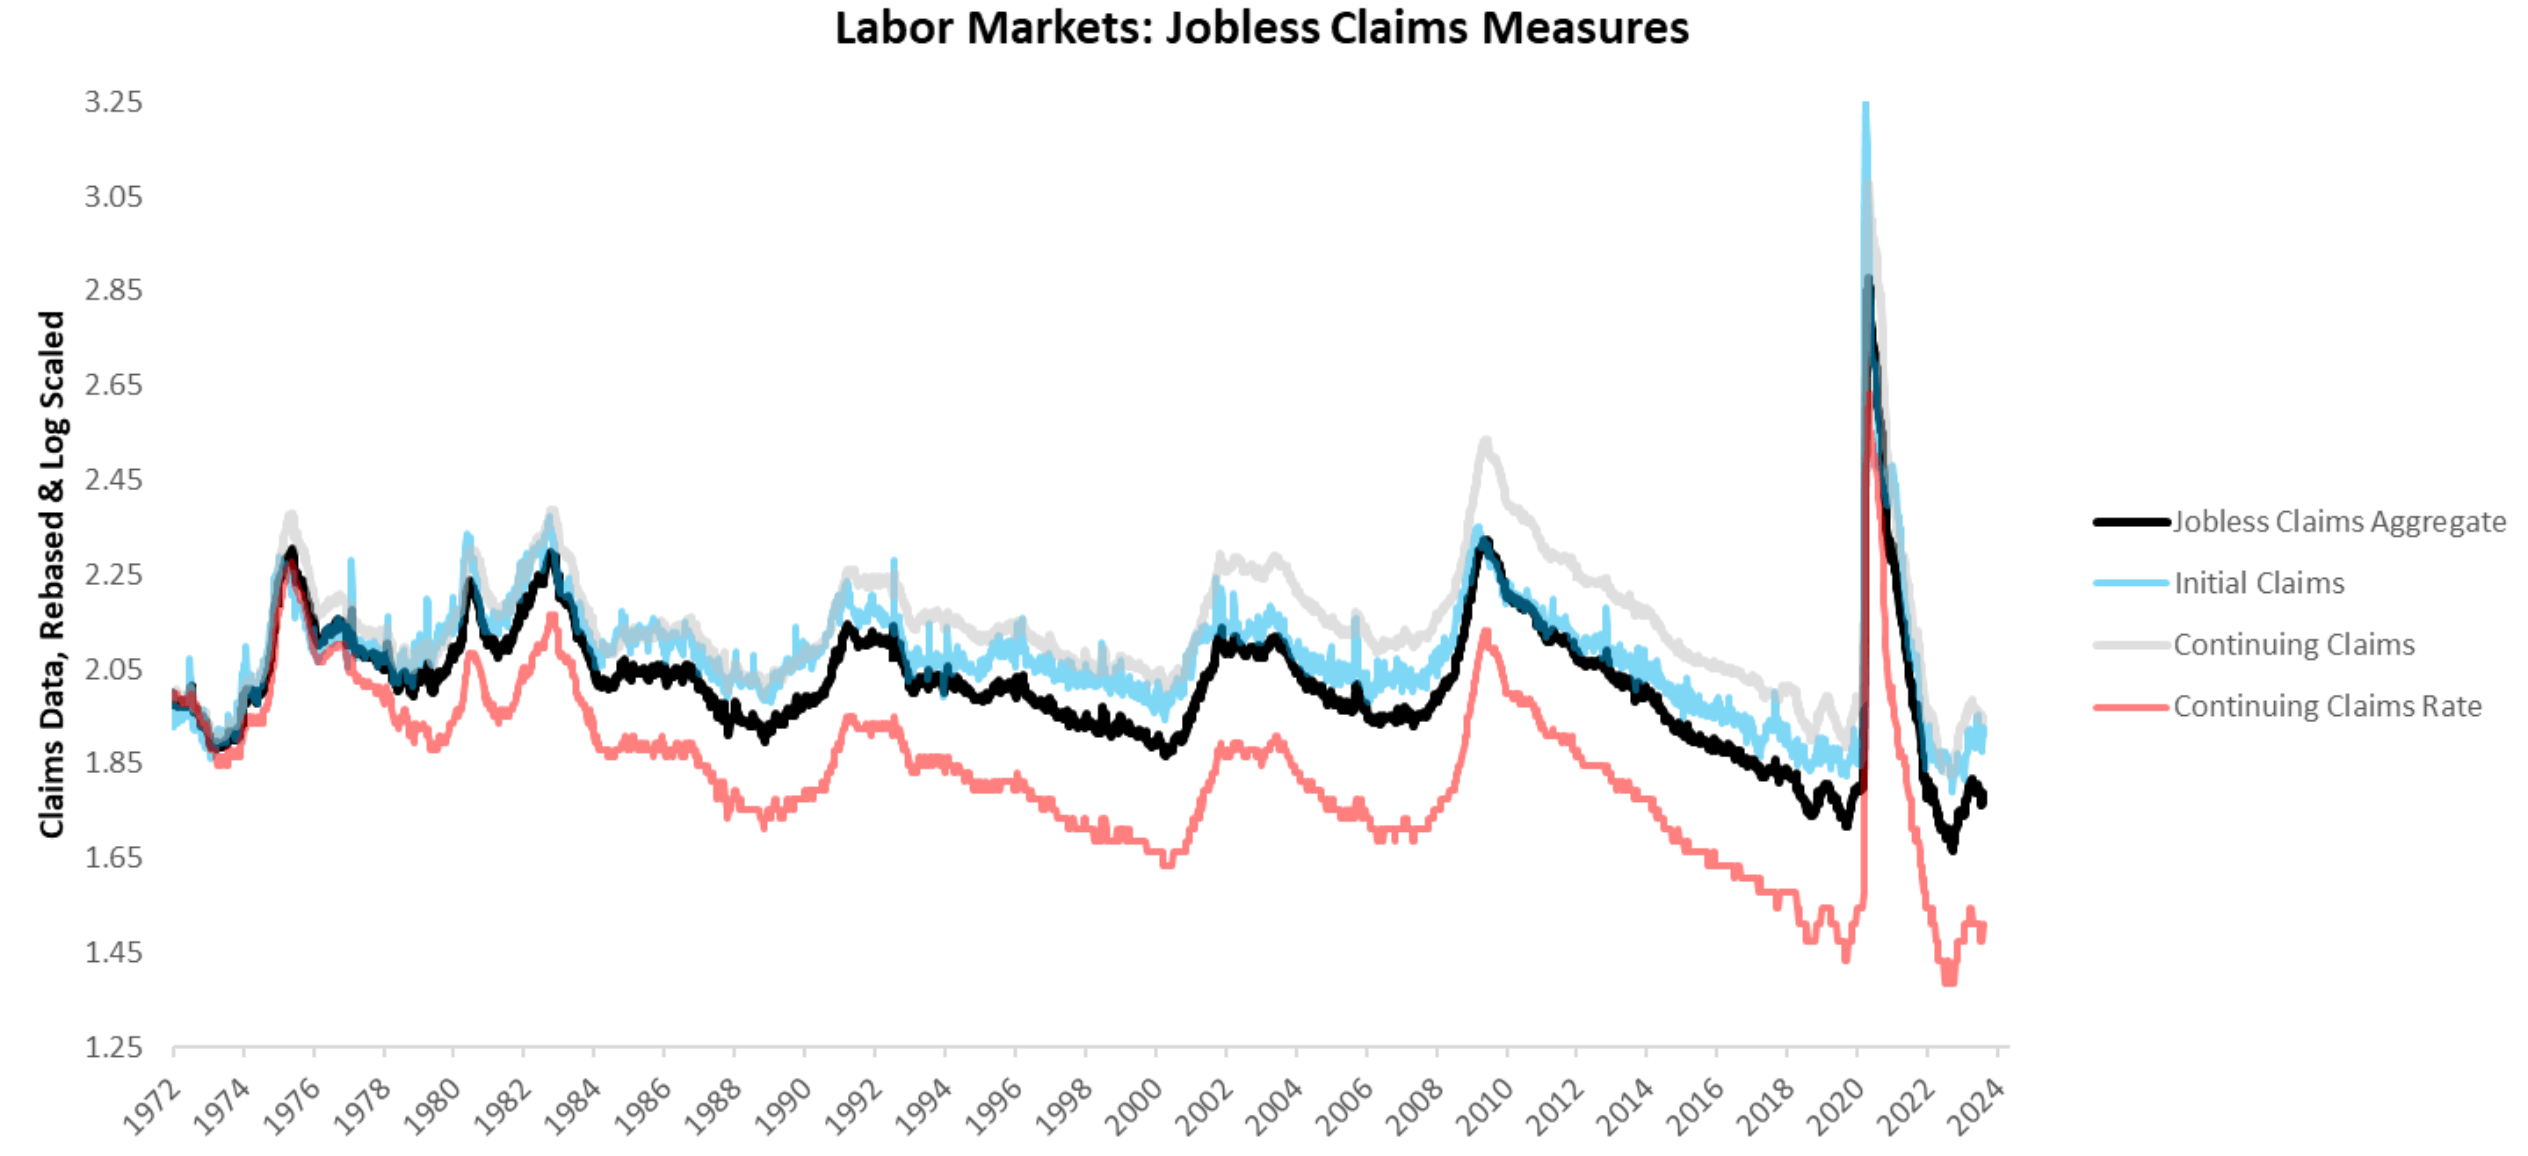
Additionally, the recent evolution of jobless claims data over the last twelve weeks tells us that we are a ways off from recessionary territory.
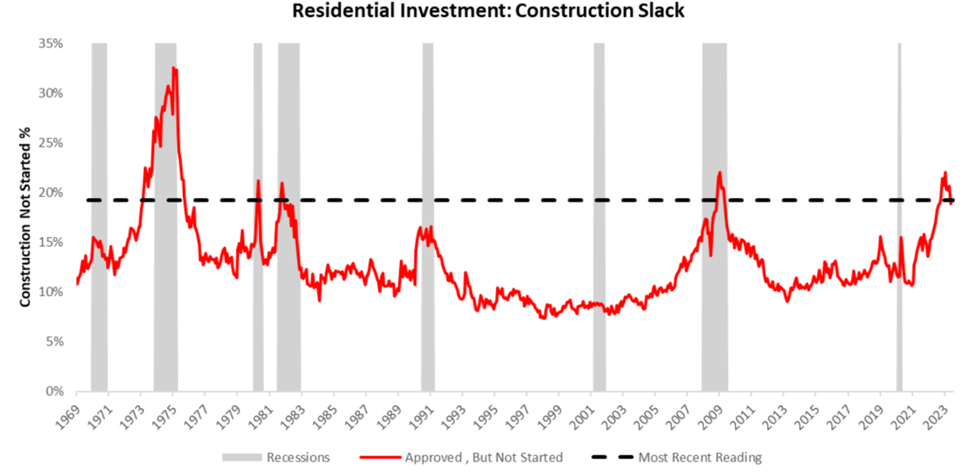
Looking ahead, industrial production and residential investment need to deteriorate very significantly to catalyze weakness in the broader economy. Until then, nominal resilience continues to support our view on long stocks and short bonds.
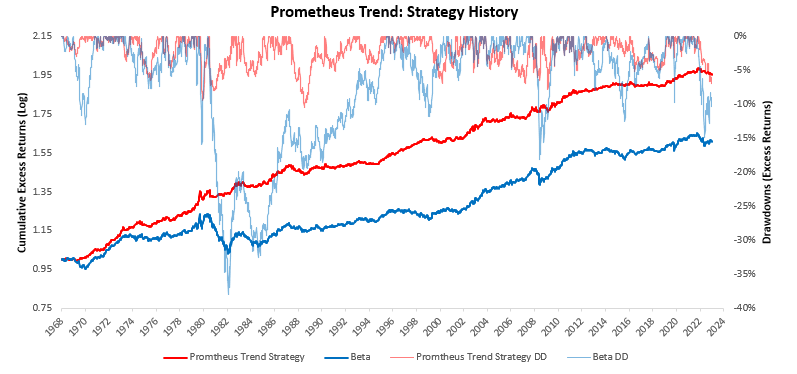
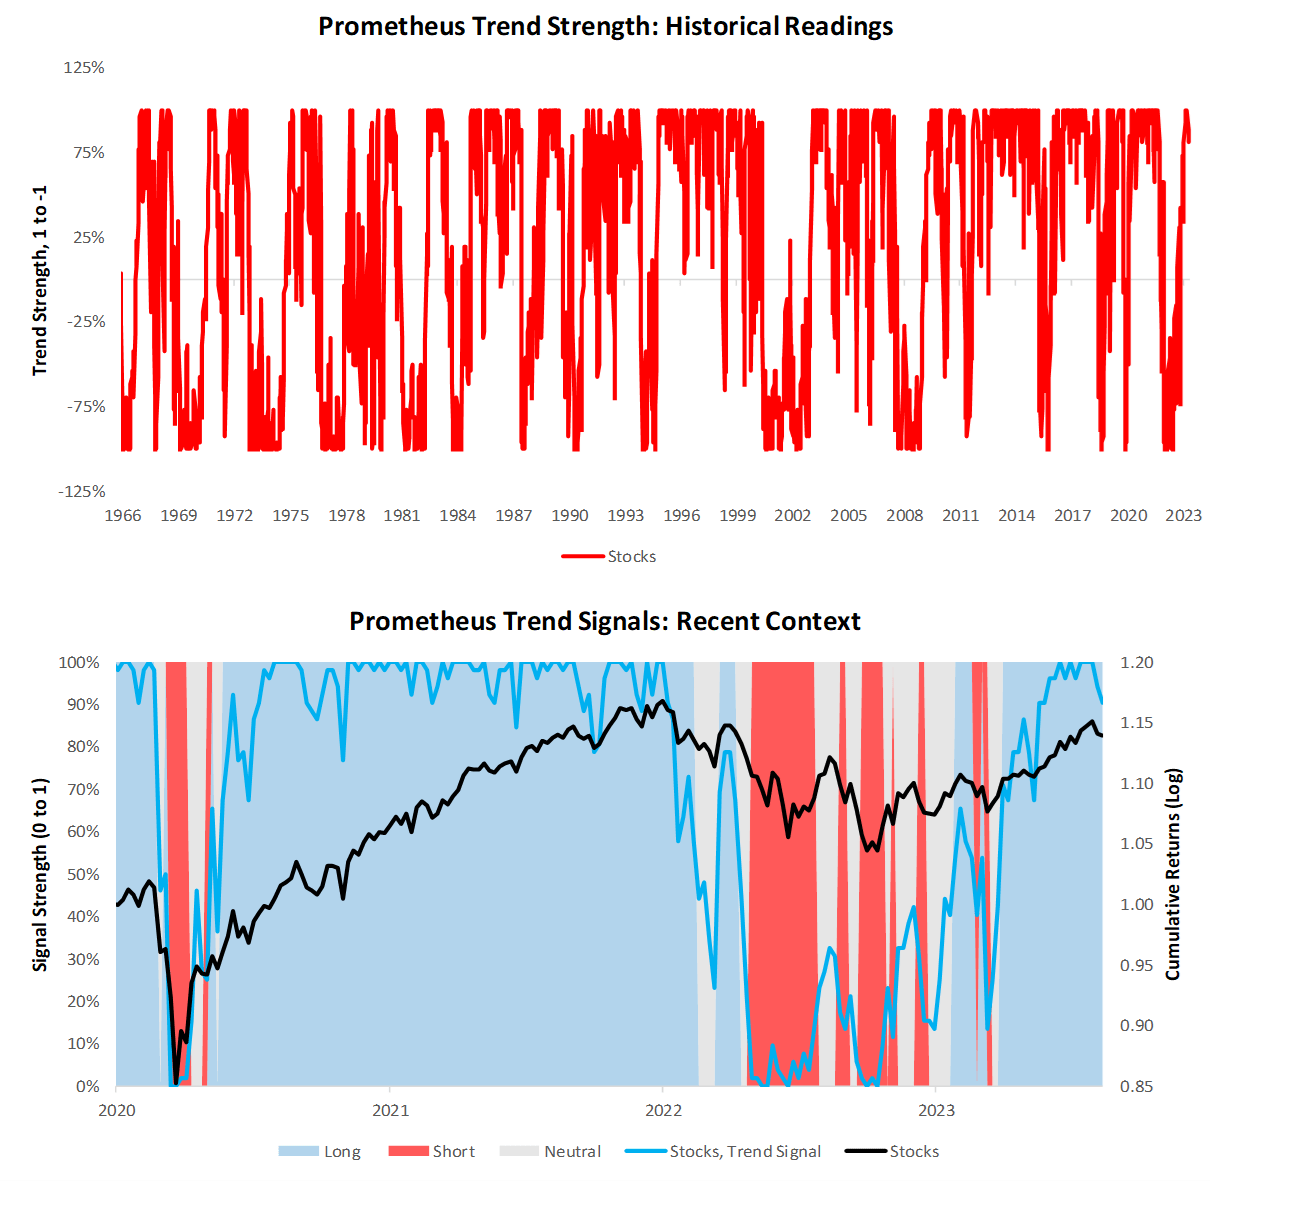
This view is further supported by market trends captured in our trend monitors. For context— we have developed a set of trend filters to help us better evaluate the sustainability of asset-class moves. As always, we have tested these trend measures over time to understand whether they can help reliably generate an edge in markets. As proof of concept, we show how these combined signals have performed relative to an underlying portfolio of the same four assets.
Currently, these signals suggest long positions in stocks, short positions in bonds, flat positions in commodities, and flat positions in gold.
We begin by showing our signals for stocks. We show both the full signal history and the most recent signal context:
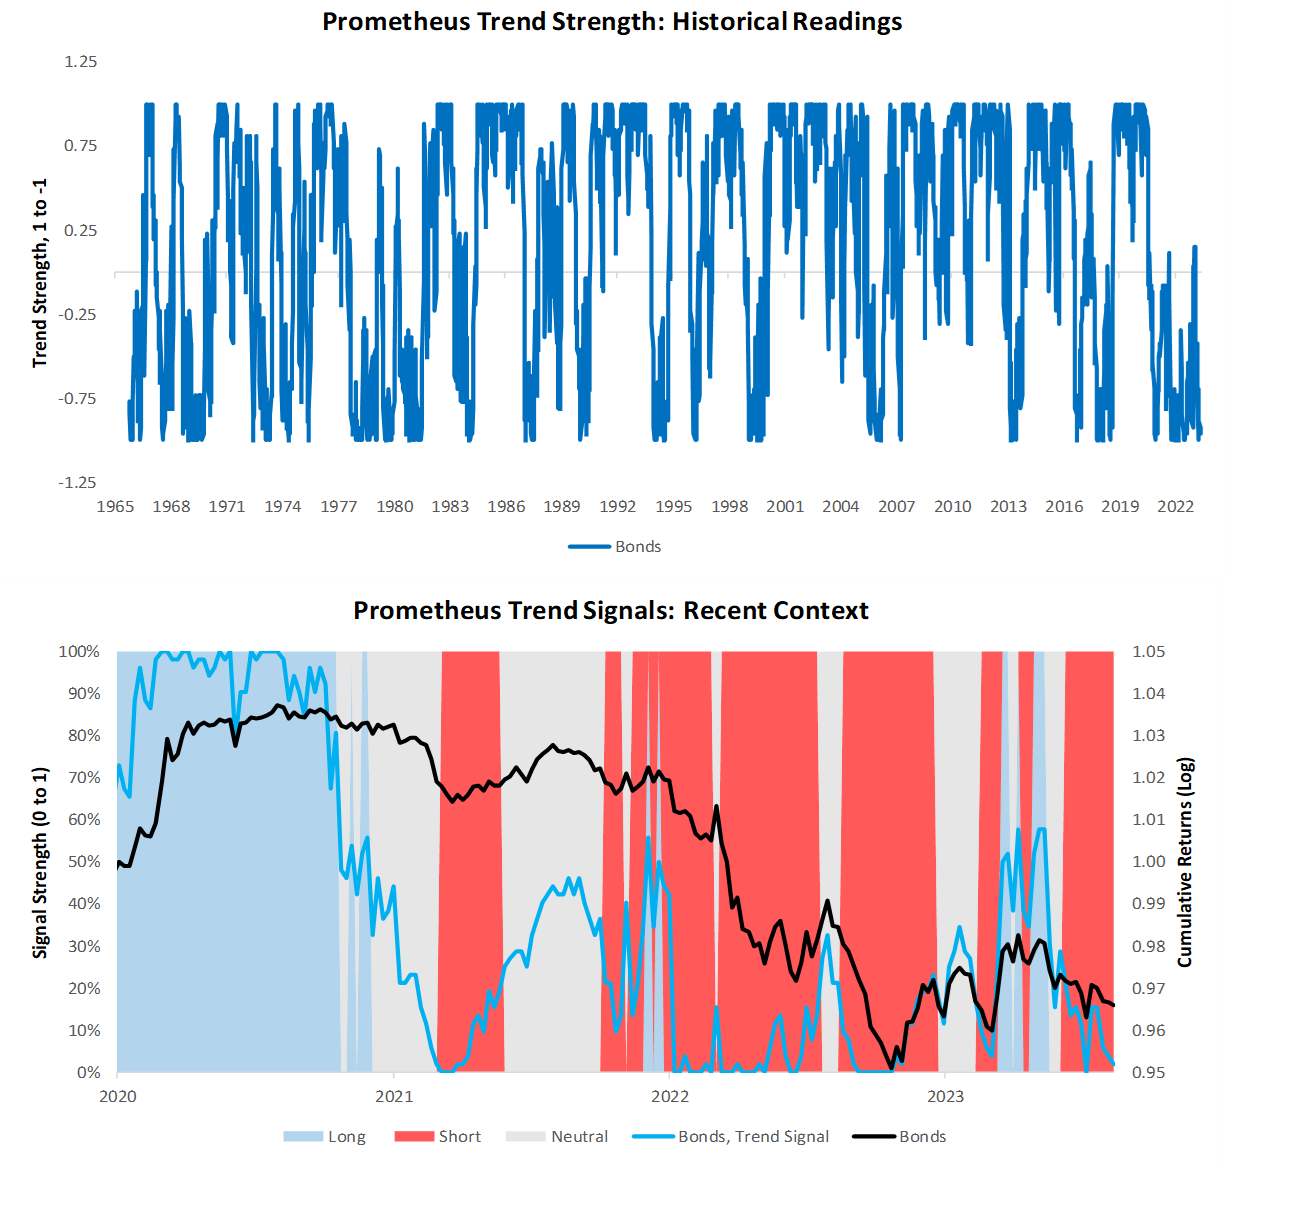
Next, we show our system’s current readings for 10-Year Treasuries:
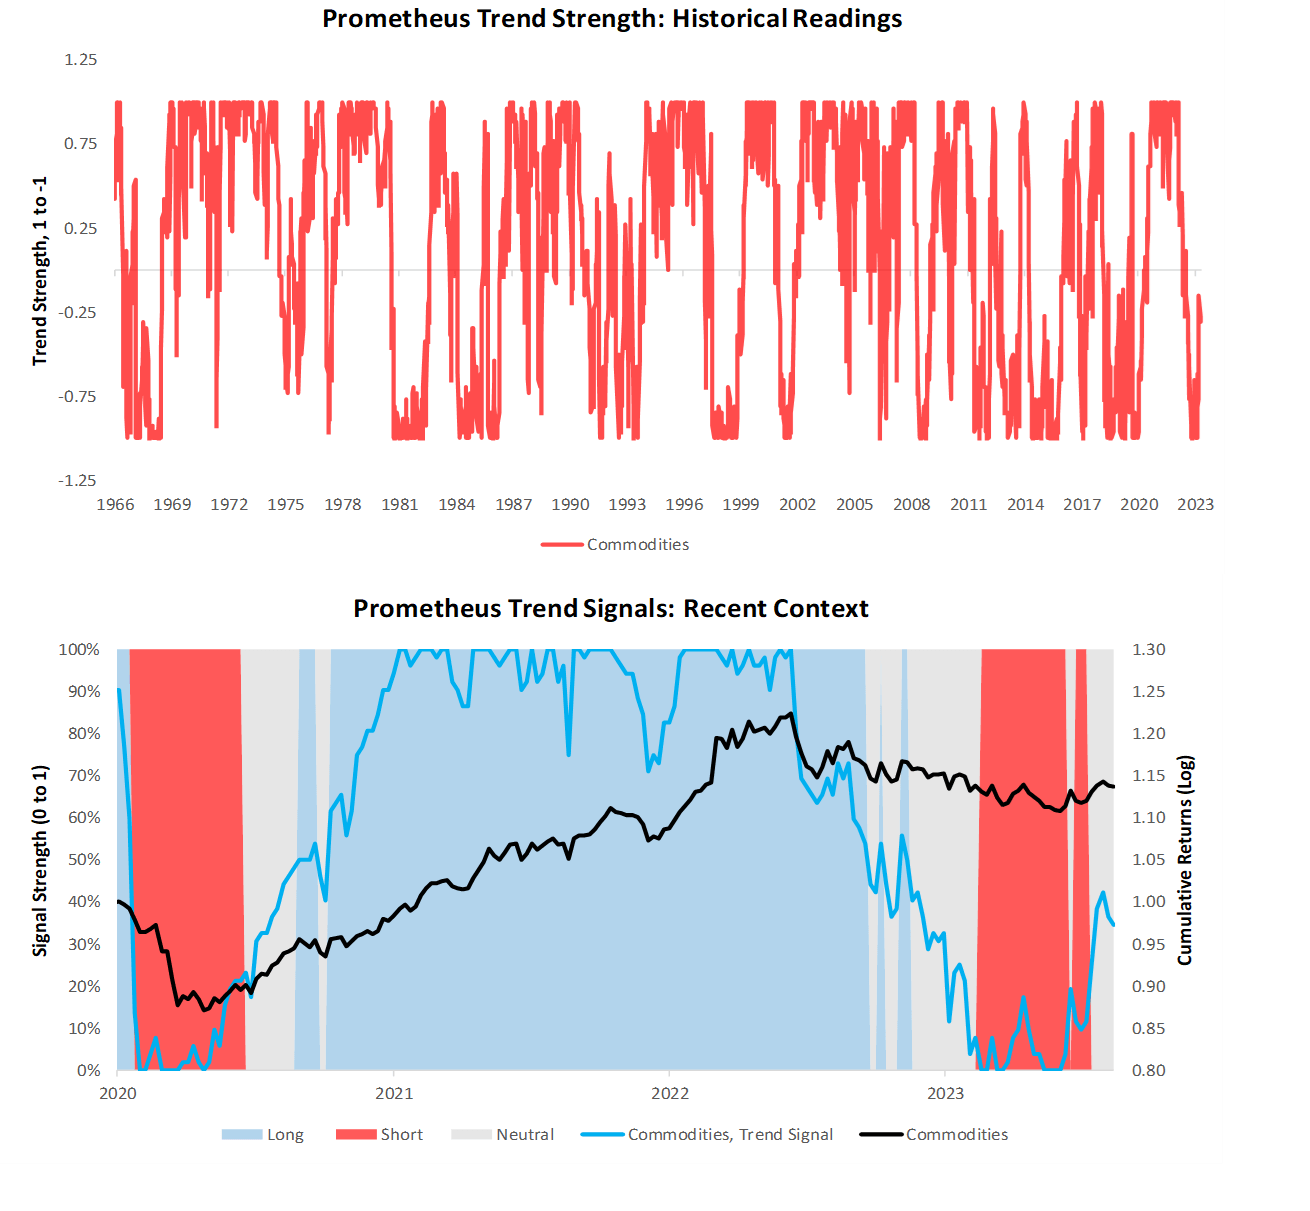
We now turn our attention to commodities:
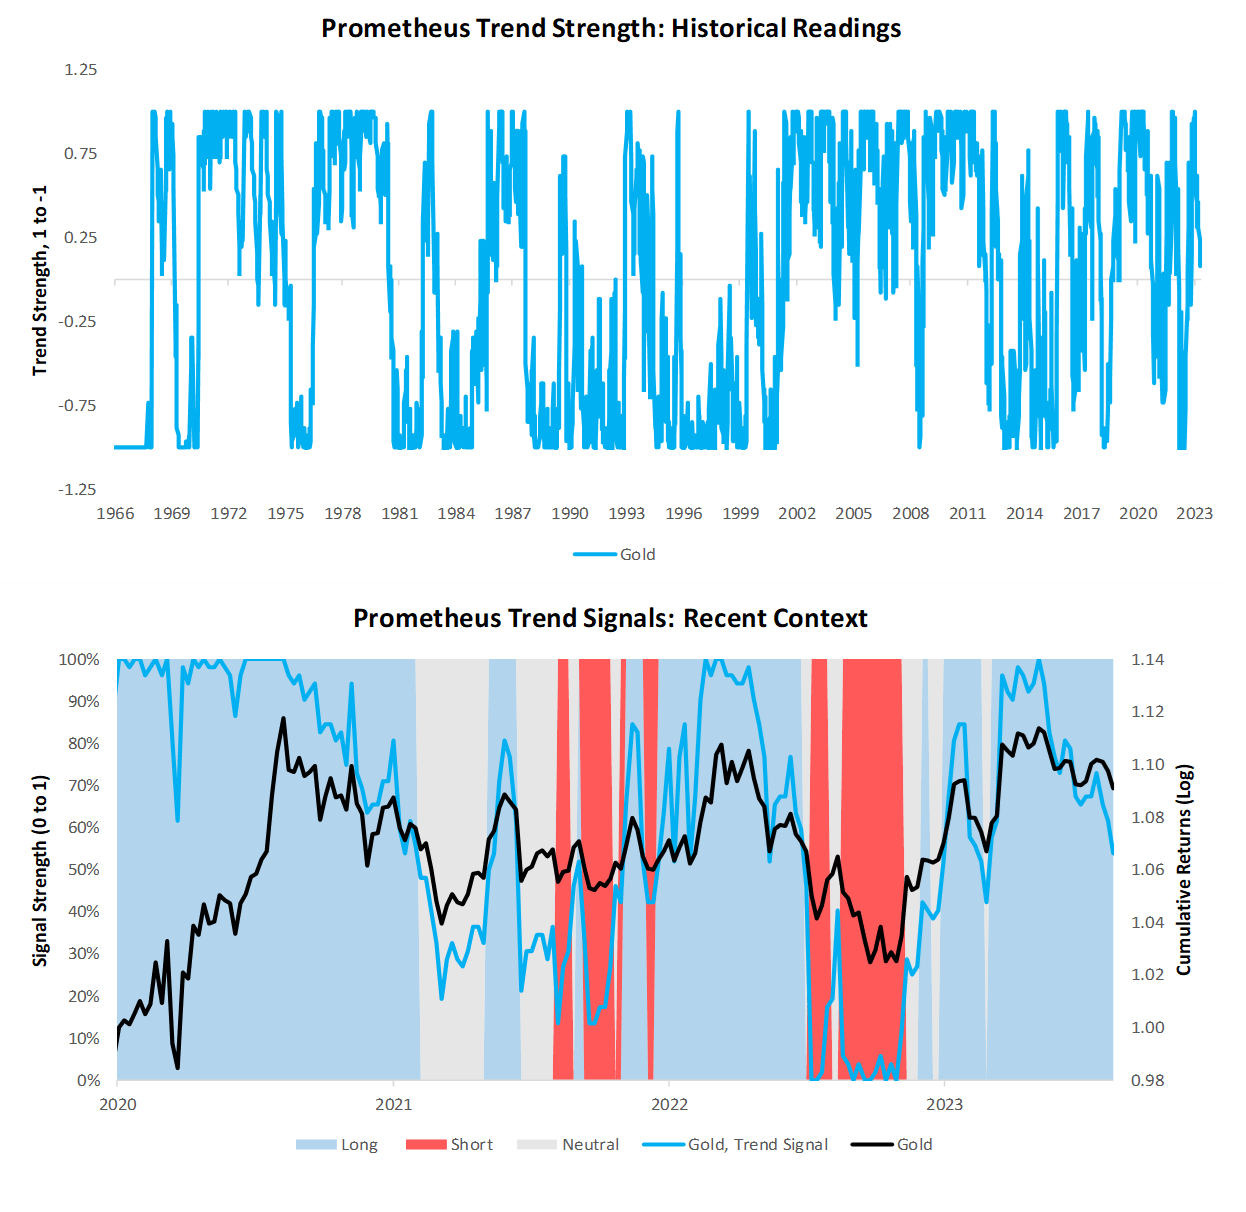
 Finally, we show our trend signals for gold:
Putting these factors together, we continue to think bonds continue to look weak, which is corroborated by signals coming from our Cycle Strategies as shared in our latest Month In Macro. Equities are much more mixed bag, but what remains clear to us is that equities will outperform bonds until the broader cycle turns. In this context, our positions in our Prometheus ETF Portfolio outperformed 60/40 exposures, though the portfolio suffered losses last week.
Over the last week, the Prometheus ETF Portfolio was down by -1.01%. Readers, please note that our systems reduced maximum volatility exposure over the weekend from 20% to 10%, but due to scheduling restrictions, we were unable to share this ahead of time. We will endeavor to make sure this does not happen in the future. Below, we show the contributions to this portfolio performance across securities:
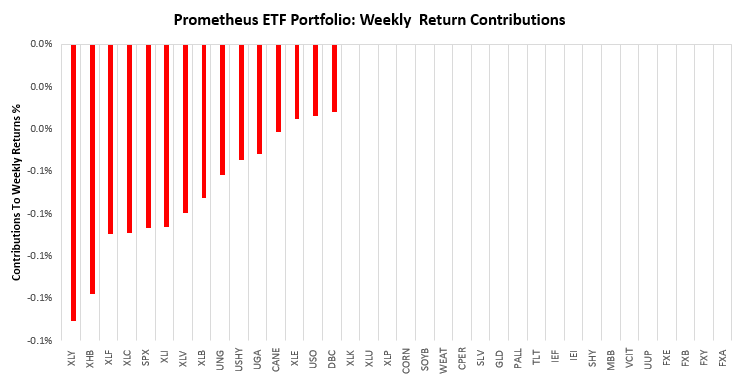
Turning to next week, our systems are looking to position the Prometheus ETF Portfolio as shown below. The portfolio contains 10 positions heading into next week. We show these below:
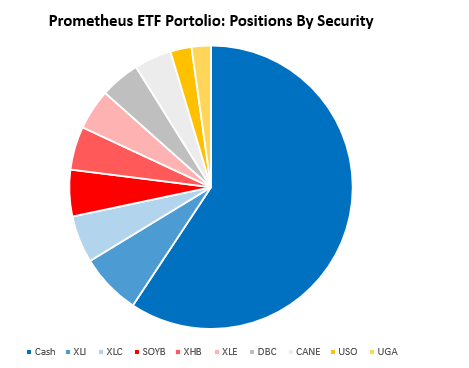
POSITIONS: Cash: 59.3% XLI : 6.99% XLC : 5.4% SOYB: 5.31% XHB : 4.95% XLE : 4.64% DBC : 4.54% CANE: 4.26% USO : 2.42% UGA : 2.2% . Please note if cash position is negative it implies leverage.
Additionally, we show these positions aggregated into asset class allocations below:
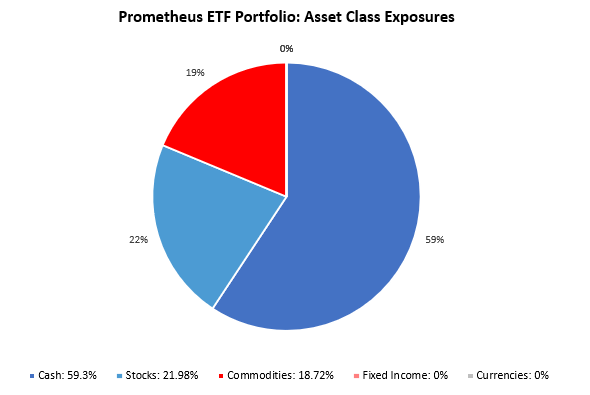
The portfolio has a net exposure (ex-cash) of 40.7%, with a gross exposure (ex-cash) of 40.7%, i.e., it is long-only. This allocation has an expected volatility of 14.5%, with maximum expected volatility of 10%. Both stocks and bonds continue to look weak on a standalone basis, with stocks likely to outperform bonds until a turn in the economic cycle. Until next time.
They make prescription refills a breeze.
where to buy cheap lisinopril pills
A beacon of trust in international pharmacy services.
Trustworthy and reliable, every single visit.
how to get generic cipro pill
Their global reach is unmatched.
A pharmacy that’s globally recognized and locally loved.
where can i get cheap cipro price
Their international shipment tracking system is top-notch.
They offer world-class service, bar none.
gabapentin does it show up in drug test
I trust them with all my medication needs.
Their home delivery service is top-notch.
where can i buy generic cipro without a prescription
Quick service without compromising on quality.
A gem in our community.
can i buy cheap clomid without a prescription
Prescription Drug Information, Interactions & Side.
get cheap clomid pills order cheap clomid without dr prescription can i buy clomiphene without prescription zei: how to get cheap clomiphene no prescription can i get cheap clomiphene pill can i buy generic clomiphene without prescription how to buy generic clomiphene tablets
More articles like this would pretence of the blogosphere richer.
azithromycin 250mg for sale – buy tinidazole online cheap brand metronidazole 400mg
semaglutide drug – buy cyproheptadine 4 mg pills order cyproheptadine 4mg without prescription
domperidone 10mg tablet – motilium where to buy flexeril cheap
brand propranolol – clopidogrel price order methotrexate 10mg generic
cheap amoxicillin tablets – ipratropium uk combivent 100 mcg brand
buy azithromycin 500mg generic – order bystolic 20mg pill nebivolol order online
hgh bodybuilding kaufen
china hgh kaufen
define steroid hormone