Welcome to The Observatory. The Observatory is how we at Prometheus monitor the evolution of the economy and financial markets in real-time. The insights provided here are slivers of our research process that are integrated algorithmically into our systems to create rules-based portfolios. Today, we evaluate the latest information from the construction sector to assess both economic conditions and understand the sustainability of market pricing. Our takeaways are as follows:
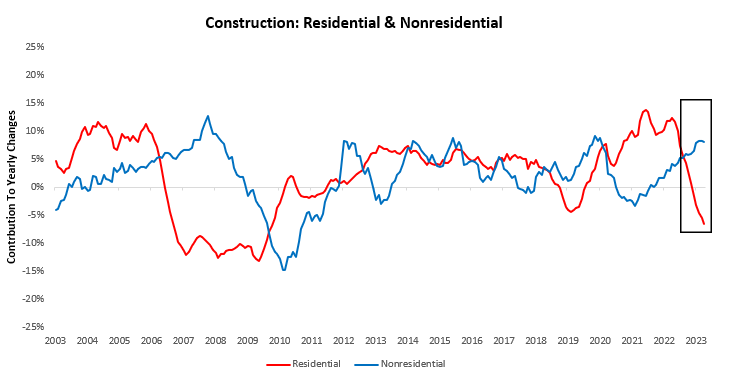
- Construction spending in May improved. Residential spending improved while nonresidential spending contracted, consistent with the trend in equity markets of homebuilders outperforming commercial developers.
- Residential spending remains weak relative to where it was last year, but nonresidential spending remains resilient. We find that all of the strength in nonresidential construction comes from large electronic companies investing to increase their output of electronics and semiconductors. This begs the question of how long these outsized moves can continue to support construction.
- While homebuilders have indeed outperformed commercial builders’ equities, only a small fraction has come from improvement in revenue expectations. The composition of these gains, along with the strength of the outperformance of homebuilders, begets questions about sustained outperformance.
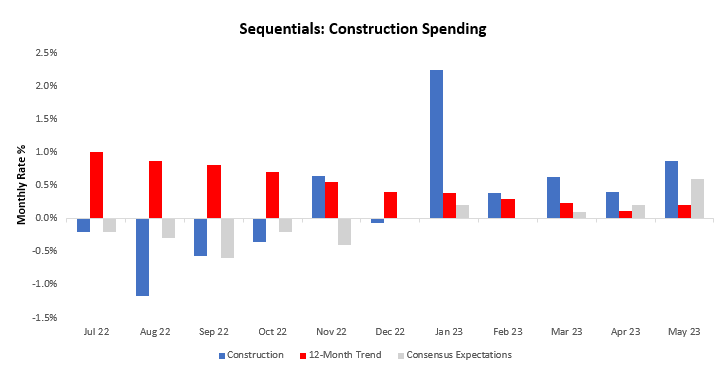
Let’s dive in. The most recent data for May show construction spending increased by 0.87%, with 0.95% and -0.08% coming from residential and nonresidential spending, respectively. This data surprised consensus expectations of 0.6% and contributed to an acceleration in the twelve-month trend.
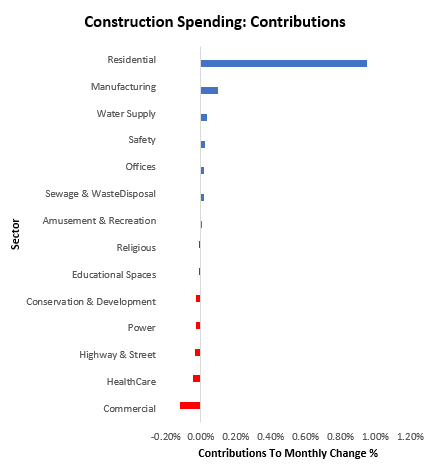
For further context, we show the composition of the most change in monthly construction spending. The strongest contributor to construction spending in May was Manufacturing, while the weakest was Religious construction spending:
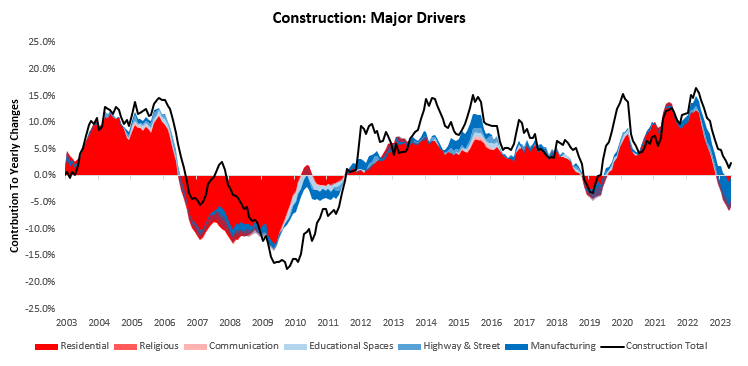
Zooming out, we show the evolution of construction spending over the last year, which rose by 2.37%%. This was driven by an -5.92% decrease in residential expenditure and an 8.29% rise in nonresidential spending.
Below, we drill down further to show the top 3 drivers of strength in blue (Manufacturing, Highway & Street, and Educational Spaces) and the top 3 drivers of weakness in red (Residential, Religious, and Communication):
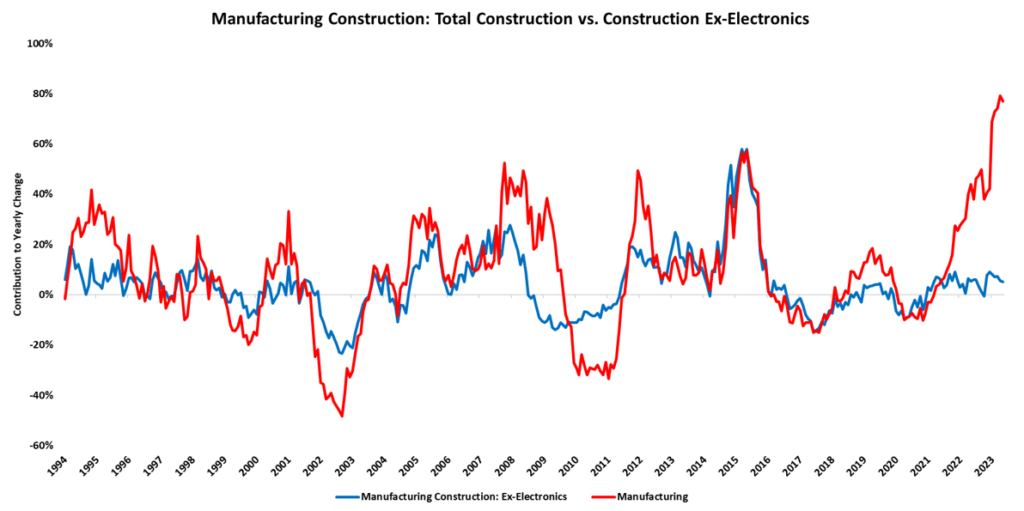
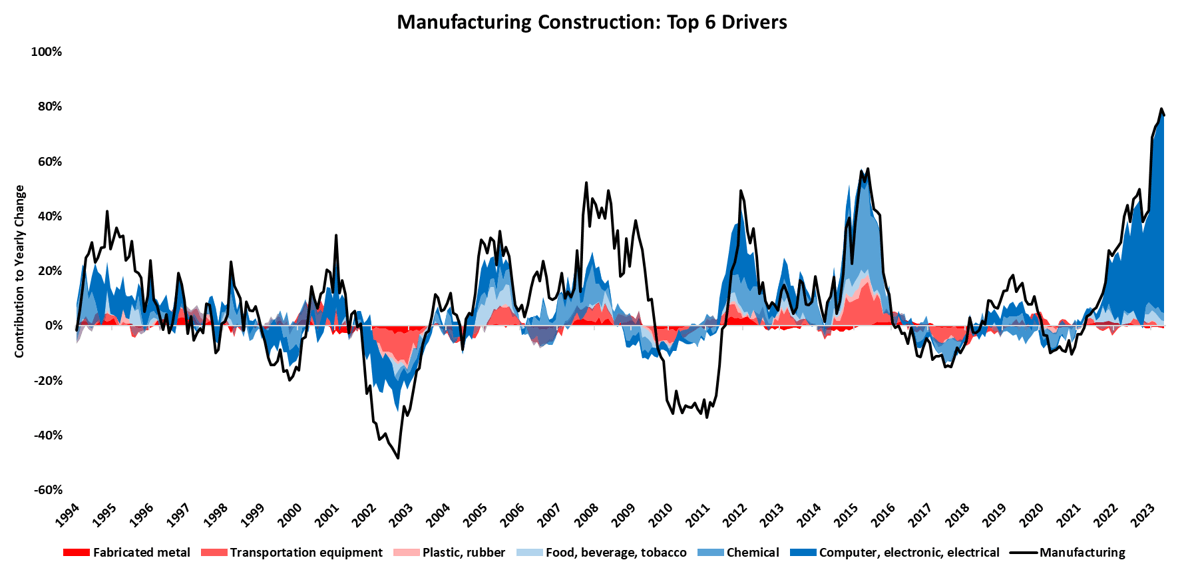
Within construction, manufacturing construction remains resilient, while residential spending remains weak (though marginally better). We drill down further to better understand what’s happening in manufacturing construction. Below, we show that almost all of the growth in manufacturing construction is coming from construction in electronics manufacturing facilities:
For further clarity, we show how manufacturing construction looks, excluding electronics manufacturing construction:

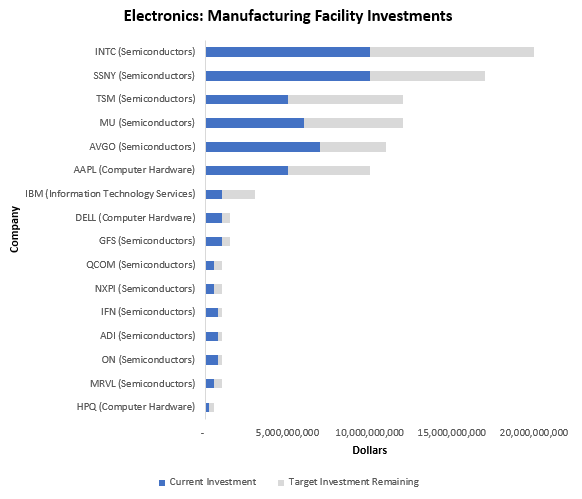
As we can see, without electronics, manufacturing construction is significantly weaker. In fact, this number would be well into contraction on a real basis. Nonetheless, aggregate manufacturing construction remains resilient due to this outsized contribution. By triangulation, we have been able to estimate the sources of this electronics spending: investment by large firms in electronic and semiconductor production facilities. We show the largest contributors to this trend below:
Unless the broader manufacturing environment improves dramatically, it seems unlikely that manufacturing construction can keep up this pace of construction growth powered by a single sector. This tailwind for manufacturing construction will likely turn into a headwind by early next year, weighing on nonresidential spending.
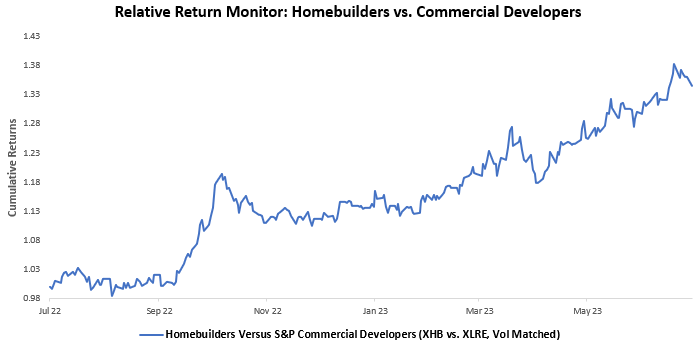
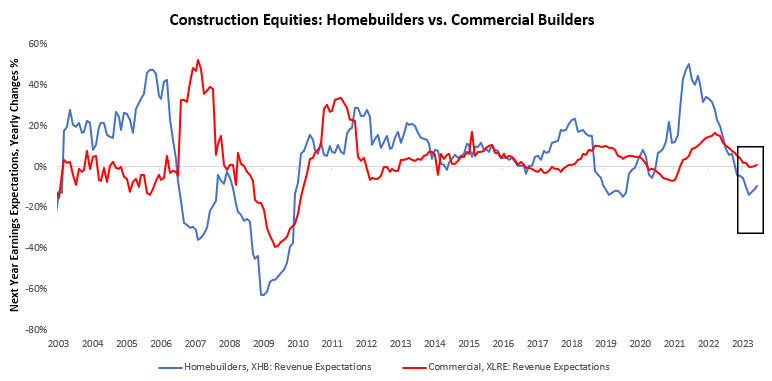
As shown previously, residential spending has declined over the last year, but non-residential spending remains more resilient. However, markets have looked past these declines to price an improvement in homebuilding equities relative to commercial builders’ equities. We show this below:
Part of this move has come from a bottoming of revenue expectations declines for homebuilders versus commercial developers. We show this below:
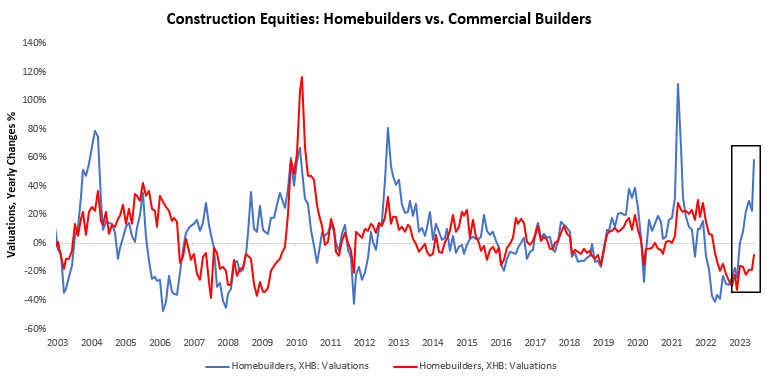
However, this change in revenue expectations has been meager relative to the change in valuations. We show this below:
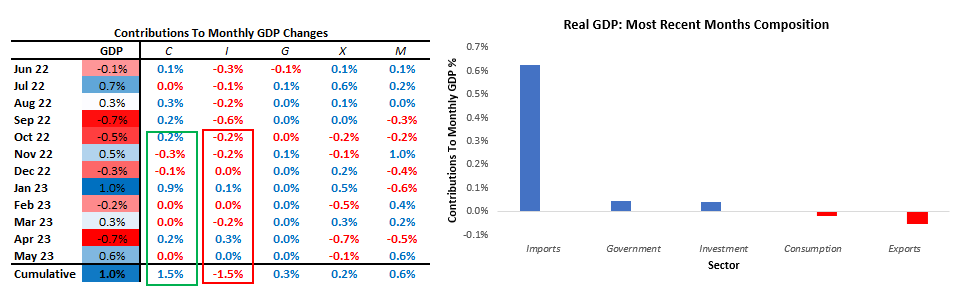
Overall, the picture is marginally positive for GDP; but not enough to make our estimate for real investment may come up materially. In May, GDP came in at 0.64% versus the prior month. Below, we show the weighted contributions to the most recent one-month change in real GDP, along with the recent history of month-on-month GDP. Additionally, we show the contribution by sector to monthly GDP in the table below:
Overall, cross-currents remain in the data. Residential construction spending continues to face headwinds from monetary tightening, while commercial spending remains supported by large electronic companies. These suggest conditions can continue to soften. Until next time.
Hi Prometheus,
I think your 3rd chart might be wrong… at least it does relate to the text (residential has the largest contribution in your chart not manufacturing)
David
I’m extremely impressed along with your writing talents and also with the layout for your
blog. Is that this a paid topic or did you modify it your self?
Either way stay up the nice high quality writing, it is rare to peer a nice weblog like
this one today. TikTok Algorithm!
pre steroid bodybuilders