Welcome to Prometheus Asset Allocation. The Prometheus Asset Allocation program offers a stable, macro-focused approach to asset management. Prometheus Asset Allocation aims to outperform a traditional stock and bond portfolio by leveraging our proprietary systematic macro process to rotate between 3 ETFs monthly (plus cash). As part of the program, we will be sharing our views on Growth, Inflation, and Liquidity in addition to our monthly video updates.
Our primary takeaways are as follows:
- For the latest data through August, our systems place Real GDP growth at 2.07% versus one year prior, driven primarily by a sequential acceleration in Private Investment and Consumption expenditure.
- This acceleration in consumption continues to find its way to GDP & Corporate Profits, supporting the ongoing expansion. Nonetheless, broader measures of the labor market and cyclically sensitive spending, particularly manufacturing goods, motor vehicle production, and residential investment remain weak relative to the broader economy. Signs of slowing have increased.
- Overall, business cycle conditions suggest regime stability of a Slowing But Growing US economy. In the context of markets, our Asset Allocation strategy remains long equities and bonds with a healthy cash position.
Today we share our Growth Views. Below, we show our proprietary Prometheus Growth Index which offers us a real-time insight into the pressures on future growth conditions. This measure has sequentially deteriorated, suggesting stabilization within a slowing economy:
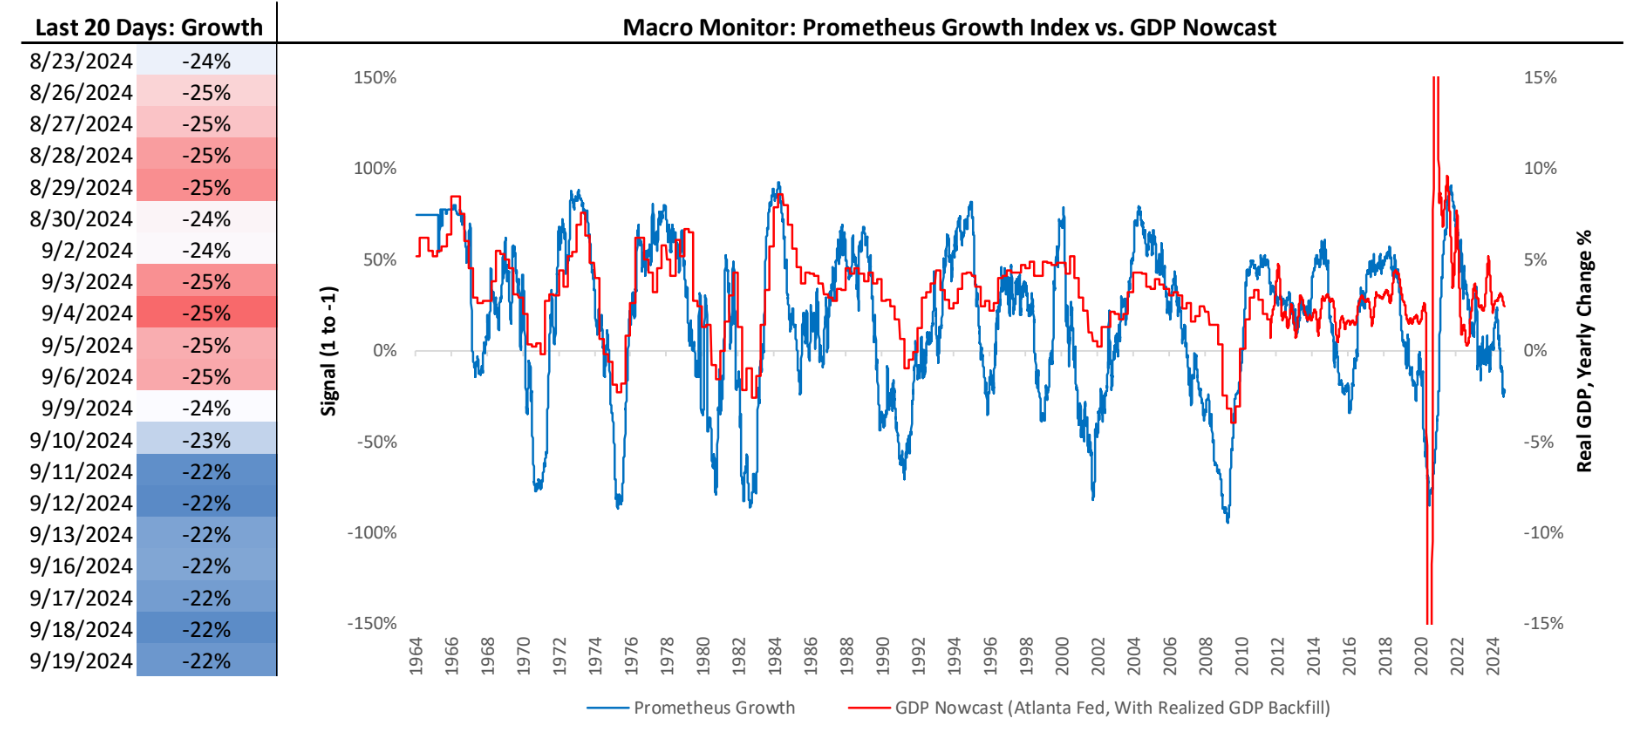
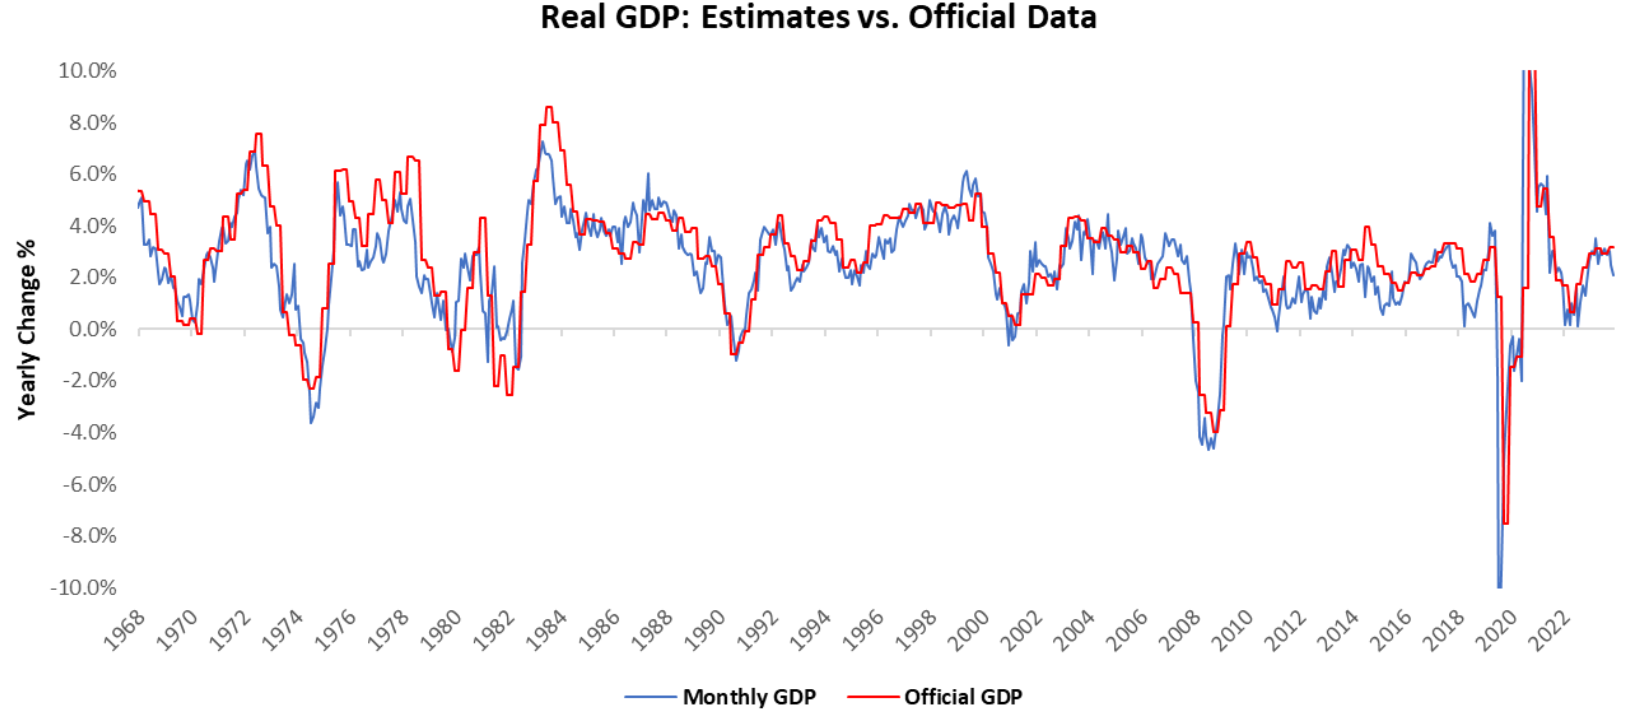
However, for the latest data through August, our systems place Real GDP growth at 2.07% versus one year prior. As noted earlier, the primary driver of the degree of this strength has been elevated inventory estimates, which are reflected in private investment. Therefore, while in the immediate term, this continues to be additive to nominal growth conditions; given the volatility of this sub-component, these headline dynamics are likely to be unsustainable. Below, we show our monthly estimates of Real GDP relative to the official data:
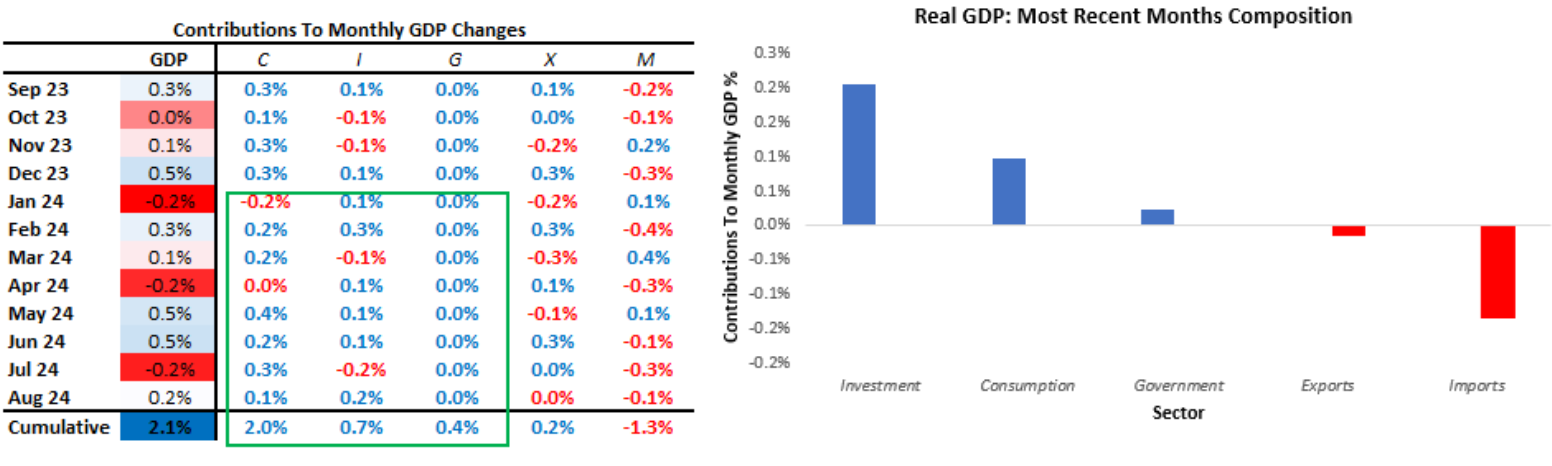
In August, GDP came in at 0.17% versus the prior month. Below, we show the weighted contributions to the most recent one-month change in real GDP and the recent history of month-on-month GDP. Additionally, we show the contribution by sector to monthly GDP in the table below:
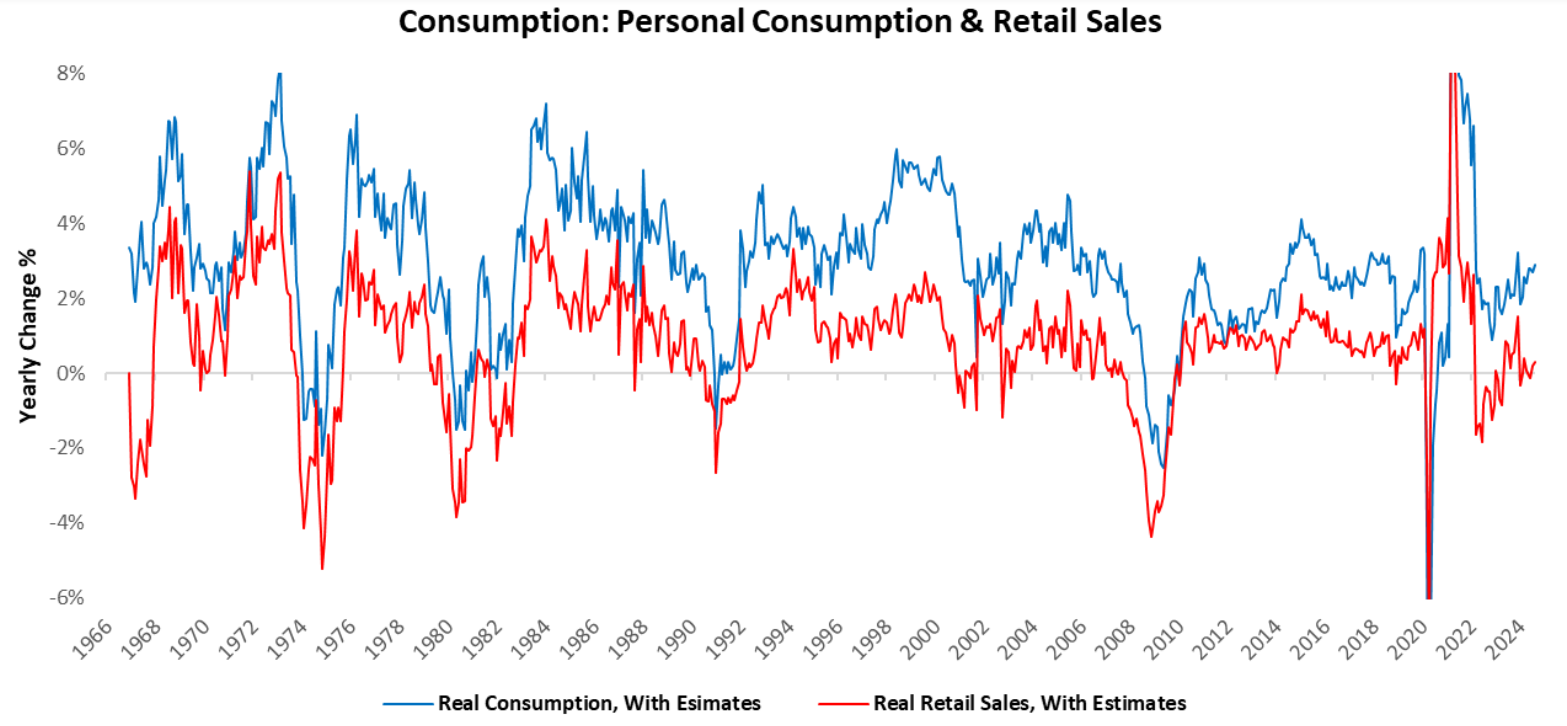
In August, real consumption spending increased by 0.1%. Over the last year, consumption has added 2% to GDP growth of 2.07%.
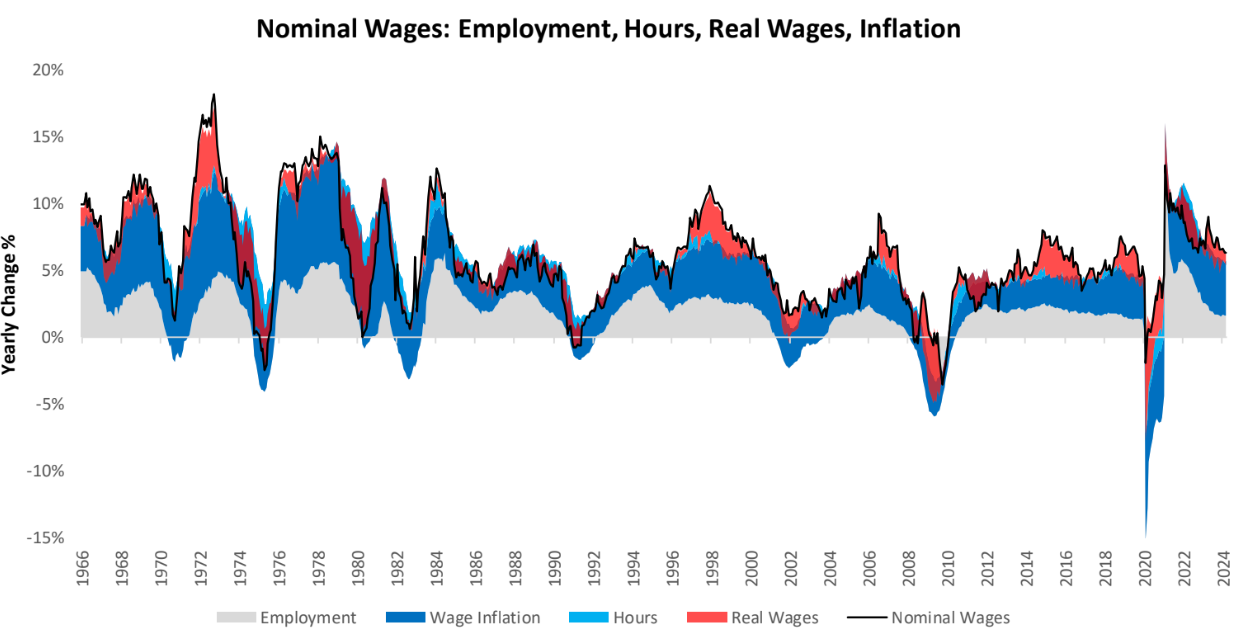
This consumer spending continues to drive wages, which remain very strong in both real and nominal terms. Nominal wages are a function of employment growth, hours worked, real wages, and wage inflation. Currently, nominal income growth remains robust, though employment growth has begun to deteriorate.
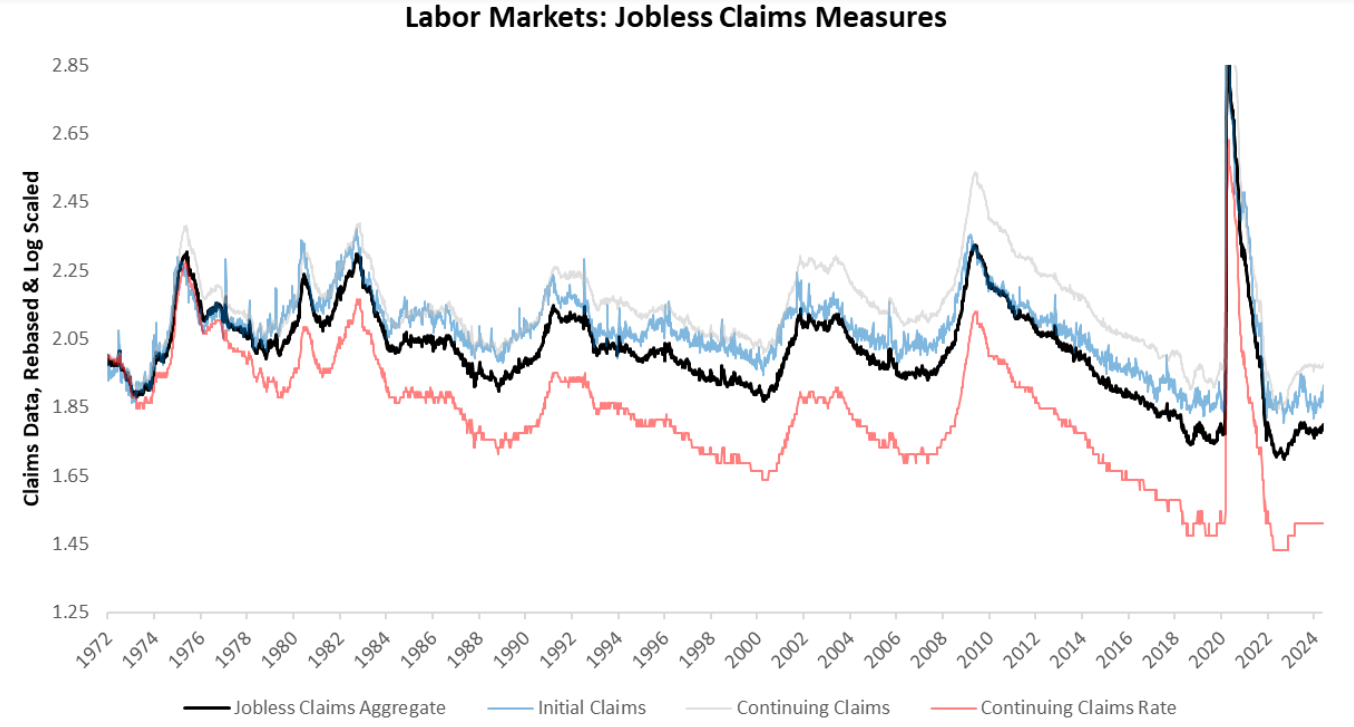
These elevated spending and income dynamics continue to keep the labor market extremely tight from a secular perspective. As per the latest data, initial & continuing jobless claims both disappointed expectations coming at 219 & 1829, versus the expected 230 & 1850, respectively. Below, we show the history of these measures, along with the Continuing Claims Rate, after adjusting these measures to provide an apples-to-apples comparison. Additionally, we combine these measures into a Jobless Claims Aggregate to capture the broad trend in the data:
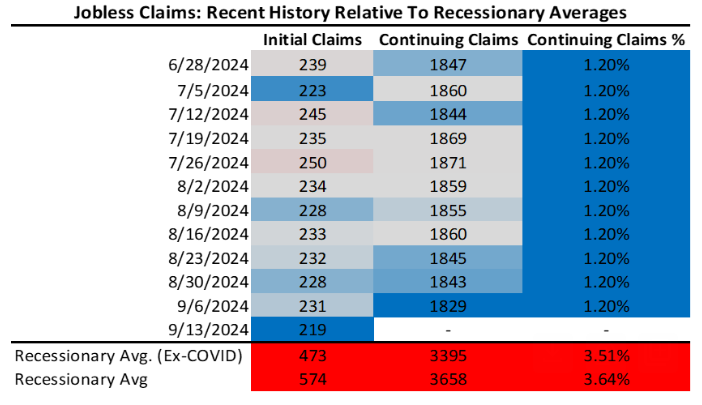
Additionally, we show the recent evolution of jobless claims data, over the last twelve weeks. Our tracking of Jobless Claims currently tells us that we are a way off from recessionary territory.
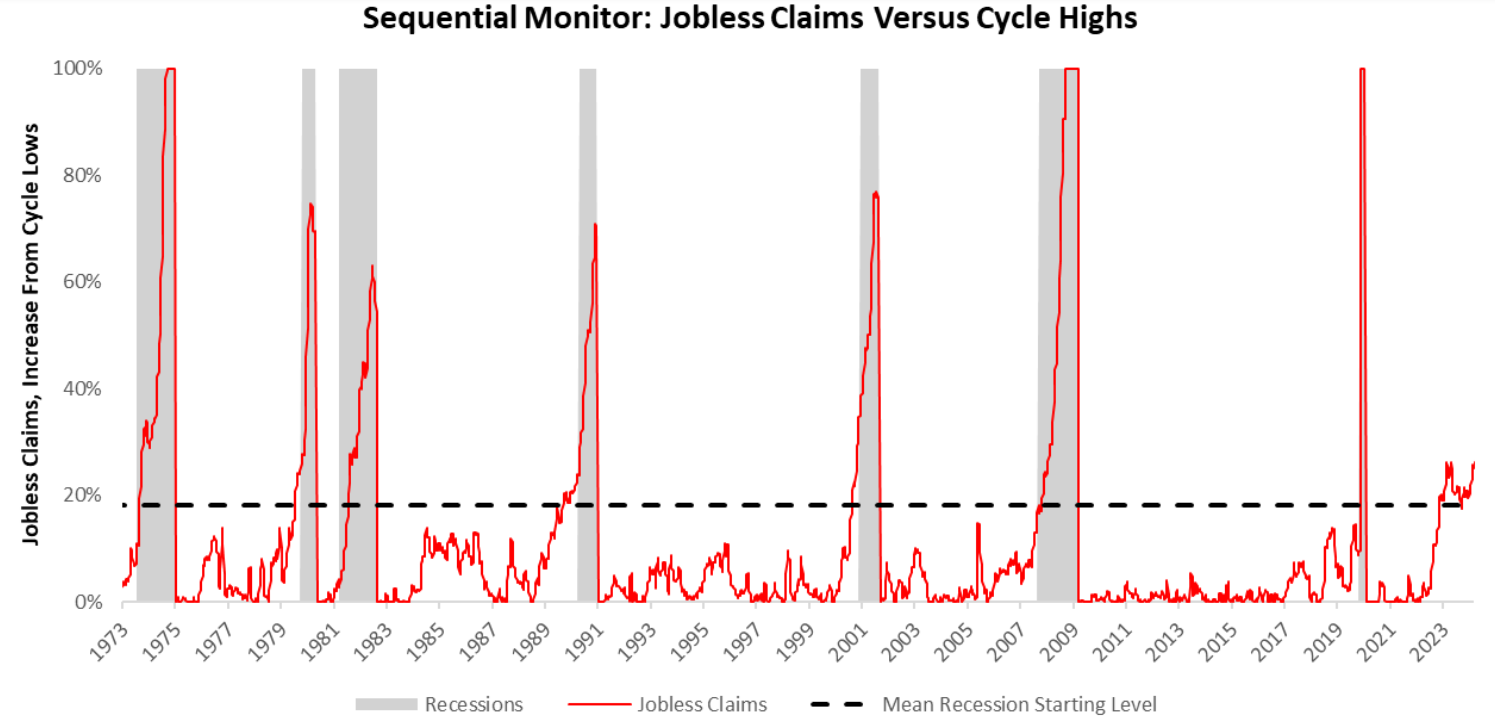
Nonetheless, there are some signs of slowing emerging. Initial claims have declined from highs, and are deteriorating in a broad-based way. Below we show jobless claims data from a more sequential perspective to understand where we are in the labor market cycle relative to the most recent cycle peak. As of our latest reading, our labor market measure shows Jobless Claims are 24%. Recessions typically begin around a reading of 18%, suggesting we are within the ballpark of recessionary territory.
Next, we analyze real gross investment. In August, real gross investment increased by 0.2%. Over the last year, investment has added 0.66% to GDP growth of 2.07%.
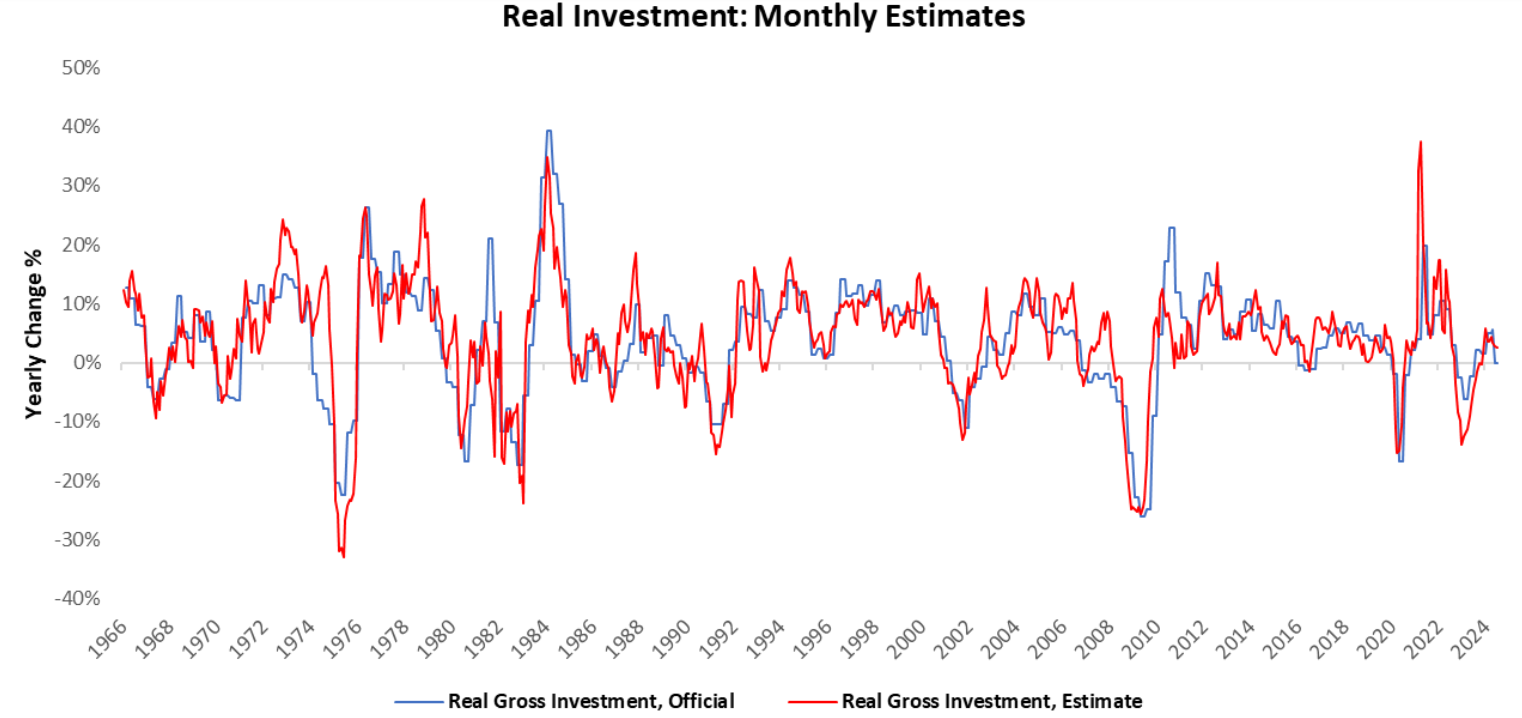
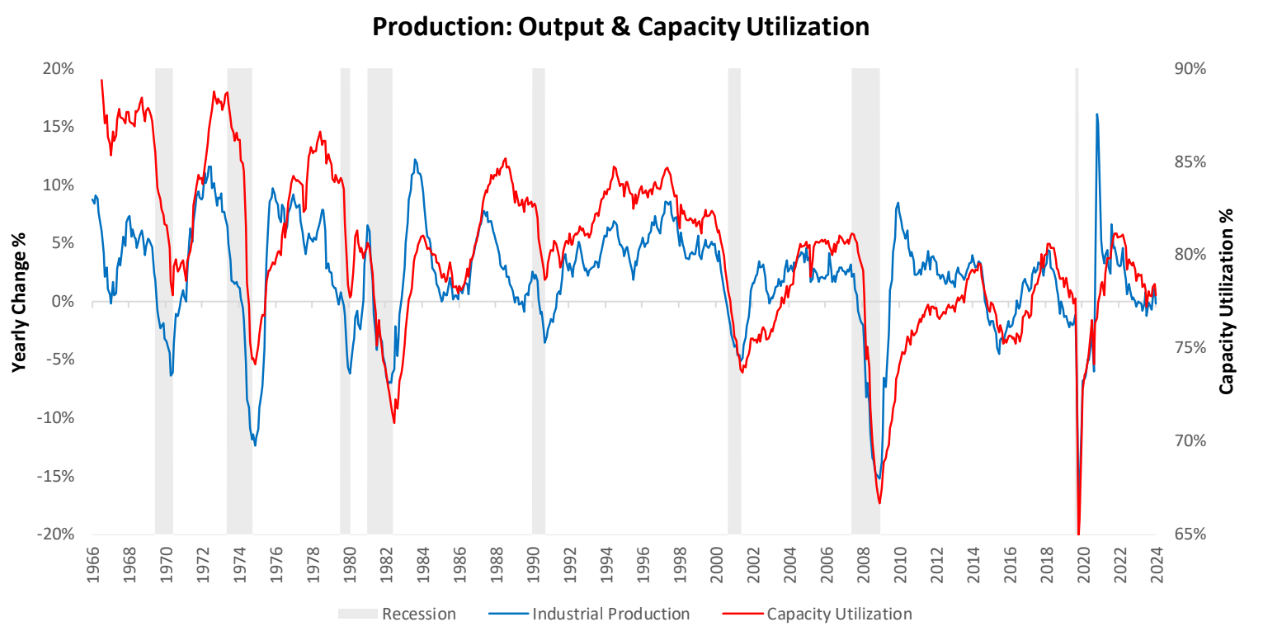
Now while the real gross investment data has increased sequentially, we continue to see persistent business cycle pressures. Industrial production and the use of industrial capacity are strong barometers of the state of manufacturing conditions in the economy. We visualize both industrial production & capacity utilization growth to understand the pace of manufacturing growth. Additionally, our analysis suggests that approximately 50% of the industries are in contraction and are seeing declining capacity use:
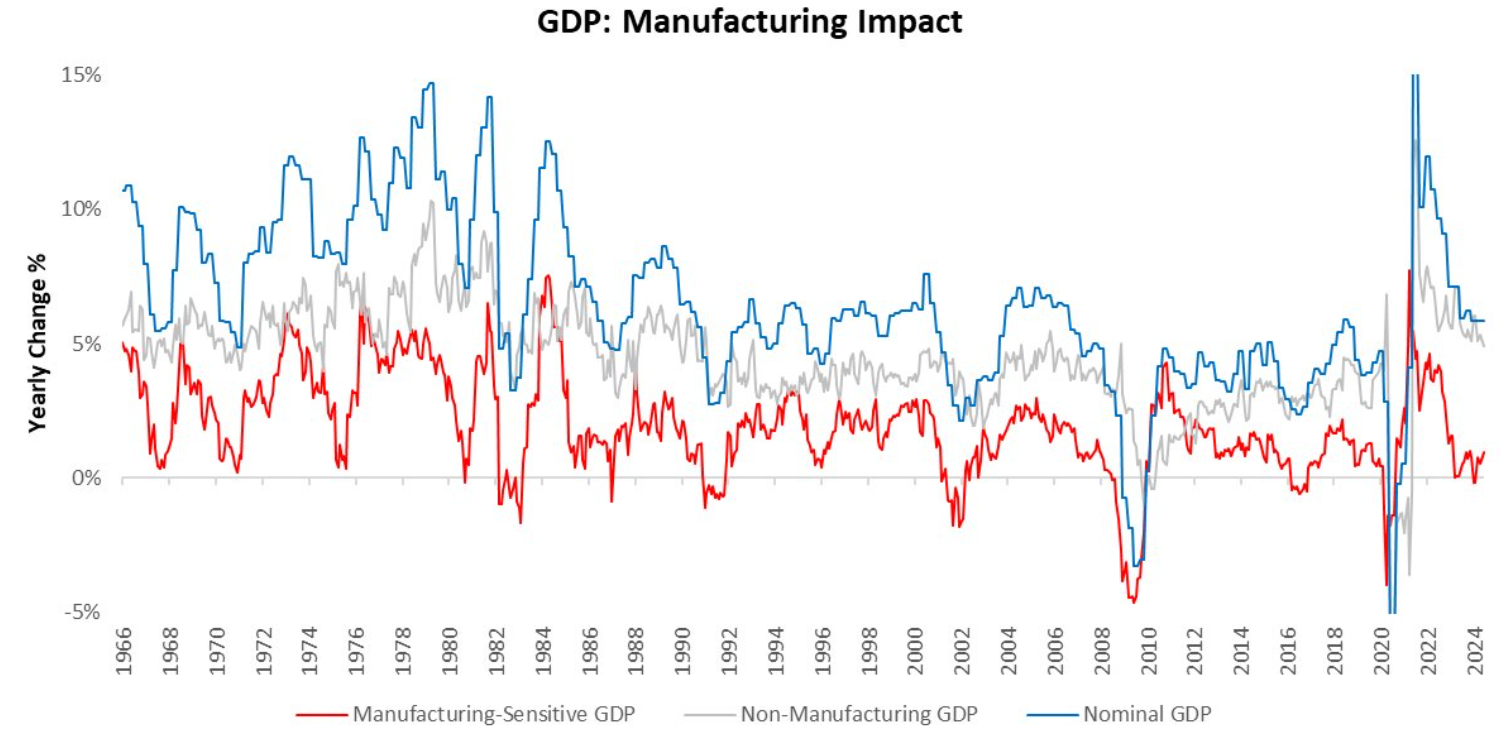
However, while industrial output has indeed weakened, secular shifts in manufacturing continue to limit the negative impact on nominal growth conditions. As we can see below, the contribution of Manufacturing sectors to GDP has significantly declined over time, and this remains particularly true in the current cycle:
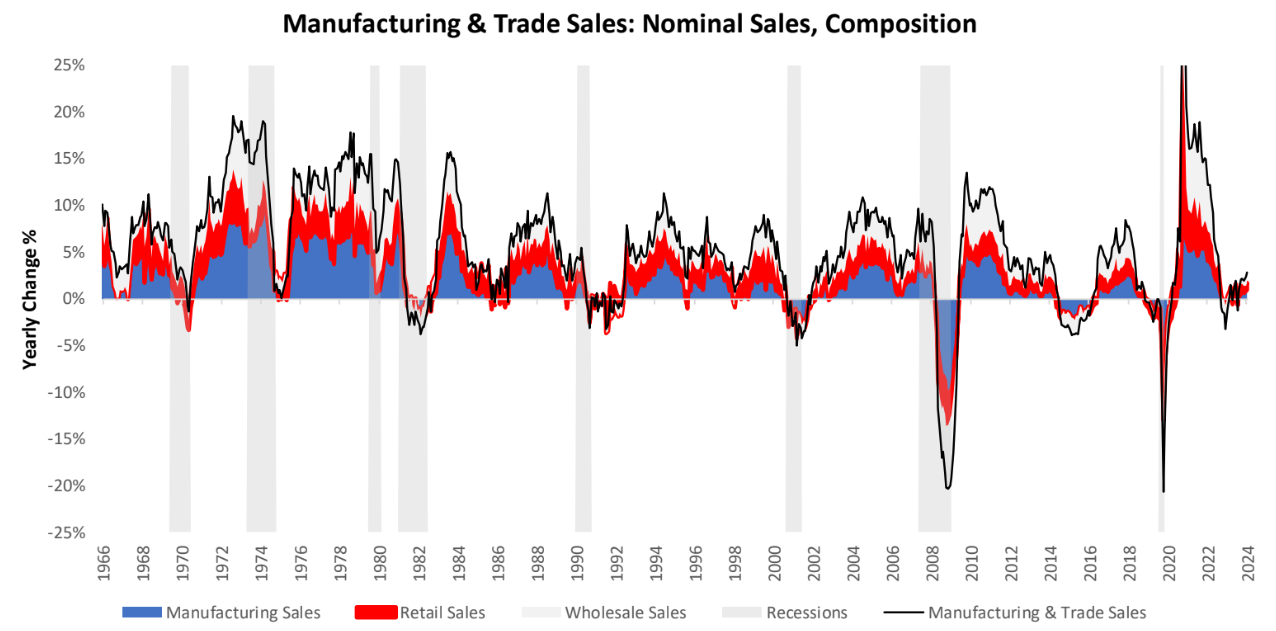
Furthermore, while manufacturers are indeed having a tough time, businesses further up the supply chain have seen some recent accelerations in sales. This is evidenced by the recent trend in trade sales that are up modestly now after a weak period:
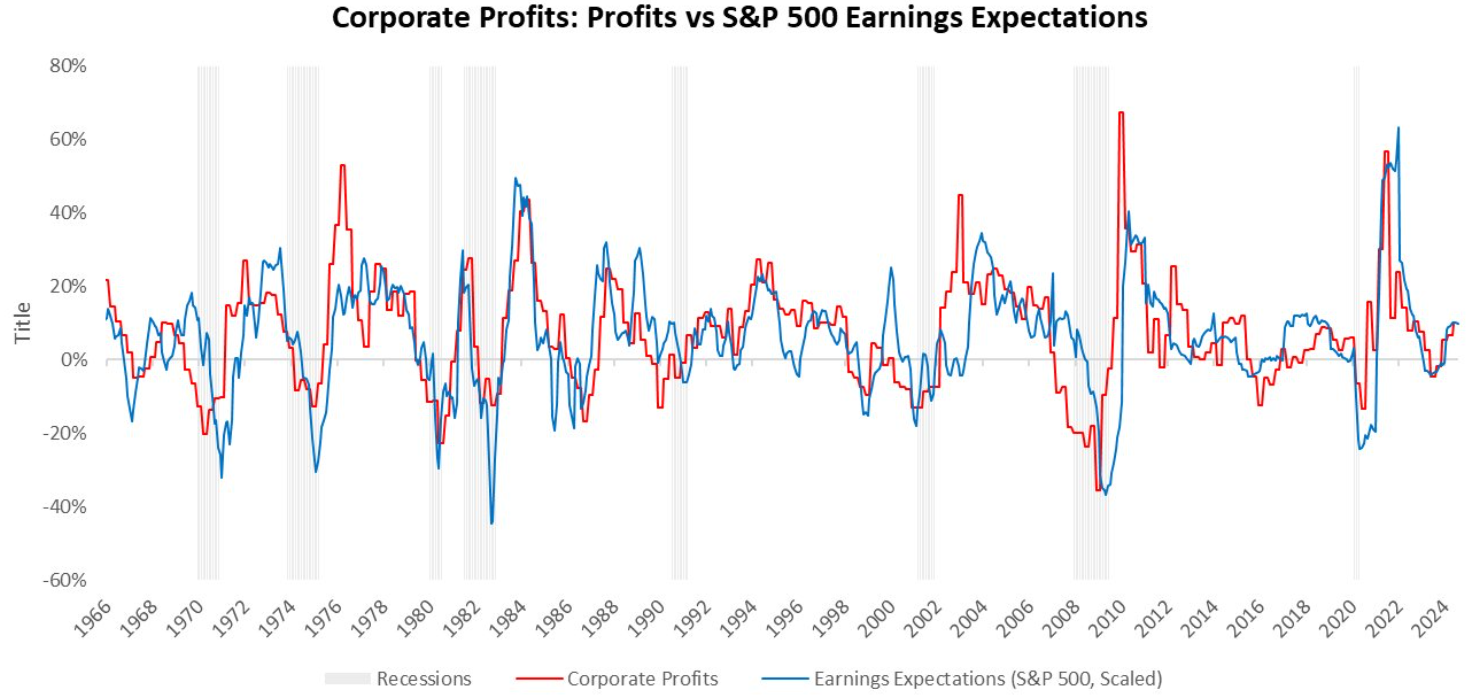
Therefore, modestly better sales, strong consumer incomes, and a tight labor market have continued to support corporate profits despite weakening industrial output and moderating business investment. This continues to be a support for growth. Below, we show the corporate profits data:
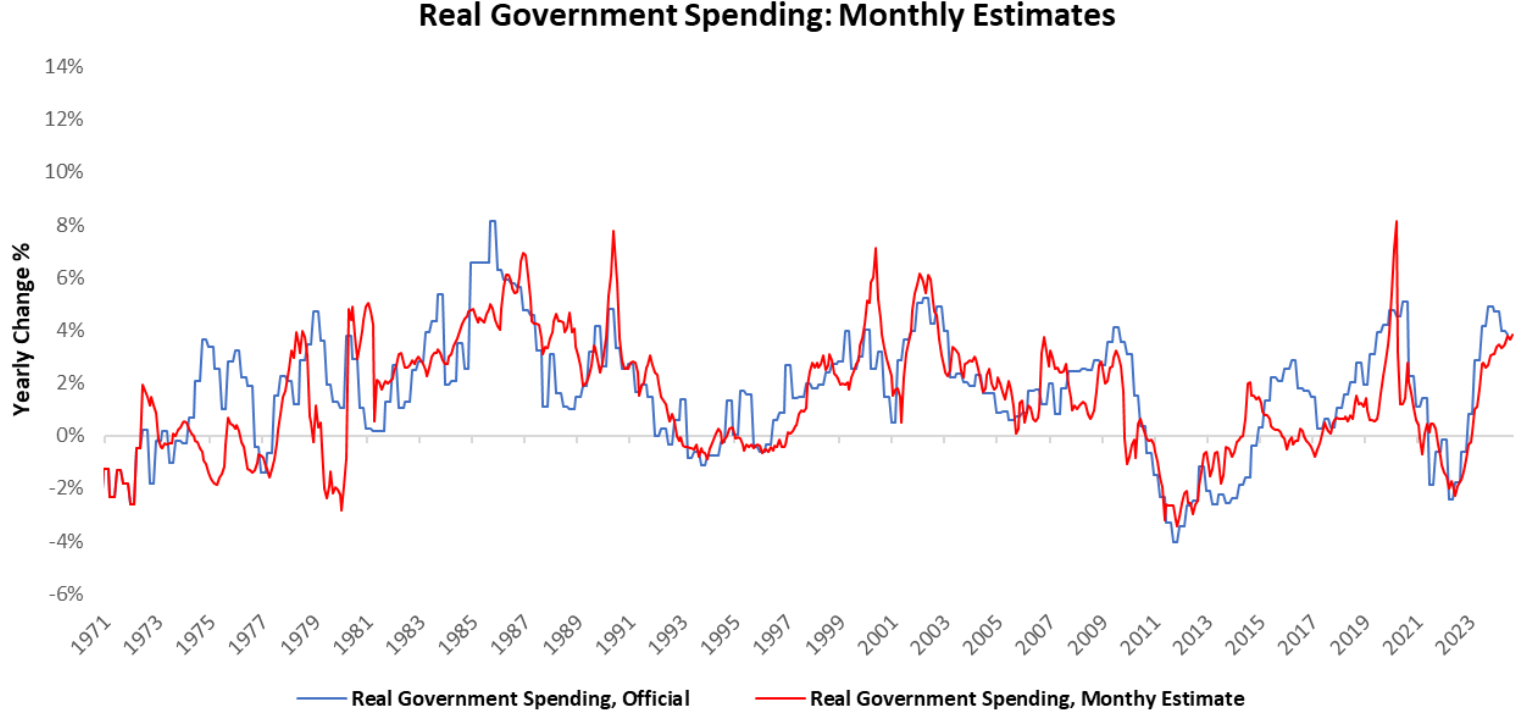
Next, we provide commentary on the remaining components that contribute to GDP. In August, real government expenditures increased by 0.02%. Over the last year, government spending has added 0.4% to GDP growth of 2.07%.
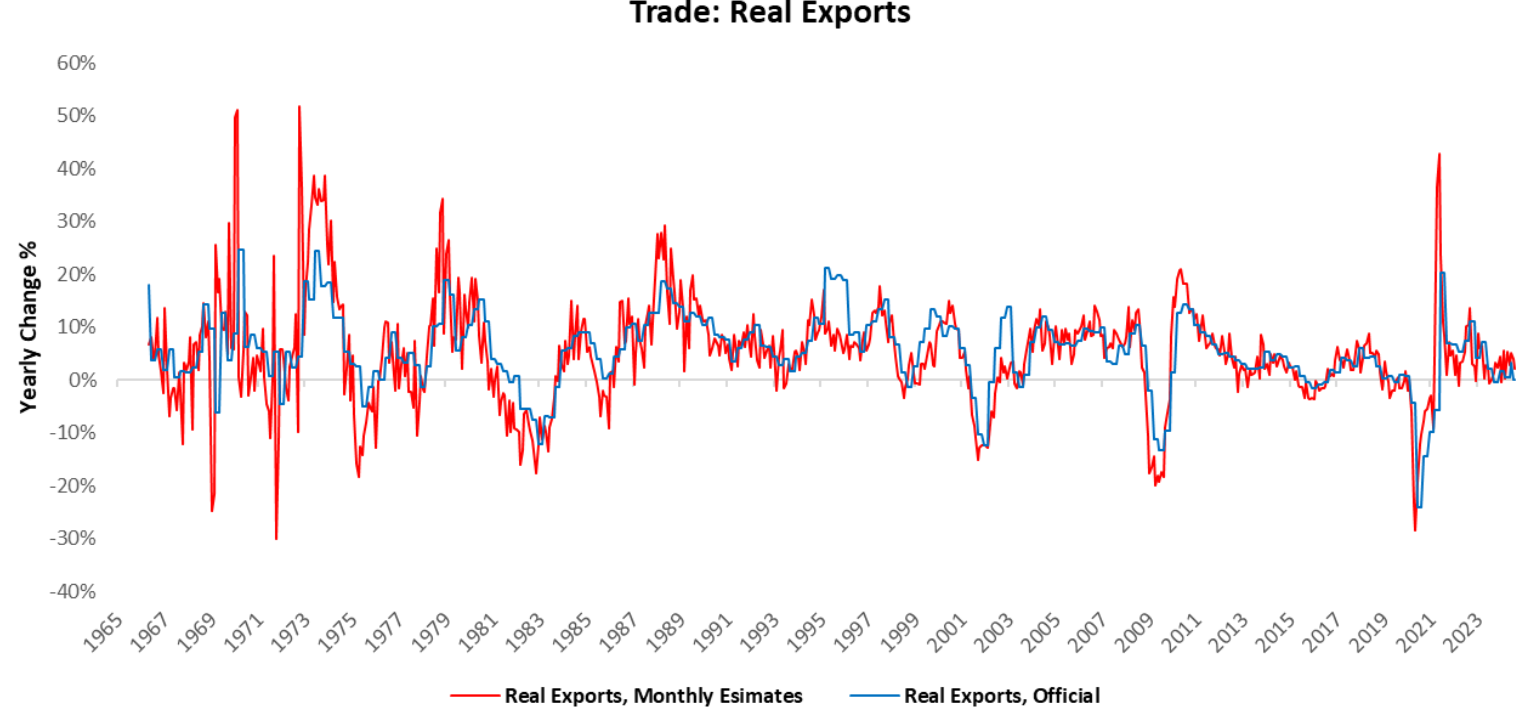
Real export revenues decreased by -0.02%. Over the last year, exports have added 0.25% to GDP growth of 2.07%.
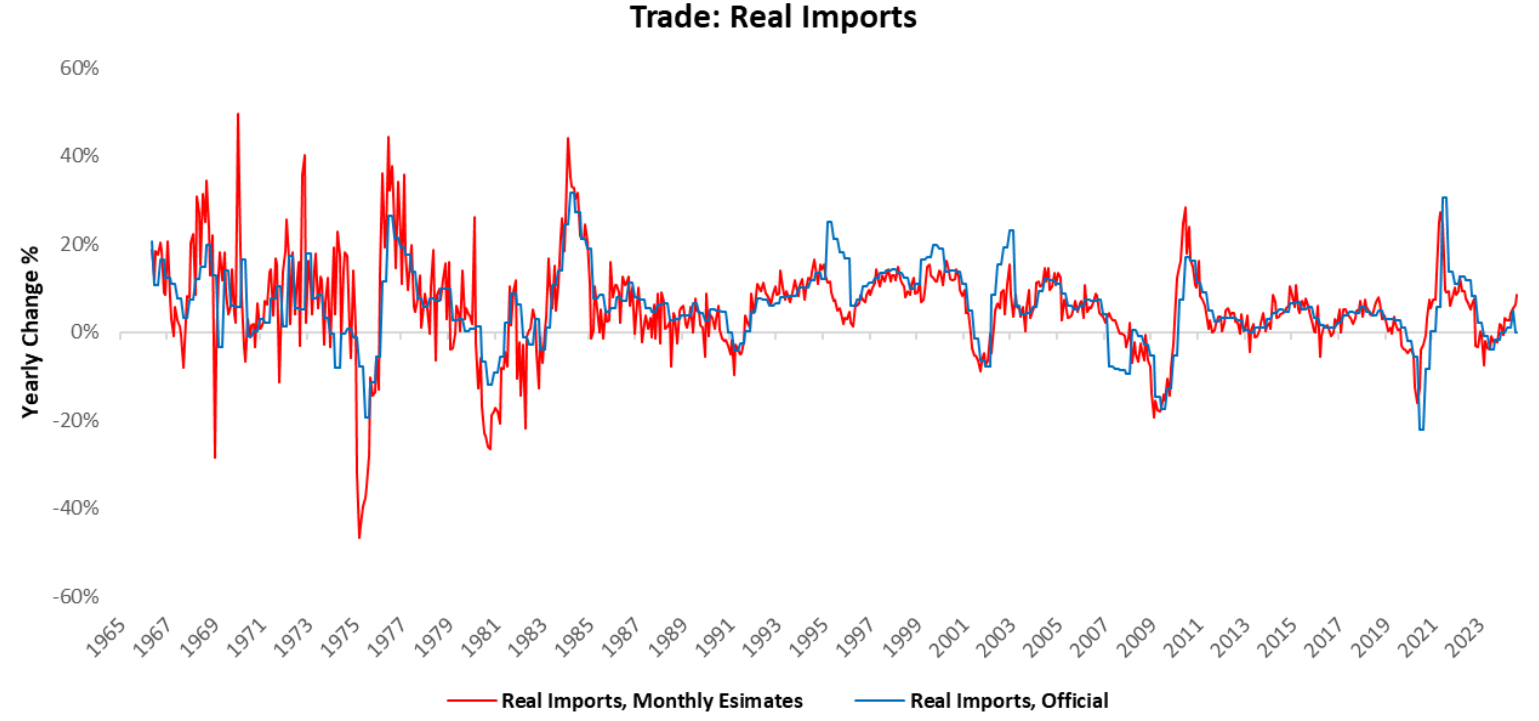
Lastly, import expenditures decreased by -0.14%. Over the last year, imports have subtracted -1.27% from GDP growth of 2.07%.
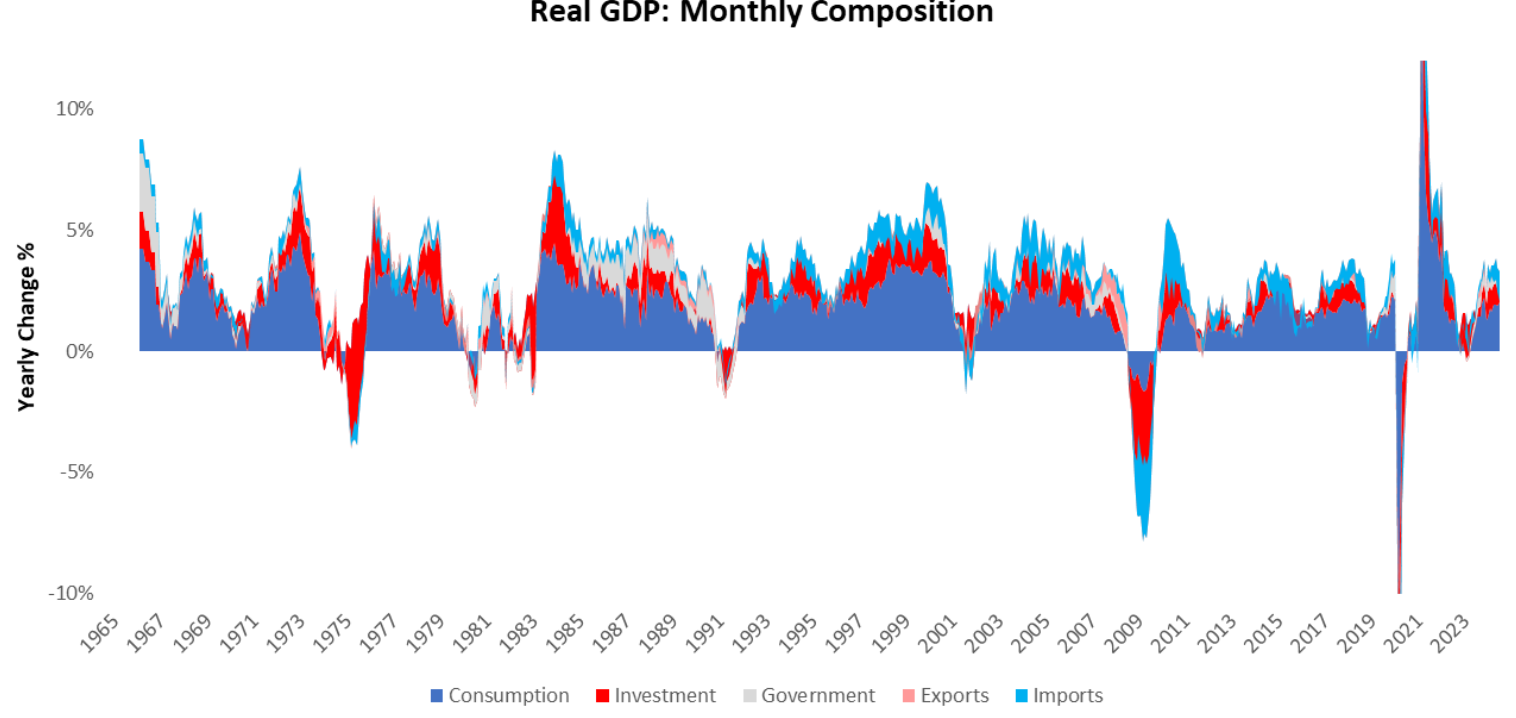
Subsequently, we show the cumulative contributions of various sectors to the total topline yearly real GDP growth. As we can see below consumption continues to be the primary driver of this growth cycle:
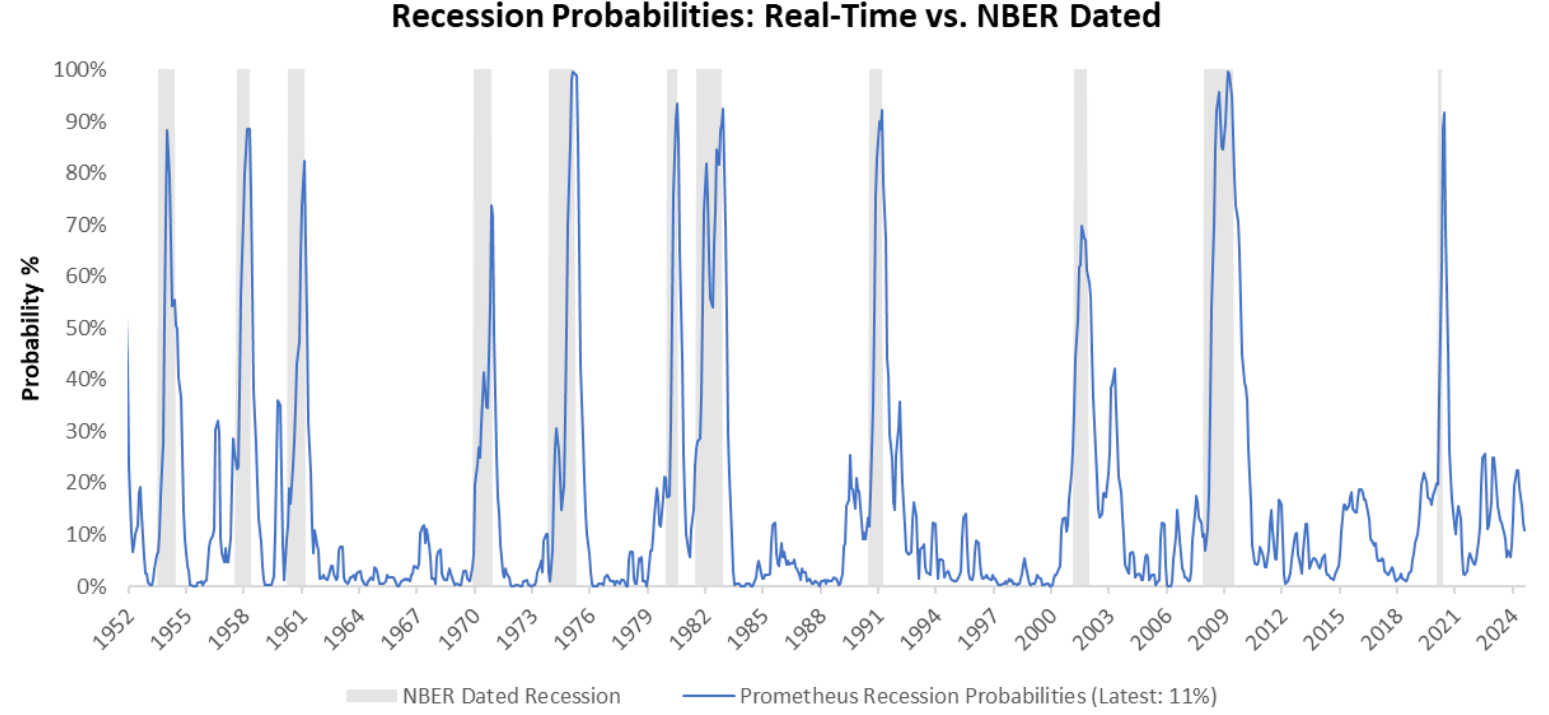
For further insight into whether GDP conditions are consistent with recessionary pressures, we aggregate macroeconomic indicators, consistent with the NBER methodology of recession classification, into a recession probability monitor. This gauge gives us a real-time understanding of developing recessionary pressures. Currently, recession probabilities are at 11%:
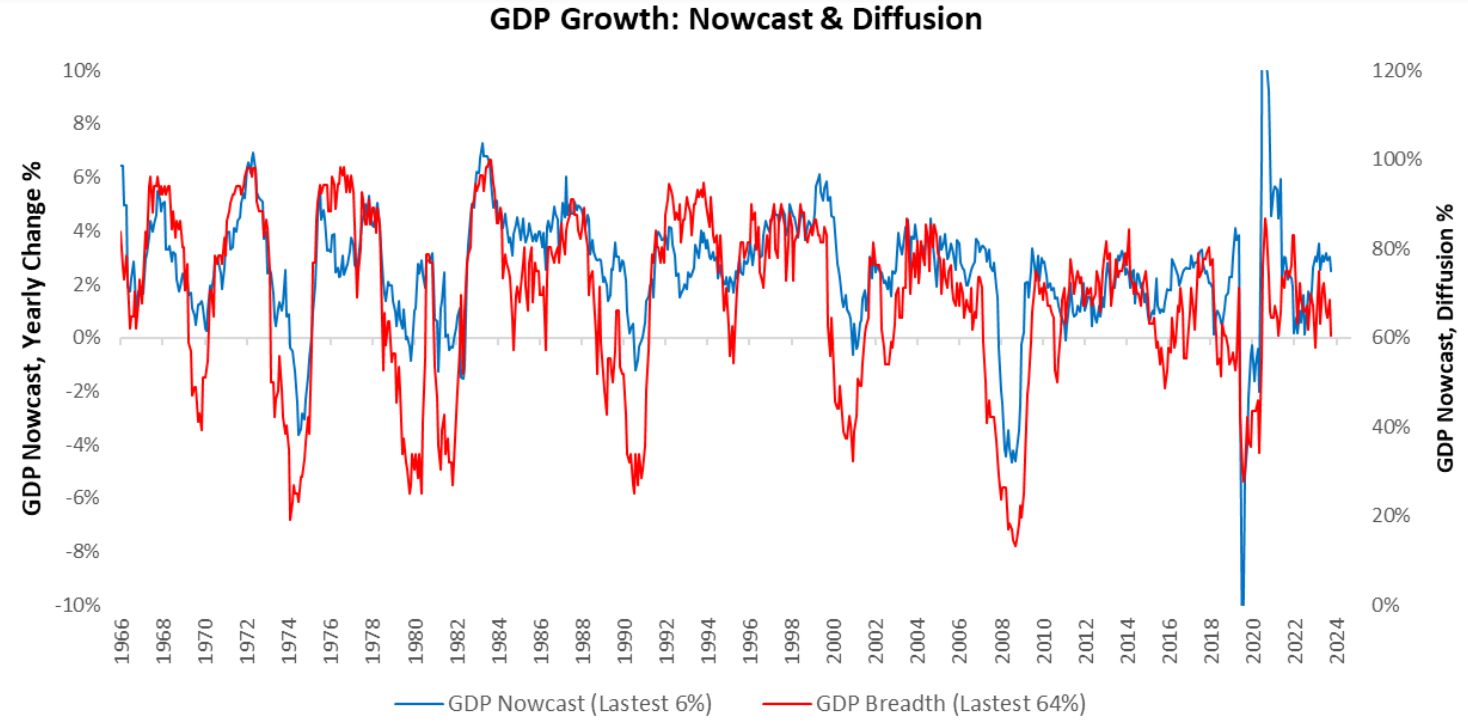
We also zoom out to offer what the mosaic of economic data says about the pervasiveness of GDP growth. Our GDP Nowcast economic data across 75 measures of real growth conditions to understand the economic conditions promptly. We share the current level of the nowcast in blue and a diffusion index of the underlying components in red. Currently, 61%of subcomponents, are rising, consistent with an expansion:
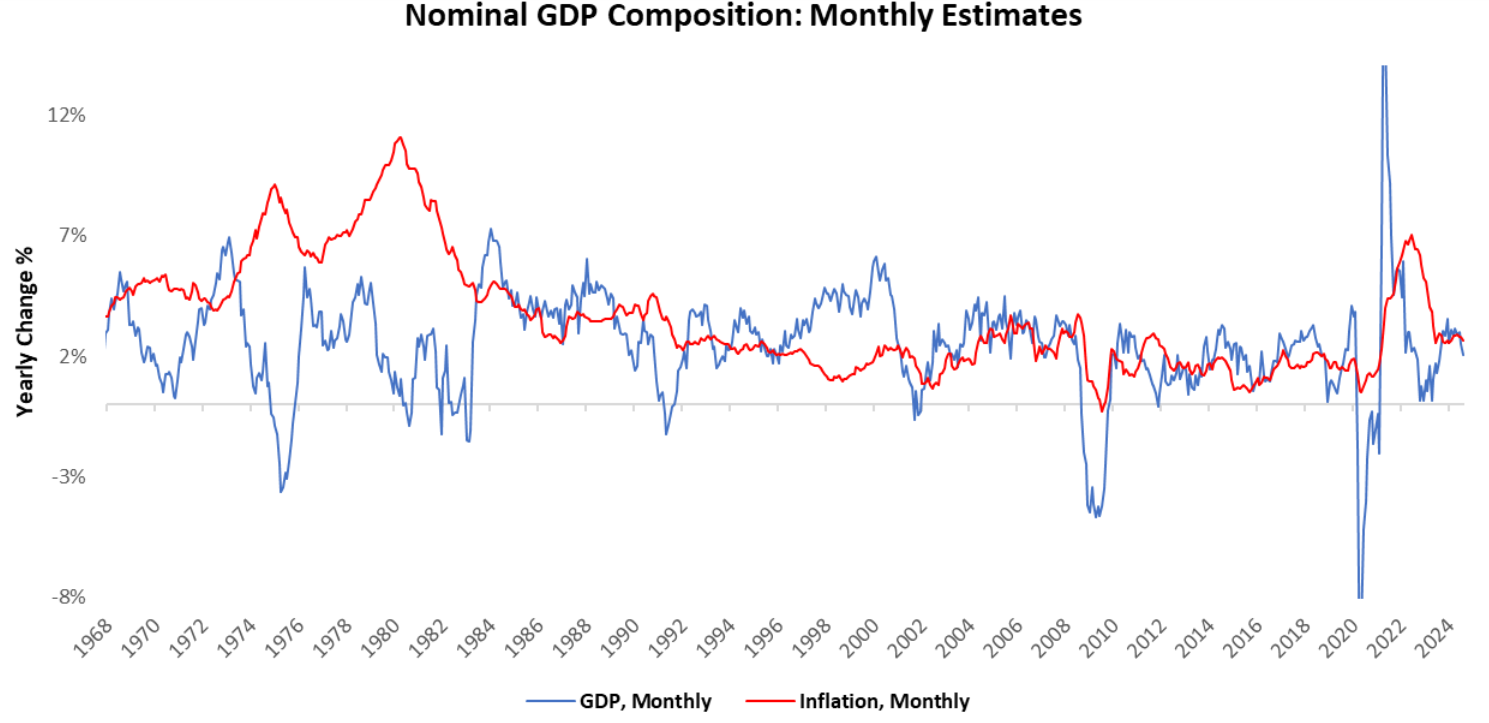
Finally, we show the composition of monthly estimates of nominal GDP, broken into real GDP growth and inflation. Our latest estimates place nominal GDP at 4.71% versus one year prior.
Overall, the latest GDP data was driven primarily by a sequential acceleration in Private Investment and Consumption expenditure. This acceleration in consumption continues to find its way to GDP & Corporate Profits, supporting the ongoing expansion. Nonetheless, broader measures of the labor market and cyclically sensitive spending, particularly manufacturing goods, motor vehicle production, and residential investment remain weak relative to the broader economy. Signs of slowing have increased. Overall, business cycle conditions suggest regime stability of a Slowing but Growing US economy. In the context of markets, our Asset Allocation strategy remains long equities and bonds with a healthy cash position. Until next time.
12 thoughts on “All Access Week: Growth Views”
Great article! I really appreciate the clear and detailed insights you’ve provided on this topic. It’s always refreshing to read content that breaks things down so well, making it easy for readers to grasp even complex ideas. I also found the practical tips you’ve shared to be very helpful. Looking forward to more informative posts like this! Keep up the good work!
Hi! Do you know if they make any plugins to assist with Search Engine Optimization? I’m trying to
get my website to rank for some targeted keywords but I’m not seeing very good gains.
If you know of any please share. Appreciate it!
You can read similar article here: Eco bij
Hey! Do you know if they make any plugins to assist with SEO?
I’m trying to get my blog to rank for some targeted keywords
but I’m not seeing very good success. If you know of any please share.
Kudos! You can read similar art here: Code of destiny
I am extremely impressed with your writing skills and
also with the structure on your weblog. Is this a paid subject matter or did you modify
it your self? Either way stay up the nice high quality writing, it is uncommon to see a nice weblog like this one these days.
LinkedIN Scraping!
Medicament prescribing information.
can you get cheap lisinopril prices
Been a loyal customer for years and they’ve never let me down.
The best in town, without a doubt.
can i purchase cheap cytotec for sale
Their medication reminders are such a thoughtful touch.
The most pleasant pharmacy experience every time.
gabapentin 300 mg neurontin
I’ve never had to wait long for a prescription here.
Always leaving this place satisfied.
can i order generic clomid for sale
A pharmacy that prides itself on quality service.
Prescription Drug Information, Interactions & Side.
what is gabapentin 100mg
A beacon of trust in international pharmacy services.
I’m really impressed with your writing skills and also with the
structure in your weblog. Is this a paid subject or did you modify it your self?
Anyway stay up the nice high quality writing, it’s rare to see a great weblog like this one today.
Madgicx!
I am really impressed with your writing abilities and also with the layout for your blog. Is that this a paid theme or did you customize it yourself? Anyway stay up the excellent high quality writing, it’s uncommon to peer a nice blog like this one nowadays. I like prometheus-research.com ! I made: Blaze AI
I’m really impressed with your writing talents as well as with the
format to your blog. Is this a paid topic or did you modify it your self?
Either way stay up the nice high quality writing, it’s uncommon to see a nice blog like
this one these days. LinkedIN Scraping!