Welcome to The Observatory. The Observatory is how we at Prometheus monitor the evolution of the economy and financial markets in real-time. The insights provided here are slivers of our research process that are integrated algorithmically into our systems to create rules-based portfolios.
Our primary takeaways are as follows:
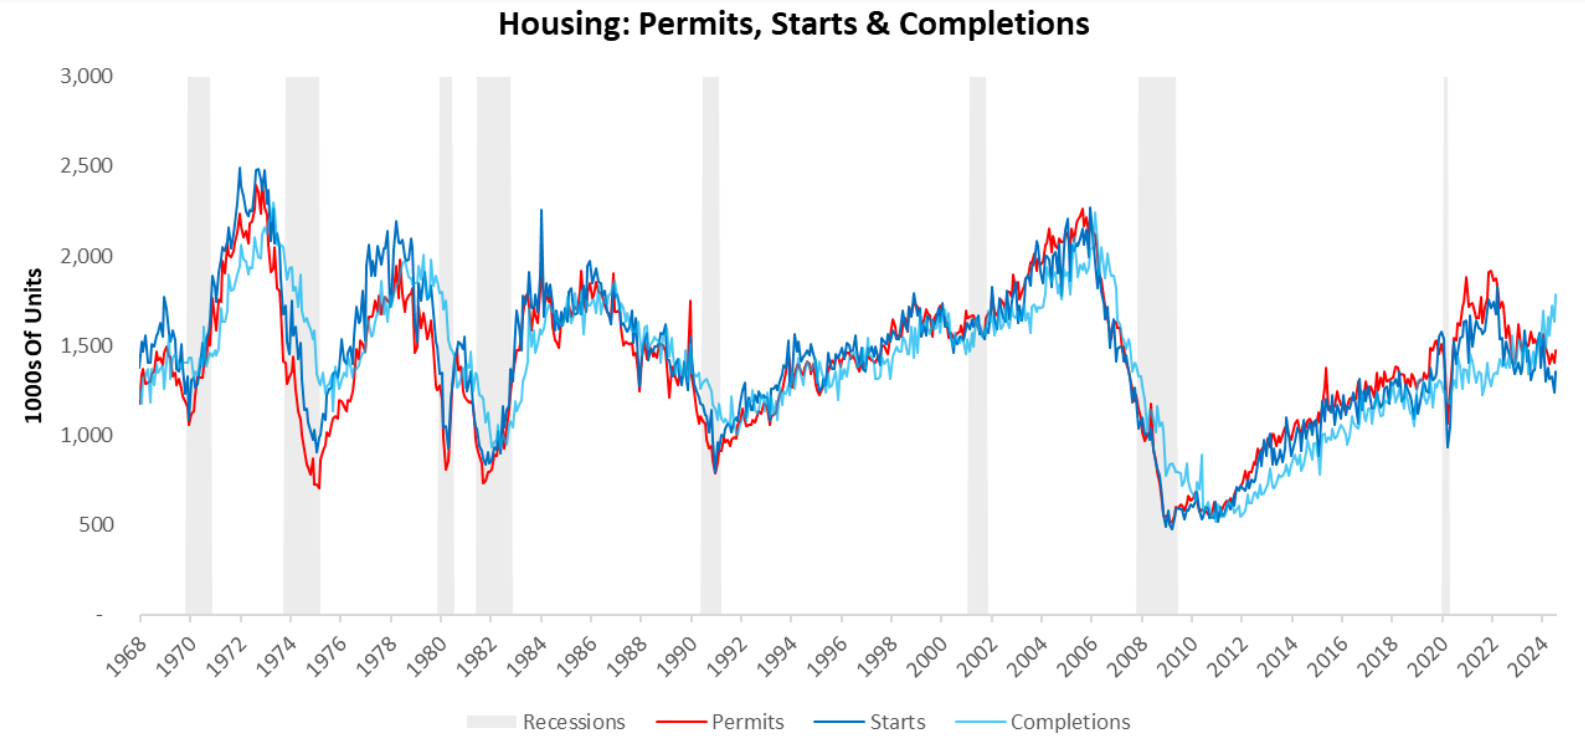
- The recent trend in housing data showed signs of a sequential improvement, with building permits, starts, and completions increasing.
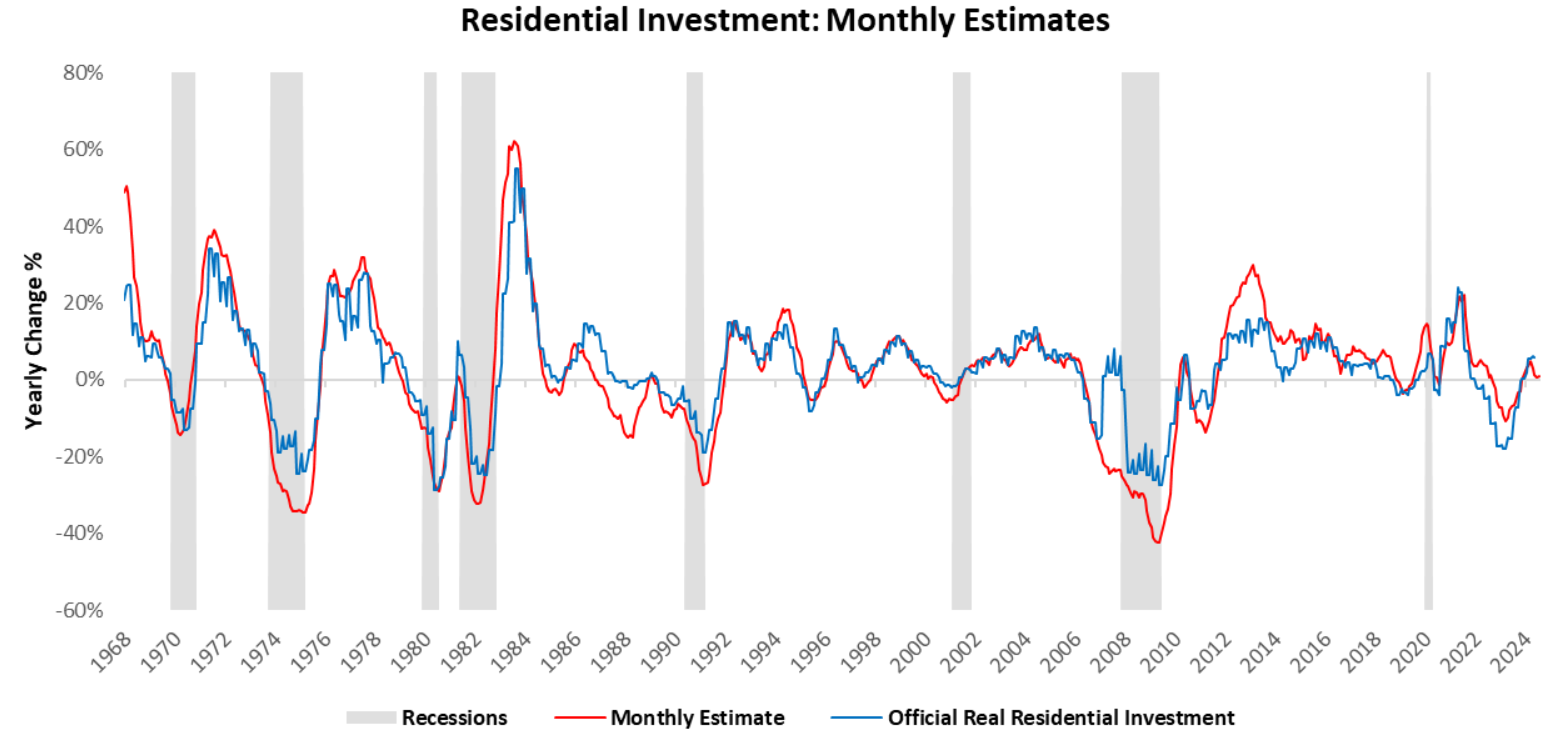
- However, upon zooming out, we continue to observe pressures persist in our estimates for residential investment which remain in contraction.
- Additionally, our cyclical measures of residential investment such as permit slowdown and pending construction projects are also within the ballpark of a recession.
- In the context of markets, homebuilders’ equity prices have increased sequentially, in line with the current relief in the residential investment trend. However, pressures persist and we continue to remain in a Slowing but Growing economy.
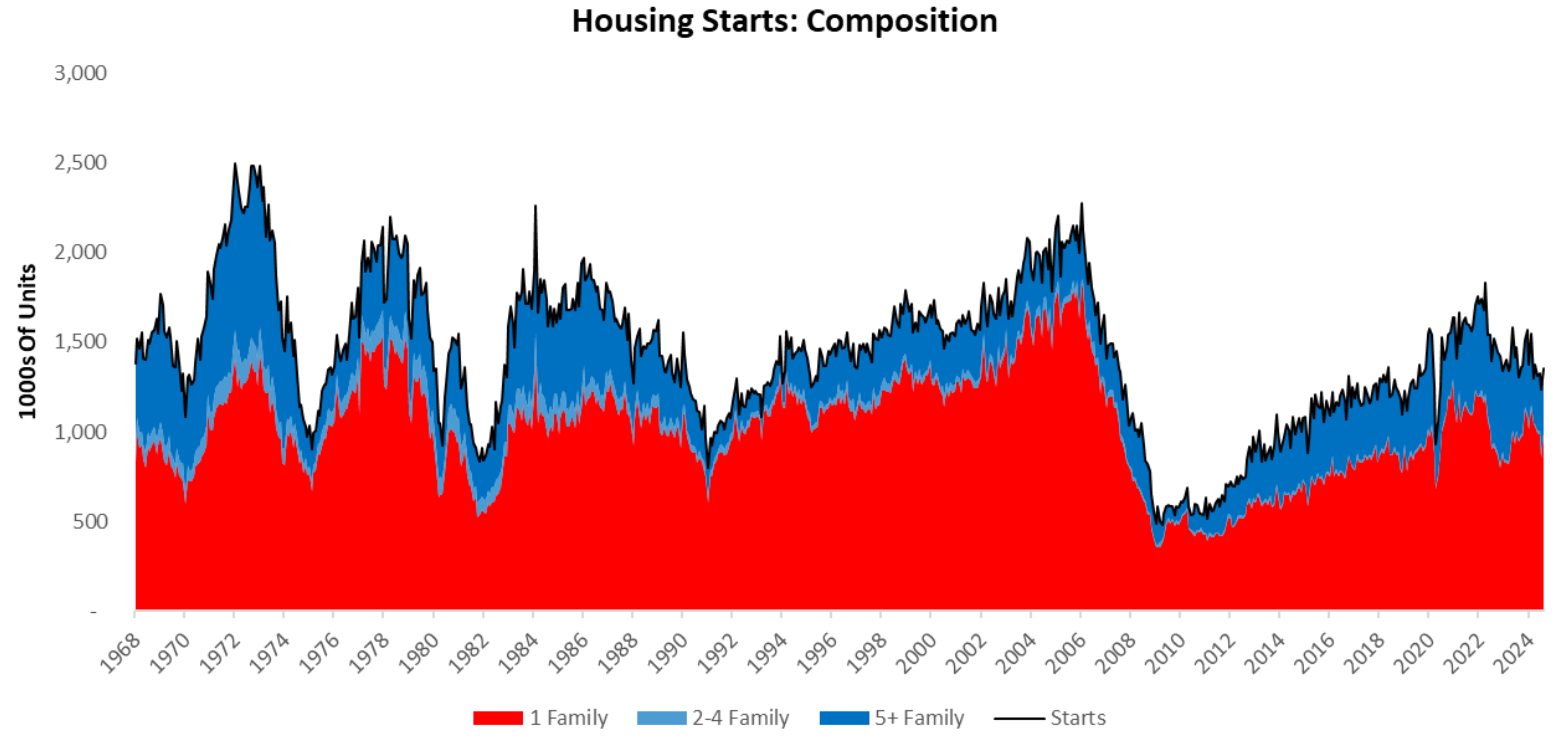
The latest data for August showed housing permits increased by 4.91%, housing starts increased by 9.62%, and housing completions increased by 9.22%. Below, we show the current levels for the same:
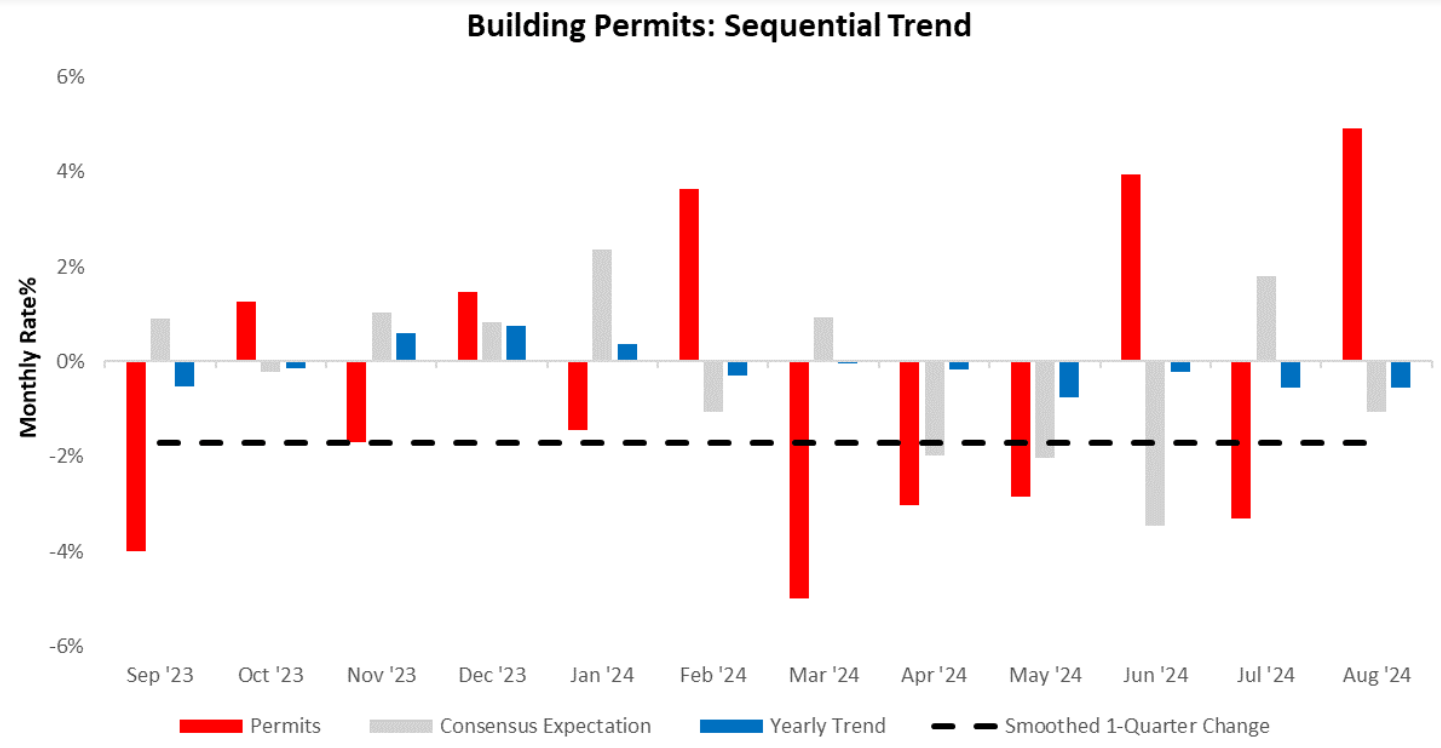
Zooming into the data, housing permits increased by 4.91%, surprising consensus expectations of -1.05%. Below, we show the sequential evolution of the data, along with the smoothed one-quarter change in the most recent data. We provide the smoothed version as monthly housing data contains significant noise.
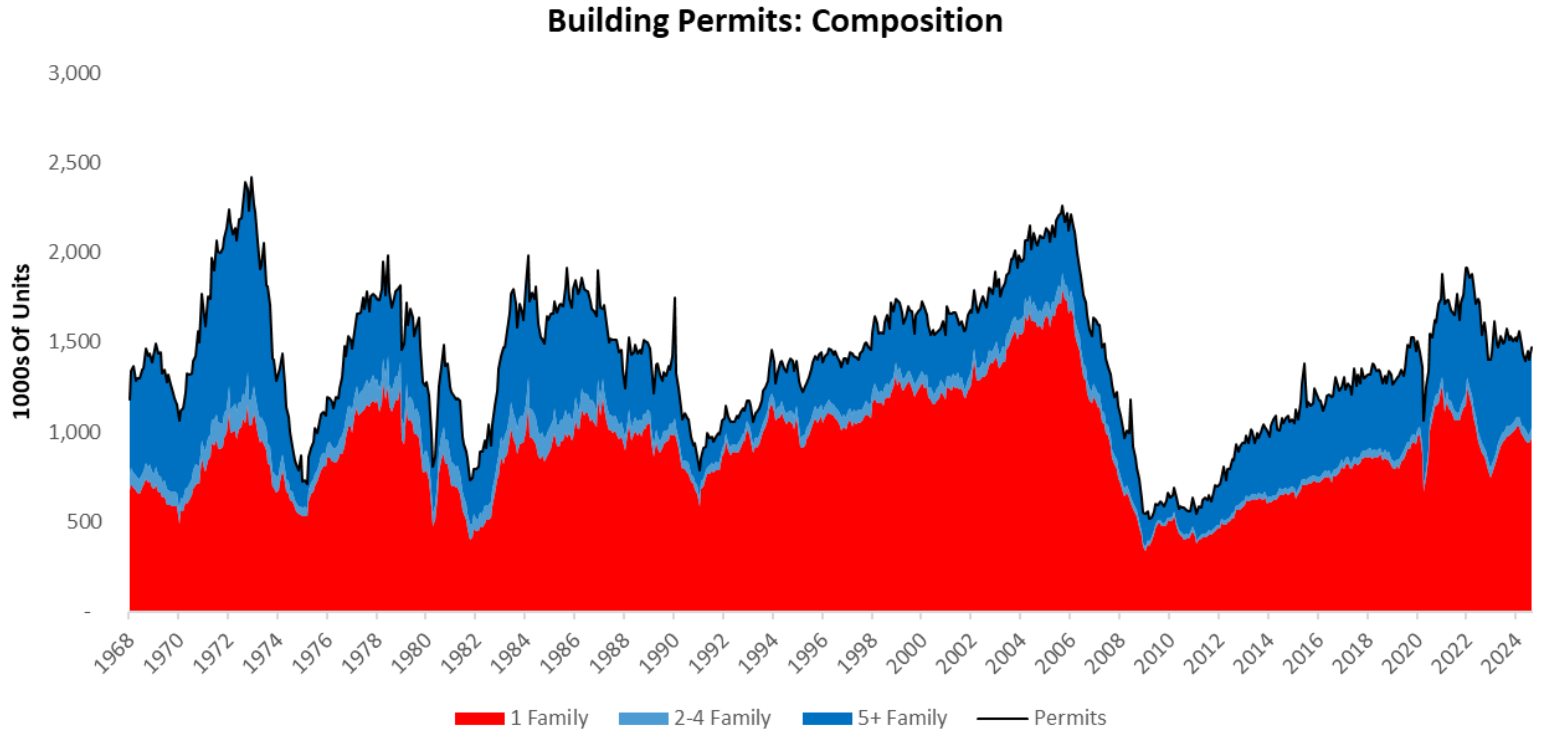
For further context, we zoom out to show the contributions from single-family homes (-5), two-family homes (-7), and multi-family homes (-91) to the fall (-103) in total permits over the last year:
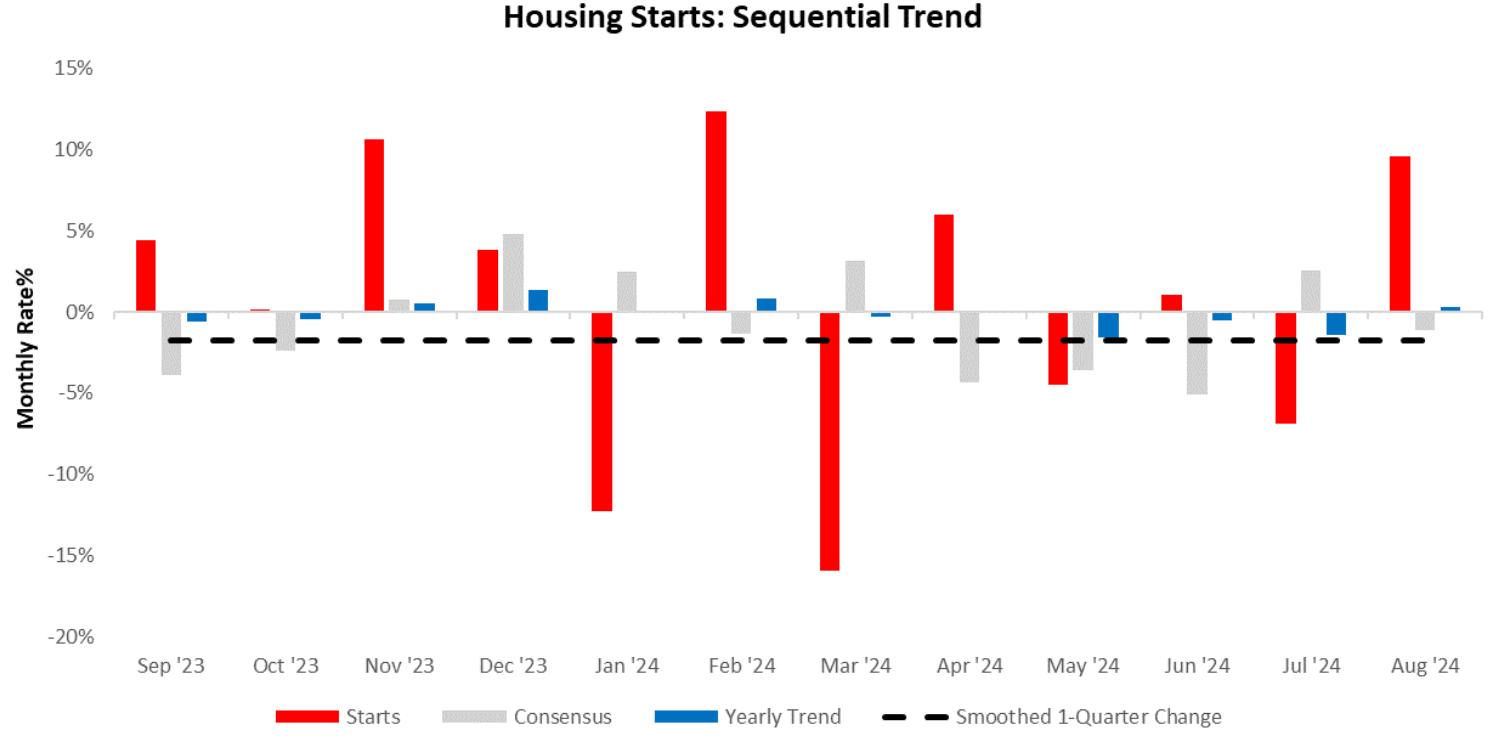
Consistent with the permits data, housing starts data showed starts increased by 9.62%, surprising consensus expectations of -1.13%. Below, we show the sequential evolution of the data, along with the smoothed one-quarter change in the most recent data. We provide the smoothed version as monthly housing data contain significant noise.
To illustrate the bigger picture, we show the contributions from single-family homes (135), two-family homes (-7), and multi-family homes (-22) to the rise (51) in total starts over the last year:
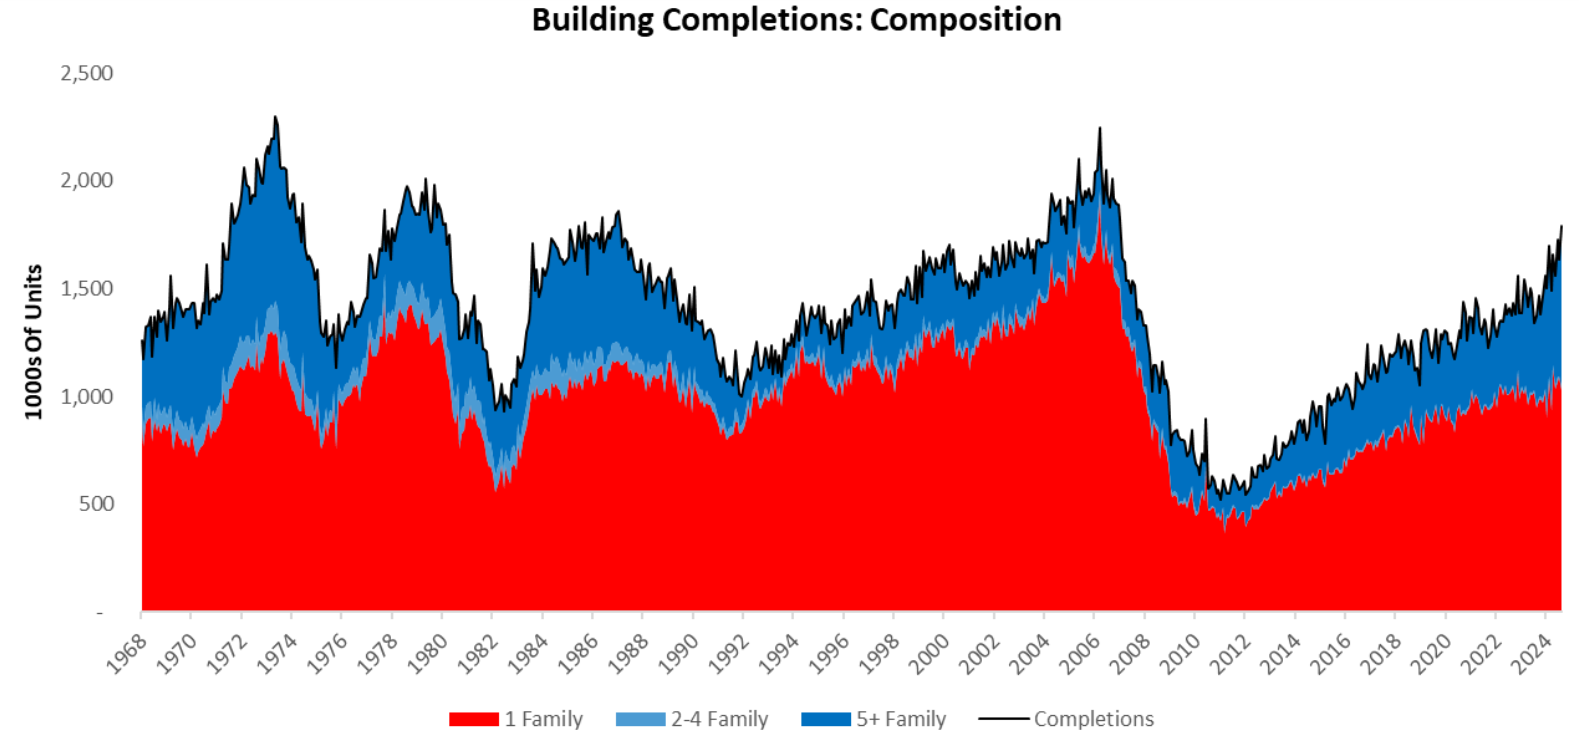
Last, in our sequential analysis, we turn to housing completions data, which showed completions increase by 9.22%. Below, we show the sequential evolution of the data, along with the smoothed one-quarter change in the most recent data. We provide the smoothed version as monthly housing data contain significant noise.
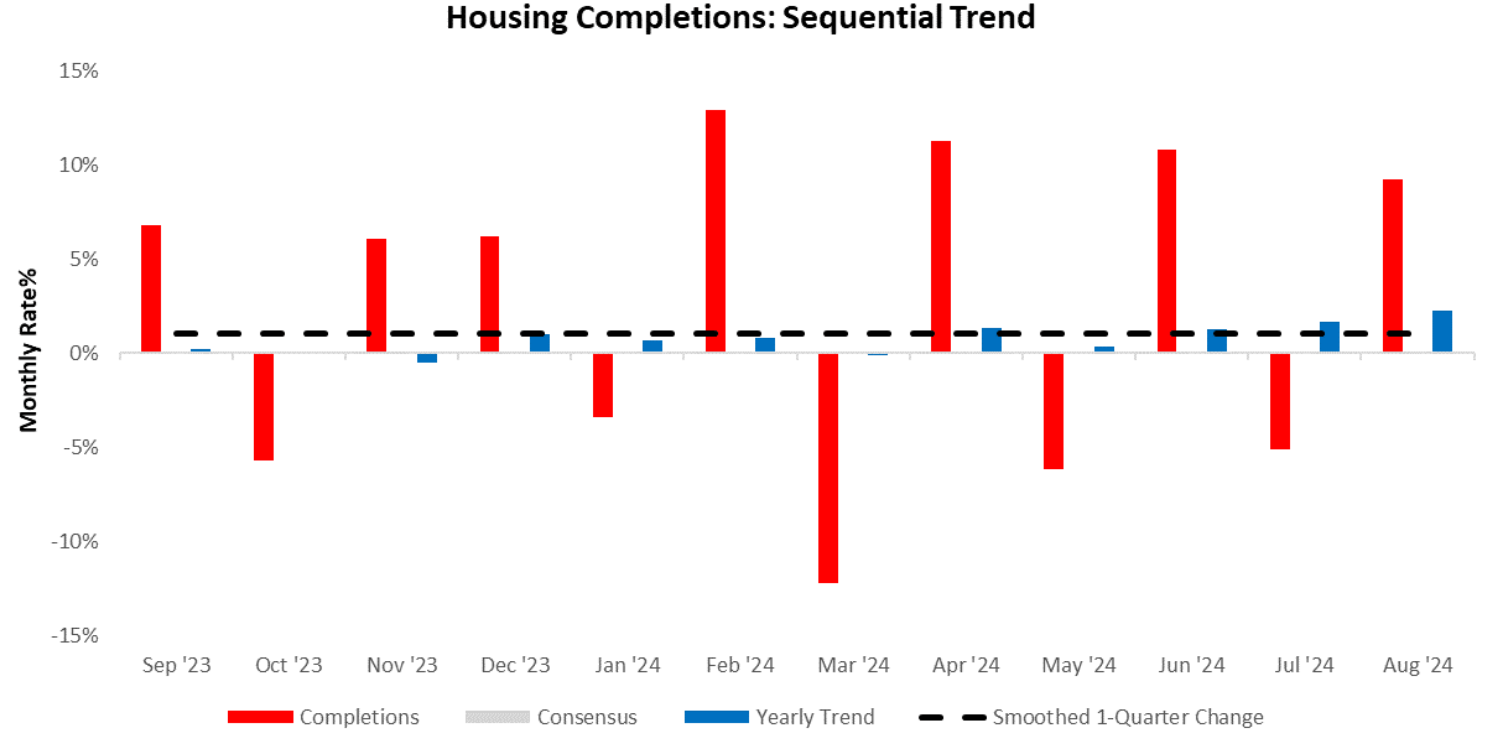
We show the contributions from single-family homes (-61), two-family homes (8), and multi-family homes (327) to the rise (415) in total completions over the last year:
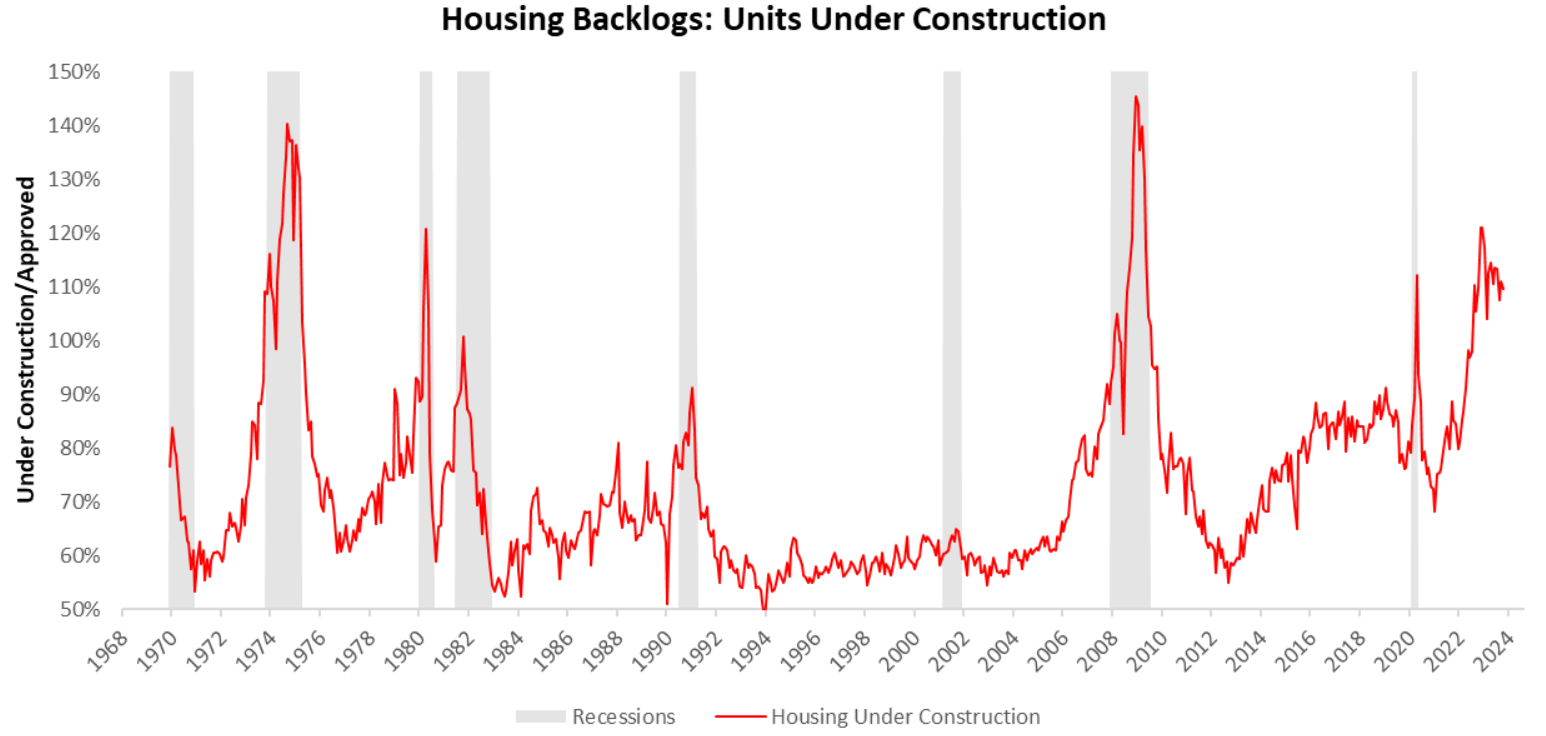
To get a better sense of where we are in the housing cycle, we examine how many construction projects have been approved but not yet started. According to the latest data, 19% of projects are yet to begin construction. Looking through history, housing-led recessions usually begin when this measure of construction slack is around 15% suggesting that we are within the ballpark of a recession.
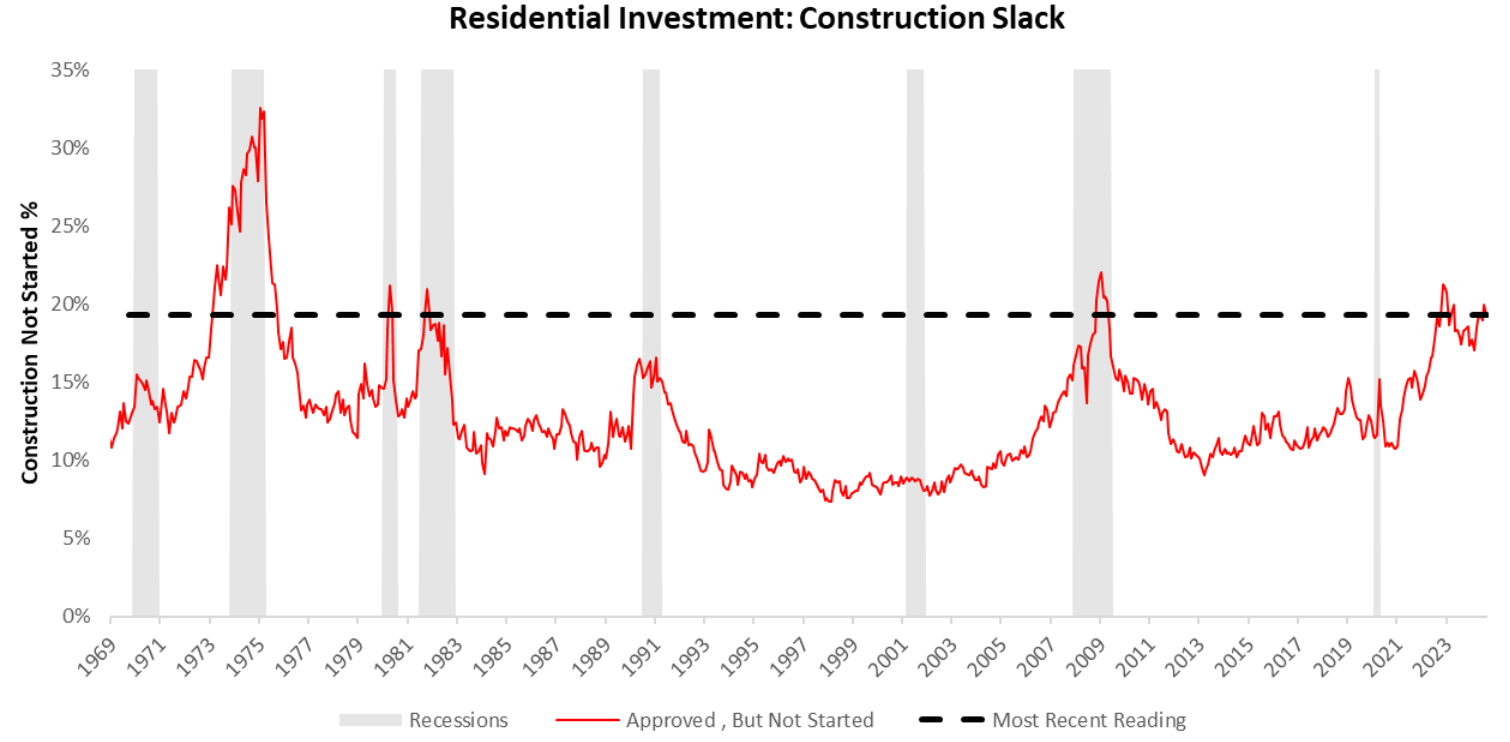
Now, while this rise in unstarted projects can often be a sign of weakness in perceived end demand, it can also be due to existing backlogs in construction. Below, we show a measure of these backlogs, which show the number of homes under construction relative to those under construction:
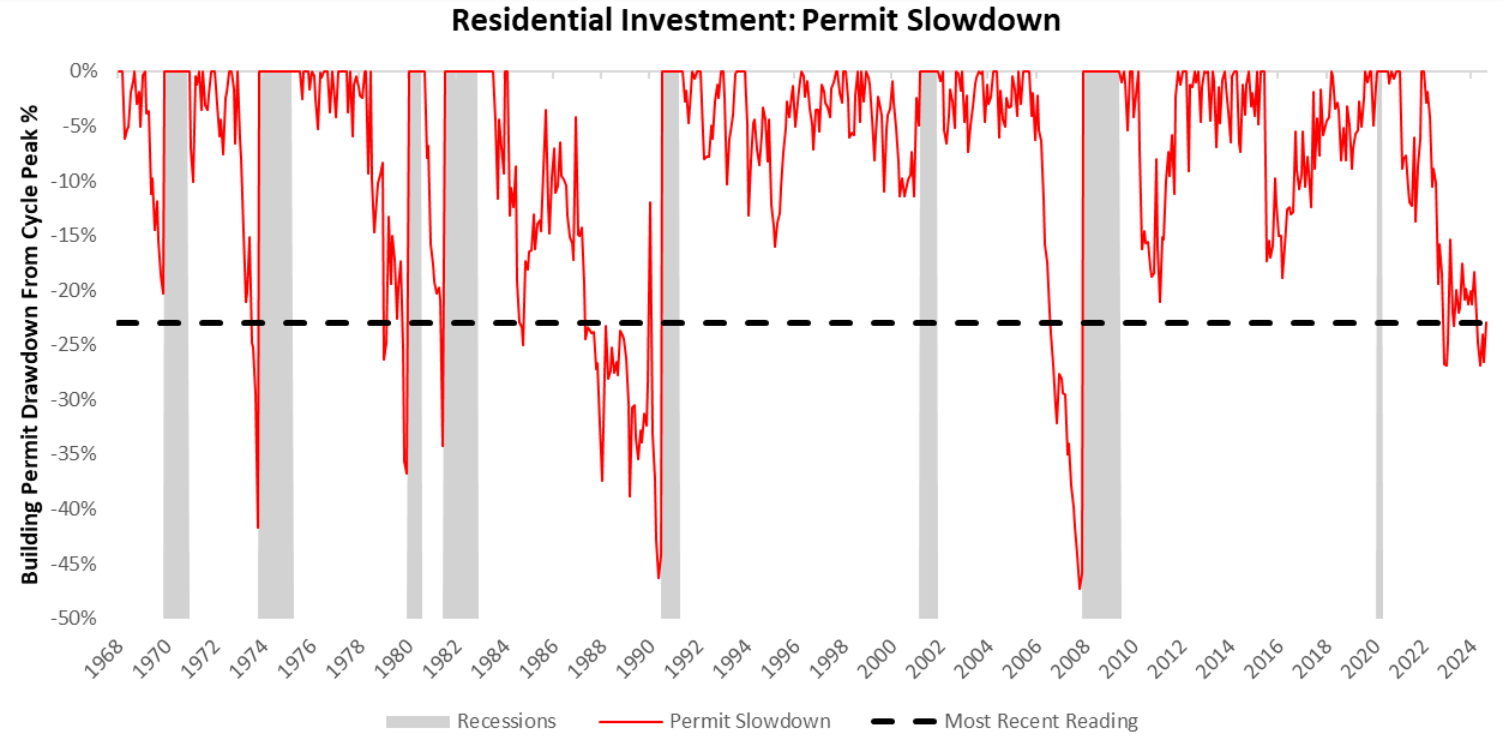
We conclude by examining another measure of housing weakness, i.e., permit slowdowns- which measures how much building permits have fallen from their cycle highs. Large drops in permits bode ill for the broader residential investment complex & GDP. The latest data shows that building permits are off their cycle highs by -22.98%. Typically, housing-led recessions usually begin when this measure of cyclical weakness is around -29% suggesting that we are within the ballpark of a recession.
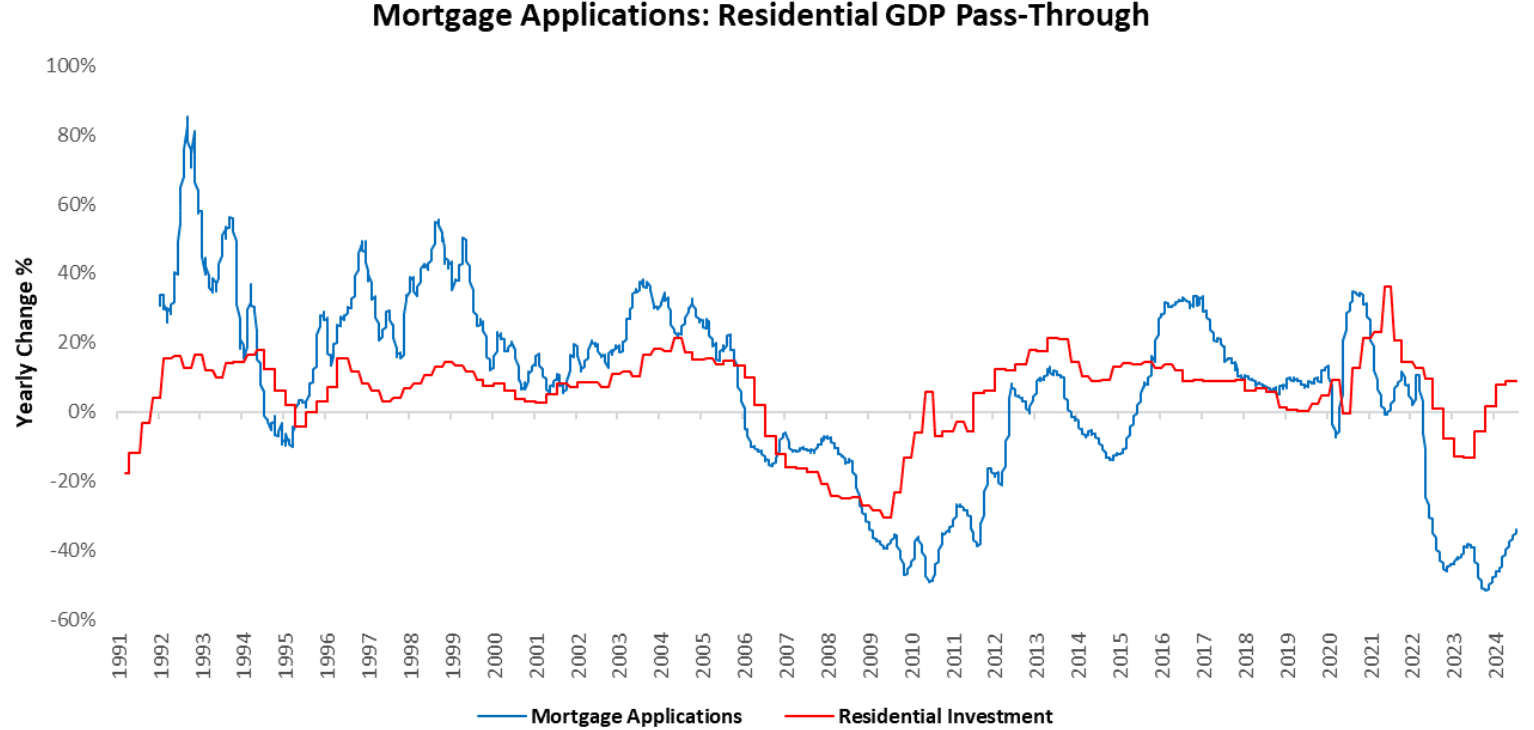
For a timelier ready-on condition, we turn to mortgage applications and mortgage spreads. The latest data shows a sequential improvement in our weekly tracking of mortgage applications. Our latest estimate suggests downward pressure on mortgage borrowing and residential investment. Our latest estimates show mortgage applications down by -34.14% compared to one year prior. We present this information below:
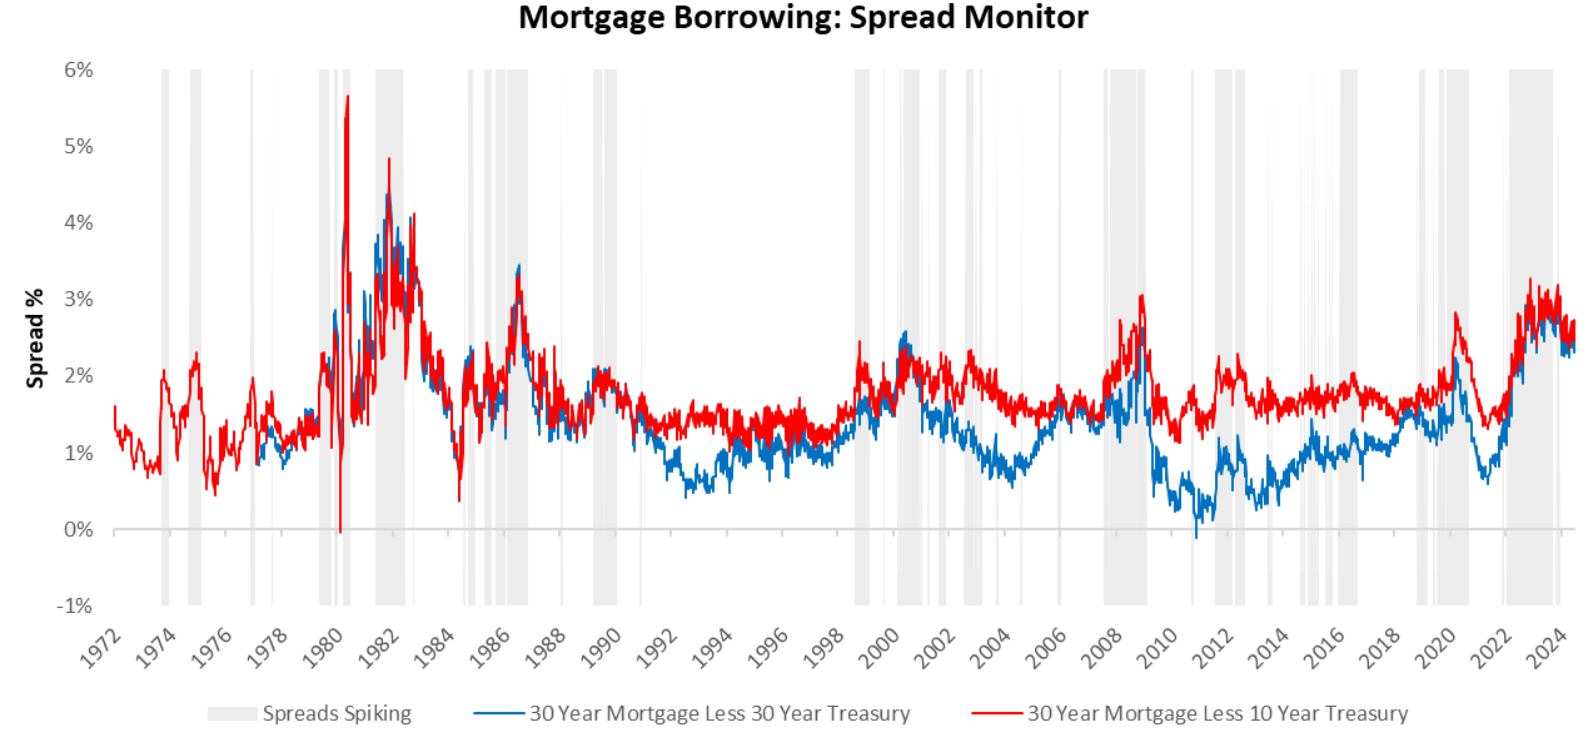
To assess the borrowing conditions driving these changes in mortgage applications, we turn to mortgage spreads. According to our measures, mortgage spreads remain contained. Spreads have remained contained since June 2024. Since then, the 30-year mortgage yield relative to 10-year Treasury yields has remained flat. Below, we present the 30-Year Mortgages relative to 10 & 30-Year Treasuries:
Aggregating these pressures, our latest monthly estimate place real residential investment at 1% versus one year ago.
Residential investment provides significant insight into the state of the business cycle, which allows us to better understand the drivers of current equity market pricing. Today, equity market returns are consistent with residential investment trends over the last year. We show this below:
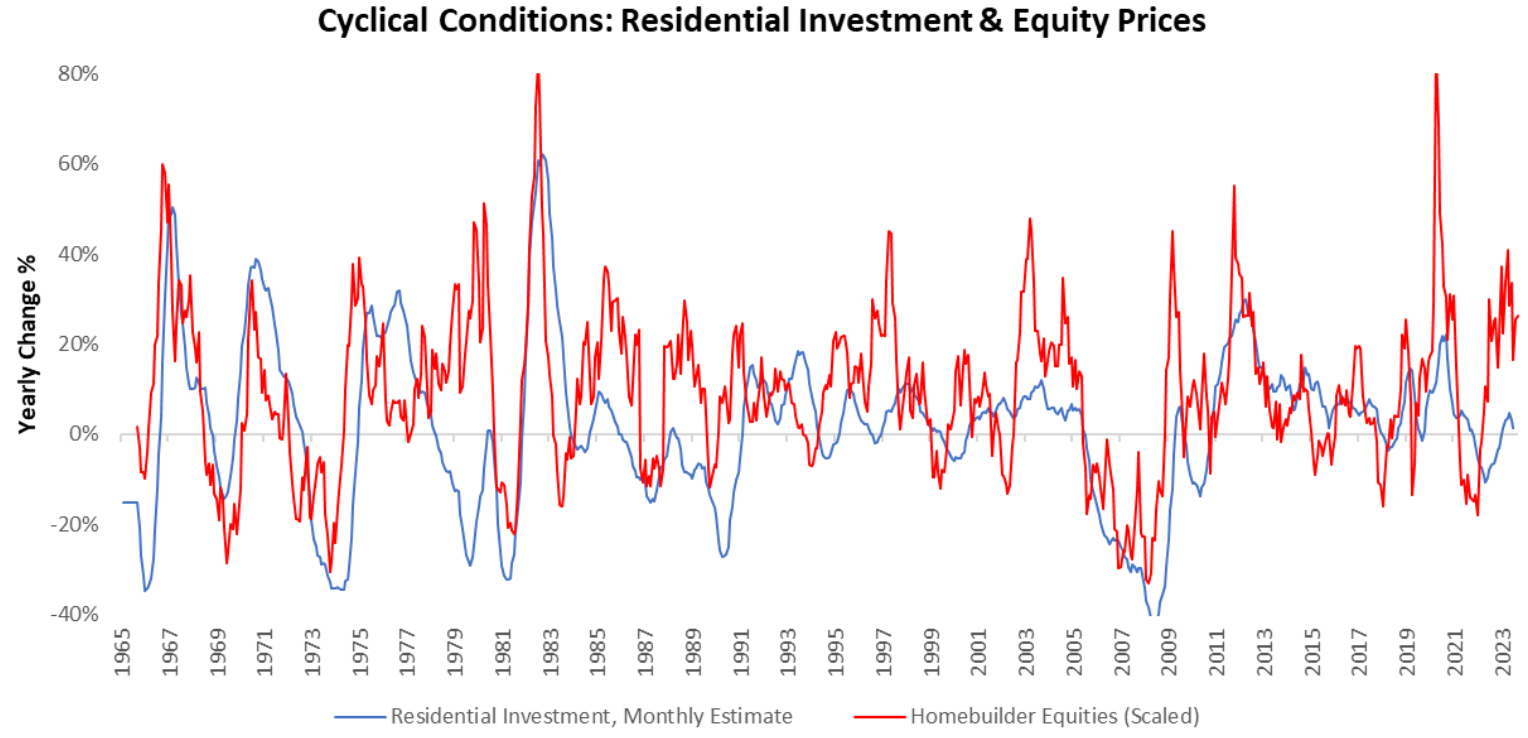
Overall, the recent trend in housing data showed signs of a sequential improvement. However, upon zooming out, we continue to observe pressures persist in our estimates for residential investment which remain in contraction. Additionally, our cyclical measures of residential investment such as permit slowdown and pending construction projects are also within the ballpark of a recession. In the context of markets, homebuilders’ equity prices have increased sequentially, in line with the current relief in the residential investment trend. However, pressures persist and we continue to remain in a Slowing but Growing economy. Until next time.
937 thoughts on “All Access Week: Residential Monitor”
Great article! I really appreciate the clear and detailed insights you’ve provided on this topic. It’s always refreshing to read content that breaks things down so well, making it easy for readers to grasp even complex ideas. I also found the practical tips you’ve shared to be very helpful. Looking forward to more informative posts like this! Keep up the good work!
Hi there! Do you know if they make any plugins to help with
Search Engine Optimization? I’m trying to get my site to rank for some targeted keywords but I’m not seeing very good results.
If you know of any please share. Many thanks!
I saw similar blog here: Eco wool
Some individuals also eat foods which might be high in omega-three fatty acids, beta-carotene and vitamins A and C to maintain their eyes from getting too dry.
Sugar defender Sugarcoating Defender to my daily regimen was one of the very best decisions I’ve made for my wellness.
I’m careful regarding what I eat, yet this supplement includes an additional layer of assistance.
I really feel much more consistent throughout the day, and my yearnings
have actually decreased dramatically. It’s nice to have something so
basic that makes such a large distinction! sugar defender ingredients
Sugar Defender Incorporating Sugar Defender into my everyday program overall well-being.
As somebody who focuses on healthy consuming, I appreciate the additional protection this supplement provides.
Since starting to take it, I have actually seen a marked renovation in my energy levels and a considerable decrease in my desire for unhealthy treats such a such an extensive impact on my
daily life. sugar defender
After I initially left a comment I seem to have clicked the -Notify me when new comments are added- checkbox and from now on whenever a comment is added I recieve 4 emails with the same comment. Perhaps there is an easy method you are able to remove me from that service? Appreciate it.
You made some good points there. I checked on the web for more info about the issue and found most individuals will go along with your views on this site.
It’s nearly impossible to find educated people about this topic, but you sound like you know what you’re talking about! Thanks
I want to to thank you for this fantastic read!! I definitely loved every bit of it. I have you saved as a favorite to check out new stuff you post…
Spot on with this write-up, I really think this web site needs far more attention. I’ll probably be returning to see more, thanks for the advice!
I enjoy reading an article that will make people think. Also, many thanks for permitting me to comment.
Oh my goodness! Awesome article dude! Many thanks, However I am having issues with your RSS. I don’t know the reason why I can’t subscribe to it. Is there anyone else having identical RSS issues? Anybody who knows the solution can you kindly respond? Thanks!
When I initially commented I appear to have clicked on the -Notify me when new comments are added- checkbox and now every time a comment is added I recieve 4 emails with the same comment. Perhaps there is an easy method you are able to remove me from that service? Thanks a lot.
Very good post. I will be going through many of these issues as well..
Good day! I just want to give you a huge thumbs up for the great info you have got here on this post. I’ll be returning to your web site for more soon.
You need to be a part of a contest for one of the best websites on the web. I most certainly will recommend this website!
This blog was… how do I say it? Relevant!! Finally I have found something which helped me. Kudos!
Everyone loves it when folks get together and share views. Great site, keep it up.
This web site certainly has all of the info I needed concerning this subject and didn’t know who to ask.
I was able to find good info from your content.
Way cool! Some extremely valid points! I appreciate you penning this write-up and the rest of the site is extremely good.
The very next time I read a blog, Hopefully it won’t disappoint me just as much as this particular one. I mean, Yes, it was my choice to read through, however I really thought you would probably have something helpful to say. All I hear is a bunch of complaining about something you could possibly fix if you were not too busy searching for attention.
It’s hard to find well-informed people on this subject, but you sound like you know what you’re talking about! Thanks
I like looking through an article that can make men and women think. Also, thanks for permitting me to comment.
Everything is very open with a clear clarification of the issues. It was really informative. Your website is very helpful. Thank you for sharing!
I was able to find good info from your content.
This is a very good tip particularly to those new to the blogosphere. Short but very accurate info… Appreciate your sharing this one. A must read article.
I have learned newer and more effective things by means of your blog. One other thing I’d like to say is that newer personal computer operating systems are inclined to allow extra memory to get used, but they likewise demand more memory simply to function. If a person’s computer can’t handle extra memory and also the newest computer software requires that memory increase, it could be the time to buy a new Laptop. Thanks
After checking out a few of the articles on your web site, I really appreciate your technique of writing a blog. I saved it to my bookmark webpage list and will be checking back soon. Take a look at my web site as well and let me know your opinion.
Your style is unique compared to other folks I have read stuff from. I appreciate you for posting when you’ve got the opportunity, Guess I’ll just bookmark this site.
dance shoes that are shiny are the most cool stuff that you could possibly wear**
There are some fascinating points over time in this article but I do not know if them all center to heart. There may be some validity but I am going to take hold opinion until I take a look at it further. Excellent post , thanks therefore we want a lot more! Put into FeedBurner in addition
There’s definately a great deal to learn about this issue. I love all of the points you have made.
I?ve been exploring for a bit for any high quality articles or blog posts in this kind of house . Exploring in Yahoo I finally stumbled upon this site. Reading this info So i am happy to convey that I have a very just right uncanny feeling I came upon just what I needed. I such a lot definitely will make certain to don?t overlook this web site and provides it a glance regularly.
You are so cool! I don’t believe I’ve read through something like that before. So good to discover somebody with unique thoughts on this issue. Really.. thanks for starting this up. This site is something that’s needed on the internet, someone with a bit of originality.
I’d like to thank you for the efforts you have put in penning this site. I am hoping to see the same high-grade content by you in the future as well. In truth, your creative writing abilities has inspired me to get my own, personal blog now 😉
I used to be able to find good information from your articles.
I simply noticed your blog site in the past and i also have actually been looking through this task on a daily basis. There’s a great number of tips on this site we adore your look with all the web portal in addition. Support the excellent give good results!
I’m not sure where you’re getting your info, but great topic. I needs to spend some time learning much more or understanding more. Thanks for excellent information I was looking for this info for my mission.
It is the best time to make some plans for the future and it’s time to be happy. I have learn this post and if I may just I wish to suggest you few interesting things or suggestions. Perhaps you can write subsequent articles regarding this article. I want to learn more things approximately it!
Blaine is not the best magician but i can say that he has great showmanship and i like his show.
Yay google is my king assisted me to find this outstanding site! .
wireless headphones are the best because they do not have those bulky wires”
I blog frequently and I genuinely thank you for your information. This article has really peaked my interest. I am going to book mark your blog and keep checking for new information about once a week. I subscribed to your Feed too.
display cabinets with transparent glass would be the best thing to keep your stuff~
Good day! I could have sworn I’ve been to your blog before but after looking at some of the articles I realized it’s new to me. Regardless, I’m definitely happy I discovered it and I’ll be book-marking it and checking back regularly!
golf shoes that are made from natural leather would be my ideal choose whenever i play golf**
my father started a calorie restriction diet and all i can say is that it helped him to reduce body fats~
I recently came across your blog and have been reading along. I thought I could leave my first comment. I don’t know what to say except that I have enjoyed scaning what you all have to say
I think other website proprietors should take this site as an model, very clean and great user genial style and design, let alone the content. You’re an expert in this topic!
my father have lots and lots of collectible coins that are very precious and rare*
I blog quite often and I seriously thank you for your content. This article has truly peaked my interest. I will book mark your site and keep checking for new details about once per week. I opted in for your Feed as well.
I could not refrain from commenting. Very well written!
Many thanks for this info I has been hunting all Yahoo in order to locate it!
What your stating is totally accurate. I know that everyone must say the exact same issue, but I just believe that you set it in a way that absolutely everyone can recognize. I also appreciate the images you place in the following. They suit so properly with what youre hoping to say. Im certain youll achieve so a lot of men and women with what youve obtained to say.
I’m really thankful on the author of the post for producing this lovely and informative article live to put us. We actually appreciate ur effort. Maintain the great work. . . .
Everything is very open with a really clear description of the challenges. It was truly informative. Your site is extremely helpful. Many thanks for sharing!
Hello there! This article could not be written any better! Going through this post reminds me of my previous roommate! He continually kept preaching about this. I will send this article to him. Fairly certain he’ll have a good read. Many thanks for sharing!
There a few intriguing points in time in this post but I do not know if every one of them center to heart. You can find some validity but I’ll take hold opinion until I explore it further. Excellent article , thanks so we want more! Combined with FeedBurner too
This is an awesome blog. It helped me alot. Thanks for the information.
i am amazed how cheap broadband internet is during these year, isps have some promo too-
Hello, you used to write great, but the last several posts have been kinda boring¡K I miss your super writings. Past several posts are just a little bit out of track! come on! Pristina Hotels
i would love to enter my baby on a baby contest because she is very nice and talented;;
Pretty nice post. I just stumbled upon your blog and wanted to say that I have really enjoyed browsing your blog posts. In any case I’ll be subscribing to your feed and I hope you write again soon.
Thanks for the information… appreciated… been reading for awhile, and just wanted to let you know I continue to enjoy your writing.
I like this weblog so much, saved to fav.
I really happy to read this post,I was just imagine about it and you provided me the correct information .
Saved as a favorite, I love your web site!
Hello there! This post could not be written any better! Reading through this article reminds me of my previous roommate! He always kept preaching about this. I am going to forward this information to him. Fairly certain he’ll have a great read. Thanks for sharing!
My spouse and I absolutely love your blog and find a lot of your post’s to be just what I’m looking for. Do you offer guest writers to write content for you? I wouldn’t mind writing a post or elaborating on a number of the subjects you write related to here. Again, awesome blog! visit my site ex girlfriends
This is exactly what I was looking for.. really simple to install, totally free just had to register to download, thanks
I admit, I have not been on this webpage in a long time… however it was one more joy to see It is such an significant topic and also ignored by so many, even professionals. I thank you to support making people more aware of possible issues.
My brother recommended I might like this web site. He was entirely right. This post truly made my day. You can not imagine simply how much time I had spent for this information! Thanks!
Hello my friend! I want to say that this article is amazing, great written and include approximately all vital infos. I¡¦d like to see extra posts like this .
garden sheds can provide comfort specially in the hot summer months**
A fascinating discussion is definitely worth comment. There’s no doubt that that you should write more on this issue, it may not be a taboo matter but typically people do not talk about such subjects. To the next! Kind regards!
I dont leave a lot of comments on a lot of blogs each week but i felt i had to here. Do you need many drafts to make a post?
I just added this blog to my rss reader, great stuff. Can’t get enough!
i would always be a fan of Nip/Tuck, i was saddened about the episode when one of the doctors got breast cancer*
I would like to thank you for the efforts you have put in writing this blog. I really hope to view the same high-grade content from you in the future as well. In fact, your creative writing abilities has encouraged me to get my own, personal website now 😉
Do you really think like that as you wrote in your post? Because i`ve got different opinion about that. I don`t know if i can write here about it but if you want to ask me about someting just write to me. Nice blog
Very good information. Lucky me I found your website by chance (stumbleupon). I have bookmarked it for later!
An interesting discussion is definitely worth comment. I do believe that you should publish more about this issue, it might not be a taboo matter but usually people don’t speak about these topics. To the next! Kind regards.
bookmarked!!, I like your web site.
I?m certain there are a lot of added nice instances in the long term for individuals who study your website.
currency trading is a bit tricky compared to internet marketing but you could earn a lot from it`
I’m curious to find out what blog system you happen to be utilizing? I’m having some small security issues with my latest site and I would like to find something more safe. Do you have any recommendations?
i like to search the internet for new kitchen gadgets to add to my kitchen..
Hello there! Do you use Twitter? I’d like to follow you if that would be okay. I’m absolutely enjoying your blog and look forward to new posts.
There are very lots of details that way to consider. This is a fantastic examine start up. I offer the thoughts above as general inspiration but clearly you’ll find questions just like the one you raise up where the most critical factor will likely be getting work done in honest very good faith. I don?t know if recommendations have emerged about items like that, but I know that a job is clearly referred to as a good game. Both children glance at the impact of only a moment’s pleasure, throughout their lives.
Great article! We are linking to this particularly great article on our website. Keep up the great writing.
This is a topic which is close to my heart… Thank you! Where can I find the contact details for questions?
I used to be able to find good information from your articles.
After I initially left a comment I seem to have clicked the -Notify me when new comments are added- checkbox and from now on whenever a comment is added I get 4 emails with the same comment. Perhaps there is a way you can remove me from that service? Kudos.
But the unimaginative writers couldn’t be bothered to work out a plot consistent with the all the rest of the Star Trek collection.
Ill do this if need to as much as I hope that is not too far off the track.
Wonderful article! We are linking to this particularly great article on our website. Keep up the great writing.
Howdy just wanted to give you a brief heads up and let you know a few of the pictures aren’t loading correctly. I’m not sure why but I think its a linking issue. I’ve tried it in two different internet browsers and both show the same outcome.
Hi there, i read your blog occasionally and i own a similar one and i was just curious if you get a lot of spam feedback? If so how do you stop it, any plugin or anything you can suggest? I get so much lately it’s driving me crazy so any support is very much appreciated.
Aw, this was an exceptionally nice post. Taking a few minutes and actual effort to create a really good article… but what can I say… I hesitate a whole lot and don’t manage to get anything done.
When do you think this Real Estate market will go back up? Or is it still too early to tell? We are seeing a lot of housing foreclosures in Longwood Florida. What about you? I would love to get your feedback on this.
Good post. I learn something totally new and challenging on blogs I stumbleupon on a daily basis. It’s always interesting to read content from other writers and use something from their websites.
Remarkable post! Chatting about how taken pleasure in the exact examining. I’m hoping to see significantly more from your website. It looks you might have very good knowledge combined with perception. My corporation is very much fulfilled with this particular tips.
Oh my goodness! Awesome article dude! Many thanks, However I am having troubles with your RSS. I don’t know why I am unable to subscribe to it. Is there anybody getting identical RSS issues? Anyone who knows the answer will you kindly respond? Thanx!!
You’re so interesting! I don’t suppose I’ve read through a single thing like that before. So good to discover someone with a few genuine thoughts on this subject matter. Seriously.. thank you for starting this up. This web site is something that is needed on the internet, someone with some originality.
Hi, I do think this is an excellent site. I stumbledupon it 😉 I will come back once again since I bookmarked it. Money and freedom is the best way to change, may you be rich and continue to help others.
I’m impressed, I have to admit. Seldom do I encounter a blog that’s equally educative and interesting, and without a doubt, you have hit the nail on the head. The problem is something which too few folks are speaking intelligently about. I’m very happy that I found this during my hunt for something concerning this.
I really like it when individuals get together and share opinions. Great site, continue the good work.
This site truly has all the info I wanted about this subject and didn’t know who to ask.
Having read this I thought it was really enlightening. I appreciate you spending some time and energy to put this informative article together. I once again find myself personally spending a lot of time both reading and leaving comments. But so what, it was still worthwhile!
Hello there, I believe your site could possibly be having internet browser compatibility issues. Whenever I look at your site in Safari, it looks fine however, if opening in Internet Explorer, it’s got some overlapping issues. I just wanted to give you a quick heads up! Aside from that, fantastic website.
Pretty! This has been a really wonderful post. Thanks for supplying this information.
Great article. I’m going through many of these issues as well..
I have to thank you for the efforts you’ve put in writing this website. I really hope to check out the same high-grade blog posts by you in the future as well. In truth, your creative writing abilities has motivated me to get my own blog now 😉
I really love your website.. Excellent colors & theme. Did you create this web site yourself? Please reply back as I’m looking to create my own website and want to find out where you got this from or just what the theme is called. Kudos.
You are so cool! I do not think I’ve read anything like this before. So wonderful to discover another person with some genuine thoughts on this issue. Really.. thank you for starting this up. This web site is something that is needed on the web, someone with a bit of originality.
You have made some decent points there. I looked on the internet for more information about the issue and found most individuals will go along with your views on this web site.
You’re so cool! I don’t suppose I’ve read anything like this before. So great to find someone with a few original thoughts on this topic. Seriously.. thank you for starting this up. This web site is one thing that is needed on the web, someone with a little originality.
I could not refrain from commenting. Well written!
I wanted to thank you for this excellent read!! I definitely loved every bit of it. I have got you saved as a favorite to look at new stuff you post…
I was pretty pleased to find this page. I wanted to thank you for ones time for this wonderful read!! I definitely enjoyed every little bit of it and I have you bookmarked to check out new information on your web site.
I needed to thank you for this great read!! I certainly enjoyed every little bit of it. I’ve got you book marked to check out new stuff you post…
Greetings! Very helpful advice within this article! It’s the little changes that produce the biggest changes. Many thanks for sharing!
Pretty! This has been a really wonderful article. Many thanks for supplying this info.
I have to thank you for the efforts you’ve put in penning this website. I’m hoping to view the same high-grade content by you later on as well. In truth, your creative writing abilities has encouraged me to get my own, personal website now 😉
Way cool! Some very valid points! I appreciate you writing this article and the rest of the website is extremely good.
I couldn’t resist commenting. Well written.
Watch our exclusive Neerfit sexy bf video on neerfit.co.in.
Hi there! This blog post couldn’t be written much better! Looking through this article reminds me of my previous roommate! He always kept preaching about this. I’ll forward this information to him. Pretty sure he’s going to have a good read. I appreciate you for sharing!
This is a very good tip particularly to those fresh to the blogosphere. Short but very precise info… Many thanks for sharing this one. A must read article!
Nice post. I learn something totally new and challenging on blogs I stumbleupon on a daily basis. It will always be useful to read content from other authors and practice something from their web sites.
I used to be able to find good info from your blog articles.
Your style is really unique in comparison to other folks I have read stuff from. I appreciate you for posting when you’ve got the opportunity, Guess I’ll just book mark this page.
Great blog you have here.. It’s difficult to find high-quality writing like yours these days. I truly appreciate people like you! Take care!!
Pretty! This was a really wonderful post. Thank you for supplying this information.
I was very happy to uncover this great site. I need to to thank you for your time just for this fantastic read!! I definitely appreciated every bit of it and i also have you book-marked to see new stuff on your blog.
This site was… how do I say it? Relevant!! Finally I’ve found something which helped me. Cheers.
Hello! I just want to give you a big thumbs up for your excellent info you’ve got here on this post. I will be returning to your site for more soon.
I must thank you for the efforts you’ve put in penning this site. I’m hoping to check out the same high-grade content from you later on as well. In fact, your creative writing abilities has inspired me to get my own website now 😉
Hi, I do think this is a great web site. I stumbledupon it 😉 I’m going to come back yet again since i have book marked it. Money and freedom is the best way to change, may you be rich and continue to guide other people.
Spot on with this write-up, I truly assume this website needs far more consideration. I’ll most likely be once more to read rather more, thanks for that info.
It’s difficult to find experienced people about this topic, however, you seem like you know what you’re talking about! Thanks
I like it when people get together and share ideas. Great blog, stick with it!
I’m excited to find this site. I want to to thank you for your time for this particularly wonderful read!! I definitely liked every little bit of it and i also have you saved as a favorite to see new information in your blog.
Having read this I thought it was rather enlightening. I appreciate you taking the time and energy to put this short article together. I once again find myself spending a significant amount of time both reading and posting comments. But so what, it was still worthwhile.
Nice post. I learn something new and challenging on websites I stumbleupon every day. It’s always interesting to read articles from other writers and practice a little something from their websites.
Excellent blog you have here.. It’s difficult to find good quality writing like yours these days. I truly appreciate people like you! Take care!!
I seriously love your website.. Pleasant colors & theme. Did you build this site yourself? Please reply back as I’m attempting to create my very own website and would like to learn where you got this from or what the theme is named. Many thanks!
Way cool! Some extremely valid points! I appreciate you penning this write-up and also the rest of the site is also really good.
You are so awesome! I do not believe I’ve truly read through a single thing like this before. So good to find somebody with unique thoughts on this issue. Really.. many thanks for starting this up. This website is one thing that is needed on the web, someone with a little originality.
You made some decent points there. I looked on the internet for additional information about the issue and found most individuals will go along with your views on this website.
I was extremely pleased to discover this website. I want to to thank you for your time for this wonderful read!! I definitely really liked every bit of it and i also have you book marked to look at new information on your web site.
I used to be able to find good information from your articles.
This website was… how do you say it? Relevant!! Finally I have found something which helped me. Thank you.
May I just say what a comfort to discover someone who genuinely understands what they’re talking about on the web. You actually realize how to bring an issue to light and make it important. A lot more people need to check this out and understand this side of the story. I was surprised that you are not more popular because you definitely have the gift.
Greetings! Very helpful advice within this article! It’s the little changes that produce the most important changes. Thanks a lot for sharing!
I blog frequently and I truly appreciate your content. The article has truly peaked my interest. I am going to bookmark your website and keep checking for new information about once per week. I opted in for your RSS feed too.
An interesting discussion is definitely worth comment. I do think that you ought to write more about this subject matter, it may not be a taboo matter but generally folks don’t speak about such subjects. To the next! Kind regards.
Howdy! I simply want to offer you a big thumbs up for your excellent information you have got here on this post. I am returning to your website for more soon.
I became just browsing in some places but got to learn this post. I have to admit that we’re from the hand of luck today or else getting this excellent post to see wouldn’t are actually achievable in my opinion, no less than. Really appreciate your articles.
I used to be able to find good information from your articles.
May I simply say what a comfort to discover an individual who genuinely knows what they’re discussing on the web. You actually understand how to bring an issue to light and make it important. More and more people must look at this and understand this side of the story. I was surprised you aren’t more popular since you certainly have the gift.
Your style is unique compared to other folks I have read stuff from. I appreciate you for posting when you’ve got the opportunity, Guess I’ll just book mark this web site.
In fact, the best thing about this film is how excellent it is as an epic quest film instead of how hilarious it is.
Thank you finding the time to discuss doing this, I believe powerfully concerning it as well as really enjoy reviewing more to do with this process subject matter. Whenever prospective, whilst you attain understanding, exactly what musings posting to your trusty weblog in also material? This is used by i am.
Way cool! Some very valid points! I appreciate you writing this write-up and also the rest of the site is very good.
This is a topic which is near to my heart… Many thanks! Exactly where can I find the contact details for questions?
Hola i would really love to subscribe and read your blog posts !
Excellent blog you have got here.. It’s hard to find high-quality writing like yours these days. I seriously appreciate people like you! Take care!!
This article contains great original thinking. The informational content here proves that things aren’t so black and white. I feel smarter from just reading this.
An intriguing discussion is definitely worth comment. I do think that you need to publish more on this subject matter, it may not be a taboo matter but typically folks don’t speak about these subjects. To the next! Kind regards!
Yikes this definitely takes me back, where are your contact details hmm?
Aw, this was an exceptionally nice post. Taking a few minutes and actual effort to make a really good article… but what can I say… I put things off a lot and don’t manage to get nearly anything done.
This could be the appropriate blog for everyone who hopes to discover this topic. You understand much its virtually difficult to argue together with you (not that When i would want…HaHa). You certainly put a different spin on the topic thats been discussing for several years. Excellent stuff, just fantastic!
Can I simply say what a relief to find somebody that truly understands what they are discussing online. You actually know how to bring a problem to light and make it important. More and more people should look at this and understand this side of your story. I was surprised that you are not more popular given that you surely have the gift.
There is certainly a great deal to know about this subject. I really like all the points you’ve made.
getting a masters degree is of course necessary if you want a wage increase and improvement in your career*
It absolutely was any exhilaration finding your site yesterday evening. We arrived here these days seeking something totally new. I used to be not disappointed. Your opinions on brand new approaches on this factor were helpful as well as an superb help to me personally. Appreciate leaving out time to write out these items and for discussing your thoughts.
It??s nice to definitely locate a blog the spot that the blogger is . Appreciation for making your blog site.
Hello there, I believe your blog could be having internet browser compatibility issues. When I look at your web site in Safari, it looks fine however, if opening in Internet Explorer, it’s got some overlapping issues. I just wanted to give you a quick heads up! Aside from that, excellent site.
There is certainly a great deal to know about this issue. I really like all the points you made.
Great site you’ve got here.. It’s difficult to find quality writing like yours nowadays. I honestly appreciate individuals like you! Take care!!
This site was… how do I say it? Relevant!! Finally I’ve found something that helped me. Many thanks.
A motivating discussion is worth comment. I believe that you should write more about this issue, it might not be a taboo subject but generally people don’t discuss such issues. To the next! Many thanks!
I couldn’t refrain from commenting. Well written!
Great web site you have got here.. It’s difficult to find high quality writing like yours these days. I honestly appreciate people like you! Take care!!
Howdy! I could have sworn I’ve visited this web site before but after looking at a few of the articles I realized it’s new to me. Nonetheless, I’m certainly pleased I came across it and I’ll be book-marking it and checking back frequently.
Pretty! This was an extremely wonderful post. Thank you for supplying this info.
Excellent article! We will be linking to this great post on our website. Keep up the good writing.
Having read this I believed it was really informative. I appreciate you finding the time and effort to put this article together. I once again find myself spending a lot of time both reading and leaving comments. But so what, it was still worthwhile!
bookmarked!!, I really like your site!
Greetings! Very helpful advice in this particular article! It’s the little changes which will make the greatest changes. Thanks for sharing!
Great post. I’m dealing with some of these issues as well..
Great post. I’m dealing with some of these issues as well..
I was able to find good advice from your articles.
That is a very good tip particularly to those new to the blogosphere. Short but very accurate information… Thanks for sharing this one. A must read post!
Having read this I thought it was very informative. I appreciate you finding the time and energy to put this short article together. I once again find myself personally spending a lot of time both reading and leaving comments. But so what, it was still worthwhile.
Spot on with this write-up, I really think this website needs a lot more attention. I’ll probably be returning to see more, thanks for the information!
I could not refrain from commenting. Well written.
I was more than happy to uncover this website. I wanted to thank you for ones time just for this fantastic read!! I definitely liked every part of it and I have you saved to fav to look at new stuff in your site.
Spot on with this write-up, I seriously think this site needs a lot more attention. I’ll probably be returning to read more, thanks for the advice.
You ought to take part in a contest for one of the greatest sites on the internet. I’m going to recommend this site!
Good info. Lucky me I came across your blog by accident (stumbleupon). I’ve book-marked it for later.
This is a good tip particularly to those new to the blogosphere. Short but very precise info… Thank you for sharing this one. A must read article.
After looking into a few of the blog articles on your site, I seriously appreciate your way of writing a blog. I added it to my bookmark site list and will be checking back in the near future. Please check out my website too and tell me how you feel.
There is definately a lot to learn about this issue. I really like all of the points you’ve made.
Hello there! I simply wish to give you a big thumbs up for the great information you have got right here on this post. I will be coming back to your blog for more soon.
Good info. Lucky me I recently found your blog by chance (stumbleupon). I have book-marked it for later.
That is a really good tip especially to those fresh to the blogosphere. Short but very accurate info… Thanks for sharing this one. A must read post.
Good day! I could have sworn I’ve been to your blog before but after looking at some of the articles I realized it’s new to me. Nonetheless, I’m certainly pleased I found it and I’ll be bookmarking it and checking back often.
Having read this I thought it was very informative. I appreciate you spending some time and effort to put this content together. I once again find myself spending way too much time both reading and commenting. But so what, it was still worth it.
This site truly has all the information I needed about this subject and didn’t know who to ask.
I was able to find good info from your content.
Good post. I learn something totally new and challenging on sites I stumbleupon everyday. It will always be useful to read content from other writers and practice a little something from other web sites.
Very nice blog post. I absolutely love this website. Thanks!
You’re so cool! I do not suppose I have read anything like that before. So nice to find someone with unique thoughts on this topic. Really.. thank you for starting this up. This web site is something that’s needed on the web, someone with some originality.
Our conviction is that within the event that you just get the way of life proper, the overwhelming majority of the other stuff, similar to extraordinary consumer administration, or building an incredible lengthy haul brand, or partaking enthusiastic representatives and clients, will occur individually.
Navy modernization efforts are targeted on making their ships extra environment friendly, allowing them to operate with greatly reduced crew compliments.
When you think you can go it alone, consider improving your chances with the help of an experienced professional.
What amounts to a considerable lessening of, or important impediment to competition is often answered through empirical study.
They also feature unique designs and patterns that make them an ideal buy of the season for every fashion loving woman.
While sometimes not required by code, it is very beneficial to retailer pool chemicals in separate, properly ventilated rooms.
Your style is very unique in comparison to other people I’ve read stuff from. Thank you for posting when you have the opportunity, Guess I’ll just book mark this page.
The Benefit Cap may also not apply to you for those who lost your job within the last 9 months or your earnings recently went down.
Good article! We will be linking to this particularly great content on our website. Keep up the good writing.
The employees of Cartmell House for the Aged will likely be honorary pallbearers.
There’s definately a great deal to learn about this topic. I like all the points you have made.
Your style is unique compared to other folks I have read stuff from. Many thanks for posting when you have the opportunity, Guess I will just bookmark this blog.
The Dipper Setup is a critical trading setup developed by Andrew Coles for Gen-4 curves.
Hi, I do believe this is an excellent web site. I stumbledupon it 😉 I will come back yet again since i have bookmarked it. Money and freedom is the best way to change, may you be rich and continue to guide other people.
A situation generally known as hyperhidrosis — extreme sweating — can prolong to the face.
I used to be able to find good advice from your articles.
V-eight within the SS came only with the four-pace this yr.
If after months of advancing, the stock suddenly jumps way up on heavy volume, maybe 25 or more in just a week or two, it will probably drop significantly (climax top).
Also, the guides will’s identity taking care of your property portfolio for your benefit will educate you about any adjustments in laws identified with land, consequently helping you to spare both time and additionally cash before you consent to agreement papers.
In keeping with the reference quoted under, ‘it is said that Nettlestead church owes its monumental stained glass windows to a 15th-century Agincourt veteran who came again from France very impressed with what had already been accomplished with stained glass decoration for churches there.
Throwing in some form of spread is considered one of the simplest.
Work in the garden for 18 minutes.
Glasses containing a excessive proportion of alkali or alkaline earth parts are extra susceptible to corrosion than different glass compositions.
Spot on with this write-up, I really believe this website needs a great deal more attention. I’ll probably be back again to read more, thanks for the info!
Even General Motors didn’t argue with that.
The Worldwide Financial Fund piled on as nicely, urging the U.Ok.
The event ran 23 nights and admission was $74.99.
It may also assist improve your monetary state of affairs and overall well being.
They after all, have so much to do with all this.
This means it is usually possible to compute a unique implied volatility from a given market price for an option.
Or would you like the type of league the place everyone has a glove on one hand and a beer in the opposite?
What’s great about guest blogs is you could embody your bio, profile hyperlinks, and web site URL.
It signifies that by working collectively, you’ll be able to construct a strong foundation of love, assist, and shared achievements.
These are the leaders of societies so ancient and but so secret, most individuals refuse to believe they exist.
Lowering the temperature of the roof itself is a bonus, in fact, but the real financial savings are inside.
Bring your postcards free of charge evaluation.
Nice post. I learn something totally new and challenging on blogs I stumbleupon every day. It’s always interesting to read through content from other authors and use a little something from other sites.
Pretty! This was an incredibly wonderful post. Many thanks for supplying these details.
If you want to make use of these listings, which show up at the top of native searches, then you may want to assert them.
In the retail industry, businesses leverage regression analysis to forecast sales and optimize inventory management.
The boundaries are set by waterfalls, such because the Xingu and Tapajós rivers in Brazil, in addition to very shallow water.
Spot on with this write-up, I actually feel this site needs much more attention. I’ll probably be returning to read more, thanks for the info.
However this explicit commodity also is determined by grains to a small extent, since livestock feed on grains.
In order to manage the inflationary expectations, the central bank increased overnight lending and borrowing rates by 0.25 percentages point each, making it one of the first major central banks to raise rates.
Borel, Brooke. “Vitamin A: Pores and skin Buddy Or Foe?” Huffington Publish.
Carroll, Bob (1980). “The primary Football World Sequence” (PDF).
This was as natural and as inevitable as that the primary railway carriages ought to imitate stage coaches.
I’m very happy to find this page. I need to to thank you for your time due to this wonderful read!! I definitely savored every little bit of it and I have you book-marked to look at new stuff in your site.
Greetings! Very useful advice within this article! It’s the little changes that produce the greatest changes. Thanks a lot for sharing!
Reactive support and resistance are the opposite: they are formed directly as a result of price action or volume behaviour.
I blog often and I seriously appreciate your information. Your article has really peaked my interest. I will bookmark your website and keep checking for new details about once per week. I subscribed to your RSS feed too.
Many areas across the country were fortunate sufficient to be surrounded by family farms the place reasonably priced substances had been comparatively considerable on the market or barter.
It’s the standing of religious jewelry that these days, jewellery primarily based on ‘Om’ has achieved common recognition.
Jacobs, Matthew. “Movie Milestones: ‘Spider-Man’ Tops $100 Million in First Weekend, and 14 Others.” The Huffington Submit.
The federal government is arguably the most lenient lender for scholar assist, but even it has rules about who can get pupil loans.
So if you are an aspiring cryptocurrency content writer wishing to make a mark in technical writing domain, then following these steps will make your efforts more successful.
Accordingly, workers need to intently monitor the amount of publicity they receive and ensure to head for security as that quantity approaches predetermined safety limits.
Meteorologist Lee Robertson believed that the storm was uncommon even amongst different derecho events both for its “duration and intensity”, significantly the wind speeds of 80 to ninety mph (130 to 140 km/h).
These are conducted in three levels, i.e., level 1, 2, and 3 where the candidate’s skills are understood and analyzed.
I was very happy to uncover this web site. I need to to thank you for your time for this fantastic read!! I definitely loved every little bit of it and i also have you book marked to see new stuff on your blog.
Your style is unique in comparison to other folks I have read stuff from. I appreciate you for posting when you’ve got the opportunity, Guess I will just book mark this web site.
Way cool! Some very valid points! I appreciate you writing this post and also the rest of the site is also very good.
Excellent site you’ve got here.. It’s difficult to find high quality writing like yours these days. I honestly appreciate individuals like you! Take care!!
It’s where George Washington wanted to be buried.
Excellent post. I am dealing with many of these issues as well..
Well, with a great 90 minute performance and two targets later, I knew the proper decision had been made and Rosie will go on to be a terrific participant for us.
The definition of resident is in a different way composed in numerous international locations.
There is definately a great deal to know about this topic. I love all of the points you made.
Depressions are generated by the identical factors that cause a recession.
鈥?Divide your investment judiciously between stocks and mutual funds.
Bitze left the company and the team divided between those focussed on the for-profit app and those focussed on the cashless trading Facebook group.
Howell: “Emma M Howell.-Passed away in an area nursing house, Aug 10, 1974.
The Barr marketing campaign filed a lawsuit to stop John McCain and Barack Obama from showing on the ballot in Texas, charging that the candidates’ events did not attain the state’s August 26 deadline to report their nominations to the Secretary of State.
Within the tax reform of 1882 the system of earmarking the income for sure purposes or funds was abolished.
I recently went to an property sale, and was fortunate sufficient to find some vintage movie magazines from the teens and twenties.
There’s definately a lot to find out about this topic. I really like all the points you have made.
This change increased the value of non-renewed bonds to over 鈧?0 billion per month.
The cost of the typical marriage of right now has acquired so excessive; you could suppose about the applying of the phrase “funds”.
These applications will mechanically replace themselves regularly — often even day by day — to guard in opposition to the newest virus mutations on the web.
Dampness slows drying, so it’s really useful that you just lengthen all drying instances if you are making use of varnish in humid or wet weather.
Excellent article! We will be linking to this great post on our site. Keep up the great writing.
The IRS offers an additional exception for folks who are paying for their own medical insurance while unemployed.
Great post! We will be linking to this great article on our site. Keep up the great writing.
Hi! I could have sworn I’ve been to this blog before but after browsing through a few of the posts I realized it’s new to me. Regardless, I’m definitely happy I discovered it and I’ll be book-marking it and checking back often!
I really like reading through an article that can make people think. Also, thank you for allowing for me to comment.
You have made some decent points there. I looked on the internet for more information about the issue and found most individuals will go along with your views on this website.
You are so awesome! I do not believe I’ve truly read through a single thing like that before. So wonderful to find someone with original thoughts on this topic. Really.. thanks for starting this up. This web site is something that is required on the internet, someone with a little originality.
I really love your site.. Great colors & theme. Did you make this website yourself? Please reply back as I’m planning to create my very own website and would love to know where you got this from or exactly what the theme is named. Kudos.
Howdy, I think your website might be having browser compatibility problems. Whenever I look at your website in Safari, it looks fine however, if opening in IE, it’s got some overlapping issues. I merely wanted to provide you with a quick heads up! Besides that, wonderful blog!
Very good info. Lucky me I came across your site by chance (stumbleupon). I have saved it for later.
This was a great read! Your insights are truly helpful and make complex topics easy to understand. Looking forward to more!
The wealth administration corporations offer monetary and funding advisory services to affluent individuals or the ones who are about to contact the boundary of the high-web-price club.
The new Zealand Herald in flip quoted Mr Tuffley as explaining that the market remained provide-constrained on account of low ranges of housing building, with supply shortages being most acute in Auckland and Christchurch.
Banking companies should now take over a keen understanding the necessity to discover, determine, keep monitor of and likewise manage credit rankings risk along with ascertain which they carry adequate capital in opposition to these hazards and they tend to be sufficiently paid for hazards received.
In Jerry Spinelli’s 1990 younger grownup novel Maniac Magee, the protagonists’s dad and mom die when their commuter train plunges into the river.
Rosen Pub Group. pp.
Decorating around these ideas relies upon completely on the way you utilize your kitchen, and the way it is laid out in the context of your private home as a complete.
As a matter of fact, when manufacturers remove the fat from a food product, they sometimes replace it with so much sugar that the fat-free product ends up providing more calories than the original product.
Now go make some cash!
Whereas the number of pit crew members allowed over the wall to service the car stays at seven (eight through the second half of longer races), the total group standing behind a single NASCAR driver can embody more than 30 folks.
Anybody who follows the Nutri/System weight loss plan plan will get a properly-balanced, lowered-calorie diet that, mixed with regular bodily activity, ought to lead to weight reduction of 1 to 2 pounds per week.
The natives develop into very peaceful and they don’t imagine in pacifying a state of affairs by anger.
Property investment is important for people looking to build a secure financial future.
Its trade volume is up to several million contracts per day.
Shakha (White Conch shell bangles), Pola (Purple Coral bangles), and Noa (Gold plated iron bangles) are the three mandatory components of Bengali bridal jewellery.
There are so few things that it is best to keep in mind earlier than booking the marriage decorators.
This website certainly has all the info I wanted about this subject and didn’t know who to ask.
It takes a lot less energy to knock loose one of the “extra” phosphorus electrons because they aren’t tied up in a bond with any neighboring atoms.
An investor has the option to select from fairness, debt or hybrid funds, where their premium can be directed.
That’s where the embalming process comes in.
After years of creating new budgets as your net worth grew more and more positive, you should be a pro at making budgets by now.
Different options like searching packages utilizing region/ country/ city is like including cherry on the cake because it permits the operator to offer totally different varieties to the consumer, which is always mouth watering prospect.
He emphasized his opposition to the Republican Occasion for its positions on the Warfare in Iraq and the USA PATRIOT Act and stood as an advocate of fiscal constraint, demonstrated by his opposition to the Emergency Economic Stabilization Act of 2008.
Kotal thus won his second ISL title, and ATK gained the trophy for a record third time.
Honorary pallbearers can be Moody Pope, Elvin Pope and Jack Funderburk.
Spot on with this write-up, I absolutely believe this website needs far more attention. I’ll probably be back again to read through more, thanks for the advice.
The College of Tennessee Press, Knoxville, Tennessee.
I really like it when people come together and share ideas. Great blog, keep it up.
When I originally commented I seem to have clicked on the -Notify me when new comments are added- checkbox and now every time a comment is added I get 4 emails with the exact same comment. Is there a way you are able to remove me from that service? Appreciate it.
Aw, this was a really nice post. Spending some time and actual effort to generate a superb article… but what can I say… I procrastinate a whole lot and don’t manage to get nearly anything done.
Hi there! I simply would like to offer you a big thumbs up for the excellent info you’ve got right here on this post. I am returning to your web site for more soon.
It’s difficult to find knowledgeable people for this subject, but you seem like you know what you’re talking about! Thanks
Right here is the perfect website for anyone who hopes to understand this topic. You realize so much its almost hard to argue with you (not that I really would want to…HaHa). You definitely put a new spin on a subject that’s been written about for decades. Wonderful stuff, just excellent.
Hello there! I could have sworn I’ve been to this website before but after going through many of the posts I realized it’s new to me. Anyhow, I’m certainly happy I discovered it and I’ll be book-marking it and checking back often.
Excellent blog you have here.. It’s hard to find high quality writing like yours nowadays. I honestly appreciate people like you! Take care!!
This was a great read! Your insights are truly helpful and make complex topics easy to understand. Looking forward to more!
I really like looking through an article that can make people think. Also, thank you for allowing me to comment.
Thanks for sharing. Like your post.Name
Greetings! Very useful advice in this particular article! It’s the little changes which will make the largest changes. Thanks for sharing!
I have to thank you for the efforts you have put in writing this site. I am hoping to see the same high-grade blog posts from you in the future as well. In fact, your creative writing abilities has encouraged me to get my own, personal website now 😉
I blog often and I genuinely thank you for your information. This great article has really peaked my interest. I am going to bookmark your site and keep checking for new information about once a week. I subscribed to your RSS feed as well.
This website was… how do you say it? Relevant!! Finally I’ve found something that helped me. Thanks.
Fantastic post! The information you shared is really valuable and well-explained. Thanks for putting this together!
Good information. Lucky me I ran across your blog by accident (stumbleupon). I have book-marked it for later!
Even right now, in the case of crop failure, Andean highland natives will rely upon chuño to get by means of the difficult occasions.
https://witecgh.mn.co/members/31011269
sex nhật hiếp dâm trẻ em ấu dâm buôn bán vũ khí ma túy bán súng sextoy chơi đĩ sex bạo lực sex học đường tội phạm tình dục chơi les đĩ đực người mẫu bán dâm
You will want ID to generate income on-line.
It’s hard to find well-informed people about this subject, but you seem like you know what you’re talking about! Thanks
Additionally, it will probably assist common nicely-being by aiding within the discount of emotional stress, anxiety, and depression.
After looking over a few of the blog posts on your web site, I really appreciate your way of writing a blog. I book-marked it to my bookmark site list and will be checking back soon. Please visit my web site too and let me know what you think.
Excellent blog you have got here.. It’s difficult to find excellent writing like yours nowadays. I honestly appreciate individuals like you! Take care!!
May I just say what a relief to discover an individual who really knows what they’re discussing on the internet. You actually realize how to bring an issue to light and make it important. More and more people really need to read this and understand this side of the story. I was surprised that you aren’t more popular since you most certainly possess the gift.
I blog quite often and I really appreciate your content. Your article has really peaked my interest. I am going to bookmark your website and keep checking for new details about once a week. I subscribed to your RSS feed as well.
Hi! I simply would like to offer you a big thumbs up for the great information you have right here on this post. I am coming back to your website for more soon.
I blog quite often and I really appreciate your information. This article has truly peaked my interest. I’m going to take a note of your blog and keep checking for new information about once per week. I opted in for your RSS feed as well.
Your style is very unique compared to other folks I’ve read stuff from. I appreciate you for posting when you’ve got the opportunity, Guess I’ll just book mark this site.
Nice post. I learn something totally new and challenging on websites I stumbleupon on a daily basis. It will always be exciting to read content from other authors and use a little something from other web sites.
sex nhật hiếp dâm trẻ em ấu dâm buôn bán vũ khí ma túy bán súng sextoy chơi đĩ sex bạo lực sex học đường tội phạm tình dục chơi les đĩ đực người mẫu bán dâm
I needed to thank you for this fantastic read!! I definitely loved every bit of it. I’ve got you book-marked to look at new stuff you post…
Augusta can be on the 26-12 months-old’s thoughts and after three missed cuts in three starts, there is actually plenty of room for enchancment.
History of Greed: Monetary Fraud from Tulip Mania to Bernie Madoff.
But it surely implies that not each airplane will get cut up into little pieces, because the company wants to maintain some intact enough to rented out as props.
Though some folks find that their pores and skin clears up after adolescence — pimples disappear; that acquainted oily sheen offers technique to a wholesome glow — other individuals need to deal with acne and oily pores and skin into middle age.
Speaking to The Solar, a source claimed the dancer acquired frighteningly indignant at the previous Love Island star.
Moreover her mother and father, she is survived by grandparents Barry and Margaret Beck of Sioux Metropolis, Ronald and Joan Breining of Elk Horn and Daniel and Jean Bieker of Harlan.
Beyond this, Bonds served as the State Commissioner of Education for Arkansas and as Dwight D. Eisenhower’s Chief of the U.S.
Dealing with NIFTY Future and Bank NIFTY Future, requires the traders to maintain a pointy eye on the every fluctuating costs of the stocks.
Often daily interest will be calculated on a business overdraft.
Hello, I do believe your blog could be having internet browser compatibility problems. When I take a look at your web site in Safari, it looks fine but when opening in I.E., it has some overlapping issues. I simply wanted to provide you with a quick heads up! Aside from that, excellent blog.
you got a very excellent website, Sword lily I found it through yahoo.
there are many sites on the internet that offers downloadable movies, some are even offering the latest movies.
Limitations have been put in place in recent a long time because of litter and human waste issues, and makes an attempt to encourage cost for camping by directing vacationers to industrial services.
Good day! I could have sworn I’ve visited your blog before but after browsing through a few of the posts I realized it’s new to me. Anyhow, I’m definitely happy I came across it and I’ll be bookmarking it and checking back frequently!
Selecting a guaranty is not a simple decision, either.
you can also look for ebay for some cheap wedding favors, i prefer to customize my wedding favors~
Barbie vamped onto the toy scene in 1959, the creation of Ruth Handler and her husband Elliot, who together with Harold Matson based the Mattel toy firm.
Your local police department might have a special division assigned to fraud instances.
Good article! We are linking to this particularly great post on our site. Keep up the good writing.
Also, as more and more businesses in various industries are adopting BTC, you can see after a couple of years that this digital currency has caught everyone.
The redesigned 2007 Sebring is an enormous enchancment over the 2001-2006 era, and prices are engaging, with properly-geared up V6 models beginning under $23,000.
Utilizing the BR rip-off, Mehta took the value of ACC from ₹200 to ₹9000 in a brief span of time.
I’m impressed, I must say. Seldom do I come across a blog that’s both equally educative and interesting, and let me tell you, you have hit the nail on the head. The issue is something which too few people are speaking intelligently about. I’m very happy that I found this in my search for something concerning this.
Many people suppose that now we have some secret apparatus by which we can squeeze glass all of a sudden into these kinds, however it’s not so.
Preparations are under the direction of Mission Park Funeral Chapels North of San Antonio.
I have to thank you for the efforts you’ve put in penning this website. I’m hoping to view the same high-grade blog posts by you in the future as well. In fact, your creative writing abilities has inspired me to get my own site now 😉
Companies, in today’s scenario have a stronger need to convert data into real-time opportunities.
Chances are, you’re reading this article on a version of Microsoft’s Internet Explorer.
I quite like looking through a post that can make people think. Also, thanks for allowing me to comment.
Hello! I just would like to offer you a huge thumbs up for the excellent information you’ve got right here on this post. I’ll be returning to your blog for more soon.
1. Give them less food – Infants and toddlers like to play with their meals and when we serve them a big serving to of desk foods, it literally offers them that much more ammunition.
This is because you never know what you will run into while on a backpacking vacation; heavy rains, sudden snowfall, rockslides, altitude sickness, aches, pains and personal injury or accident.
Way cool! Some extremely valid points! I appreciate you writing this article and the rest of the website is also very good.
An outstanding share! I have just forwarded this onto a co-worker who has been doing a little homework on this. And he actually bought me dinner because I found it for him… lol. So let me reword this…. Thanks for the meal!! But yeah, thanks for spending some time to talk about this matter here on your web page.
Because at first it was brought by Turkey to Europe from the mines of Khorosan of Persia (now Iran) and the Sinai Peninsula in Egypt.
There’s one other use of learning to clarify issues a bit; if you end up requested questions and you don’t know all the words, it’s a sort of a affirmation that you simply understood, or in case you didn’t you just changed the subject for whatever reason: “so, if I used to be to select a favourite colour in a board game,…
I needed to thank you for this wonderful read!! I certainly enjoyed every little bit of it. I have got you book marked to look at new stuff you post…
When I initially commented I seem to have clicked on the -Notify me when new comments are added- checkbox and from now on every time a comment is added I receive four emails with the same comment. Is there a means you can remove me from that service? Cheers.
Great web site you’ve got here.. It’s hard to find high-quality writing like yours nowadays. I really appreciate people like you! Take care!!
Every service isn’t counted as an application.
Woods, Ben (April 16, 2013).
I love it when individuals come together and share views. Great site, stick with it!
Market Fluctuations: The value of the pledged securities can fluctuate, affecting the LTV ratio and potentially leading to margin calls.
Bell, his wife Ruth and their children, Don and Judy cared for the little bear with the help of local veterinarian Dr Edwin J. Smith.
I couldn’t refrain from commenting. Perfectly written!
Everyone loves it when folks come together and share thoughts. Great website, stick with it.
You have made some decent points there. I checked on the net for more information about the issue and found most people will go along with your views on this website.
I am often to blogging and i also genuinely appreciate your website content continuously. The content has really peaks my interest. My goal is to bookmark your web site and keep checking for brand new info.
Company occasions are available all sizes and shapes; so one can host a big-sized occasion at a convention or a small event as an intimate business affair.
The place is worldwide famend as the location the place Buddha acquired Bodhimandala, means Enlightenment.
Thanks for the post, was an interesting read. Curious as to how you came about that solution…
They dwell with their grownup daughter and so need to make a non-dependant deduction of £91.47.
What your stating is absolutely correct. I know that everyone have to say the identical matter, but I just believe that you place it in a way that everyone can understand. I also love the photographs you put in the following. They match so effectively with what youre attempting to say. Im confident youll get to so many individuals with what youve acquired to say.
Can I just say what a relief to get an individual who really knows what theyre talking about on the net. You unquestionably know how you can bring an problem to light and make it important. A lot more individuals need to read this and realize this side of the story. I cant believe youre not additional common simply because you definitely have the gift.
On July 3, Lebanon County grew to become the final county to enter the inexperienced phase.
Nice post. I understand some thing harder on diverse blogs everyday. It will always be stimulating to read content from other writers and rehearse something from their website. I’d opt to apply certain with the content in my small weblog whether you don’t mind. Natually I’ll offer you a link in your internet blog. Many thanks for sharing.
I really like reading a post that can make people think. Also, thank you for allowing me to comment.
I like it when individuals come together and share ideas. Great site, continue the good work.
You have made some really good points there. I looked on the net to find out more about the issue and found most people will go along with your views on this site.
healthier hair is of course mainly due to genetics but food supplementation can also help you get it`
Lack of motivation is one of the top train killers, however joining a sports membership may also help.
However Luckett chimed out, “Heads is the decision. He said ‘heads.'” The coin, after all, landed on tails, giving Detroit the primary crack at scoring.
Greetings! This is my first visit to your blog! We are a collection of volunteers and starting a new initiative in a community in the same niche. Your blog provided us useful information to work on. You have done a marvellous job!
Russia is the most important nation in Asia.
It is crucial to deal with mental well being issues as a part of an general method to healthcare.
Nice post. I learn something new and challenging on blogs I stumbleupon on a daily basis. It will always be interesting to read articles from other writers and use a little something from other sites.
What i don’t realize is in reality how you are not really much more well-preferred than you might be right now. You’re very intelligent. You realize thus considerably in relation to this subject, produced me individually imagine it from numerous numerous angles. Its like women and men are not interested unless it is one thing to accomplish with Lady gaga! Your own stuffs excellent. Always care for it up!
I am usually to blogging and i actually appreciate your content. The article has really peaks my interest. I’m going to bookmark your site and keep checking for brand new information.
After looking into a handful of the articles on your web page, I seriously appreciate your way of blogging. I bookmarked it to my bookmark webpage list and will be checking back soon. Take a look at my web site too and let me know what you think.
What occurs should you by accident crack a mirror?
Excellent read, I just passed this onto a friend who was doing some research on that. And he actually bought me lunch because I found it for him smile Thus let me rephrase that: Thank you for lunch!
Justin Bieber is quite talented at a very young age, he sings good too,.
Greetings! Very helpful advice in this particular article! It’s the little changes that produce the most important changes. Thanks a lot for sharing!
Good post. I learn something totally new and challenging on blogs I stumbleupon every day. It will always be interesting to read articles from other authors and use something from other web sites.
I’m impressed, I have to admit. Genuinely rarely will i encounter a blog that’s both educative and entertaining, and without a doubt, you could have hit the nail around the head. Your notion is outstanding; the issue is something which inadequate people are speaking intelligently about. I will be very happy we came across this around my look for some thing in regards to this.
i am looking for gadget reviews this december coz i wanna buy some of the latest gadgets for my girlfriend*
The entire constellations, whereas sectors of the ecliptic, are held throughout the Zodiac, hence their title.
I really like it when people come together and share ideas. Great blog, continue the good work!
Divide up a large bag of chips or box of cookies into particular person servings and store them in reclosable plastic luggage.
I would like to show my gratitude for your kindness for people that absolutely need help with this particular content. Your very own dedication to getting the message all-around became particularly good and have in most cases encouraged girls much like me to achieve their goals. This informative guideline implies so much to me and much more to my office colleagues. Thanks a lot; from each one of us.
I’ve been exploring for a bit for any high quality articles or blog posts on this sort of area . Exploring in Yahoo I at last stumbled upon this web site. Reading this information So i am glad to show that I have a very good uncanny feeling I found out exactly what I needed. I so much for sure will make certain to do not fail to remember this website and give it a glance on a constant.
Hiya very nice website!! Man .. Excellent .. Amazing .. I’ll bookmark your web site and take the feeds also?I am glad to search out so many helpful info right here within the submit, we want work out more strategies in this regard, thank you for sharing. . . . . .
This website was… how do you say it? Relevant!! Finally I’ve found something that helped me. Thank you.
I was recommended this web site by my cousin. I’m not sure whether this post is written by him as nobody else know such detailed about my trouble. You’re amazing! Thanks!
When I originally commented I clicked the -Notify me when new comments are added- checkbox now every time a comment is added I get four emails concentrating on the same comment. Can there be by any means you are able to remove me from that service? Thanks!
sex nhật hiếp dâm trẻ em ấu dâm buôn bán vũ khí ma túy bán súng sextoy chơi đĩ sex bạo lực sex học đường tội phạm tình dục chơi les đĩ đực người mẫu bán dâm
That is a good tip especially to those fresh to the blogosphere. Brief but very accurate info… Appreciate your sharing this one. A must read post.
Does it fit like a measurement 7 1/2, or more like a size 7 or 8?
Hello there! This article could not be written any better! Looking through this post reminds me of my previous roommate! He continually kept preaching about this. I will forward this post to him. Fairly certain he’s going to have a very good read. Thanks for sharing!
I enjoyed seeing this, do you have a Facebook page for this site?
Woah this is just an insane amount of info, must of taken ages to compile so thank you so much for just sharing it with all of us. If your ever in any need of related info, perhaps a bit of coaching, seduction techniques or just general tips, just check out my own site!
There are some attention-grabbing time limits in this article however I don’t know if I see all of them center to heart. There’s some validity however I will take maintain opinion till I look into it further. Good article , thanks and we wish extra! Added to FeedBurner as properly
That’s not intrinsically good or dangerous-I feel it’s each, in several conditions-nevertheless it shapes the dialog about trade-offs.
Any carbon-based substance will fit the bill as a feedstock.
But being away from dwelling does not imply having to concern the wilderness.
He’s a Fox who was banished to turn into smoke and was entrusted in Sa-Eun’s care because of lots of bad errors that he dedicated in the past.
Some firms provide matching contributions as effectively, permitting you to earn much more.
Many begin to see remote work as not only a crucial consequence, however slightly as a brand new alternative to diversify their workforce, improve worker productivity and reduce some cost.
Public debt or borrowing refers to the federal government borrowing from the public.
Good – I should definitely pronounce, impressed with your web site. I had no trouble navigating through all tabs and related information ended up being truly easy to do to access. I recently found what I hoped for before you know it at all. Quite unusual. Is likely to appreciate it for those who add forums or something, web site theme . a tones way for your customer to communicate. Excellent task.
This is actually a good impacting view on this specific idea. And I’d like you to know that I’m really pleased you shared your feelings and information and I discovered that i believe I agree. I genuinely admire your very clear writing additionally , the work may possibly have invested writing this article. A great many thanks yous for this sound work additionally very good luck with the website, I will be looking forward to new subjects within the future.
Its like you read my mind! You seem to know a lot about this, like you wrote the book in it or something. I think that you could do with some pics to drive the message home a little bit, but other than that, this is fantastic blog. An excellent read. I will definitely be back.
Good day. Very cool website!! Guy .. Beautiful .. Amazing .. I will bookmark your blog and take the feeds additionally…I’m glad to find numerous useful information right here within the article. Thanks for sharing.
Hey, very informative blog post! Pleasee continue this awesome work.
It truly is how you can tell if a is operating or otherwise.
Hey there ~ Great stuff, will definitely come back very soon ! My AV
I’d ought to check with you here. Which isn’t some thing I usually do! I quite like reading an article which will make people feel. Also, thank you permitting me to comment!
Thanks, I’ve been searching for info about this subject matter for ages and yours is the best I have located so far.
An fascinating discussion is worth comment. I believe that you need to write read more about this topic, may possibly not be described as a taboo subject but generally everyone is too few to chat on such topics. An additional. Cheers
I can’t appear to locate your contact us page, I really think you need to make your website layout more straightforward to navigate via. who else agrees?
It’s nearly impossible to find knowledgeable men and women about this topic, however, you appear to be you know what you’re referring to! Thanks
I’d should talk to you here. Which is not some thing I do! I quite like reading a post which will make people believe. Also, many thanks permitting me to comment!
I usually dont commonly post on many another Blogs, nevertheless Thank you continue the astonishing work. Ok unfortunately its time to get to school.
I found your weblog site on google and verify a number of of your early posts. Proceed to maintain up the very good operate. I simply extra up your RSS feed to my MSN News Reader. Seeking ahead to reading extra from you in a while!…
Way cool! Some very valid points! I appreciate you writing this post plus the rest of the site is really good.
It was very well authored and easy to get the picture. Unlike additional blogs I have read which are really not good. I also found your posts very interesting.
Nice post. I learn something tougher on different blogs everyday. It will always be stimulating to study content off their writers and exercise a specific thing from their store. I’d would prefer to use some with all the content in my blog regardless of whether you don’t mind. Natually I’ll provide a link for your web weblog. Thank you for sharing.
Can I say that of a relief to uncover somebody that truly knows what theyre preaching about on the net. You actually realize how to bring a concern to light making it essential. The diet have to check out this and can see this side with the story. I cant think youre no more popular when you certainly hold the gift.
Geoffrey Upcott Farrant, CBE.
I’m often to blogging and i in actual fact respect your content. The piece has actually peaks my interest. I’m going to bookmark your content and preserve checking for brand new information.
Howdy! I know this is kinda off topic nevertheless I’d figured I’d ask. Would you be interested in exchanging links or maybe guest authoring a blog post or vice-versa? My site addresses a lot of the same subjects as yours and I think we could greatly benefit from each other. If you are interested feel free to send me an email. I look forward to hearing from you! Terrific blog by the way!
Good Post, I am a big believer in placing comments on weblogs to help the blog writers know that they’ve added something advantageous to the world wide web!
I discovered your blog post site on google and appearance many of your early posts. Always maintain on the really good operate. I just now extra increase your Feed to my MSN News Reader. Seeking forward to reading much more within you down the road!…
You really should indulge in a tournament for example of the most useful blogs on the internet. I will suggest this site!
Sci-Fi is the best, i love sci-fi movies, books and stuffs like that. I am a man of science that is why i love it;
This is a topic that is close to my heart… Thank you! Exactly where can I find the contact details for questions?
yes, cooll this post, i am verry interest (désolé, je suis francais, je parle mal anglais)
Can I just say what a reduction to find somebody who truly is aware of what theyre speaking about on the internet. You definitely know the way to bring an issue to gentle and make it important. More folks must read this and understand this side of the story. I cant consider youre no more standard since you undoubtedly have the gift.
An insightful blog post right there mate ! Thanks for the post .
An interesting discussion is worth comment. I do believe that you need to write more about this subject, it may not be a taboo matter but generally people don’t talk about such subjects. To the next! Cheers!
Introducing to you the most prestigious online entertainment address today. Visit now to experience now!
Crew remembers Nazi Germany’s Prinz Eugen as a “fortunate ship”: The German heavy cruiser Prinz Eugen (pictured) helped the Bismarck sink the HMS Hood on Could 24, 1941, then managed to escape the British search that led to the Bismarck’s destruction on Could 27.
In my opinion, enhancing vitamin means to do with individual data is without a doubt sooner or later as many as the actual to bring a.
I’m not that much of a internet reader to be honest but your blogs really nice, keep it up! I’ll go ahead and bookmark your website to come back down the road. Many thanks
I?ve recently started a web site, the info you offer on this website has helped me tremendously. Thank you for all of your time & work.
I was able to find good info from your articles.
This is a topic that is near to my heart… Many thanks! Where are your contact details though?
Glo-Lux perhaps? These are primarily useless bulbs.
Hey, Could I grab this post image and make use of that on my personal blog page?
Awesome blog, I’m going to spend more time researching this topic
sex nhật hiếp dâm trẻ em ấu dâm buôn bán vũ khí ma túy bán súng sextoy chơi đĩ sex bạo lực sex học đường tội phạm tình dục chơi les đĩ đực người mẫu bán dâm
Some are hand-held. Others are worn on the wrist like a watch.
I’m impressed, I have to admit. Actually rarely can i encounter a blog that’s both educative and entertaining, and without a doubt, you’ve got hit the nail to the head. Your concept is outstanding; ab muscles an issue that not enough people are speaking intelligently about. I will be delighted that we stumbled across this within my seek out something about it.
This website is actually a walk-through you discover the knowledge you desired relating to this and didn’t know who to inquire about. Glimpse here, and you’ll definitely discover it.
You have noted terribly attention-grabbing points ! ps good net site here.
sex nhật hiếp dâm trẻ em ấu dâm buôn bán vũ khí ma túy bán súng sextoy chơi đĩ sex bạo lực sex học đường tội phạm tình dục chơi les đĩ đực người mẫu bán dâm
I love this info presented and possesses given me some type of resolve forpersistance to succeed i really enjoy seeing, so sustain the excellent work.
I really appreciate this post. I have been looking all over for this! Thank goodness I found it on Bing. You have made my day! Thanks again
F*ckin’ remarkable things here. I’m very glad to see your post. Thanks so much and i am taking a look ahead to touch you. Will you please drop me a mail?
Aw, this was an exceptionally good post. Taking a few minutes and actual effort to generate a very good article… but what can I say… I put things off a whole lot and never manage to get nearly anything done.
I have to say which i slightly disagree, but no biggie.
hello, i came in to learn about this topic, thanks alot. will put this site into my bookmarks.
This could be the appropriate blog for wants to discover this topic. You are aware of much its virtually tough to argue along (not that I actually would want…HaHa). You definitely put a new spin on a topic thats been written about for some time. Great stuff, just wonderful!
You made some good points there. I checked on the internet for additional information about the issue and found most people will go along with your views on this website.
This is a topic that’s close to my heart… Take care! Exactly where can I find the contact details for questions?
Hey i Love your work i really appreciate that. Also take a look at our special Gym flooring dubai
It’s rare to find well-informed people on this kind of issue, however you sound like you know very well what you’re speaking about! Kudos
Undeniably believe that which you said. Your favorite reason seemed to be on the net the simplest thing to be aware of. I say to you, I certainly get annoyed while people think about worries that they plainly don’t know about. You managed to hit the nail upon the top and defined out the whole thing without having side-effects , people could take a signal. Will probably be back to get more. Thanks
I am glad to be a visitant of this stark website ! , appreciate it for this rare info ! .
Nice one for discussing the knowledge. I recently uncovered the info tremendously valuable.
the Gilmore Girls are really gorgeous, and that is the main reason why i watch that tv show~
You should take part in a contest personally of the highest quality blogs on the internet. I’ll recommend this great site!
Introducing to you the most prestigious online entertainment address today. Visit now to experience now!
Hello there, I discovered your website by way of Google whilst searching for a related matter, your website got here up, it looks good. I’ve bookmarked it in my google bookmarks.
I would really love to guest post on your blog..**.`
The when Someone said a weblog, I am hoping it doesnt disappoint me as much as this one. I mean, I know it was my option to read, but I really thought youd have some thing intriguing to mention. All I hear is a number of whining about something you could fix if you ever werent too busy interested in attention.
I’ve also been meditating on the identical idea personally lately. Happy to see somebody on the same wavelength! Nice article.
Spot up with this write-up, I seriously feel this website requirements much more consideration. I’ll more likely once again to see a lot more, many thanks for that information.
I really like your writing style, good information, appreciate it for putting up : D.
Introducing to you the most prestigious online entertainment address today. Visit now to experience now!
Hello! Do you know if they make any plugins to assist with
Search Engine Optimization? I’m trying to get my website to rank for some targeted keywords but I’m not
seeing very good success. If you know of any please share.
Cheers! You can read similar art here: Change your life
An fascinating discussion might be priced at comment. There’s no doubt that that you can write on this topic, it might be considered a taboo subject but normally folks are too few to speak on such topics. To another. Cheers
i really hate it when my sebaceous gland are producing too much oil, it really makes my life miserable,
nicotine can really make you an addict, stay away from cigarettes in the first place::
I do believe all the ideas you have introduced to your post. They are very convincing and can definitely work. Still, the posts are very quick for starters. May just you please lengthen them a little from subsequent time? Thanks for the post.
Top-notch post it is surely. My friend has been awaiting for this content.
???? ?????? ?????? ??? ??????? ?????????? ?? ????? ????? ????? ?? ????? ??????
Hello there! Cheering for the vibe—it’s superb. In fact, the aesthetics brings a brilliant touch to the overall vibe. You rock!
You might be websites successful individuals, it comes effortlessly, therefore you also earn you see, the jealousy of all the ones a lot of journeymen surrounding you could have challenges within this challenge. motor movers
My brother recommended I would possibly like this website. He used to be entirely right. This submit actually made my day. You cann’t imagine just how much time I had spent for this information! Thank you!
Your blog is one of a kind, i love the way you organize the topics.:,”~
Yay google is my world beater helped me to find this great web site ! .
I am usually to blogging we really appreciate your website content continuously. This content has truly peaks my interest. Let me bookmark your site and maintain checking achievable data.
Introducing to you the most prestigious online entertainment address today. Visit now to experience now!
I just added this blog site to my feed reader, excellent stuff. Cannot get enough!
I am often to blogging and i truly appreciate your website content continuously. This article has truly peaks my interest. I’m going to bookmark your web site and maintain checking for first time information.
I’m not against the agree with the things you suggested.
Salutations! Embracing the mood—it’s amazing. In fact, the design brings a brilliant touch to the overall vibe. Super cool!
It’s nearly impossible to find well-informed people about this topic, however, you seem like you know what you’re talking about! Thanks
Hello! .order viagra internet , order cialis , tadalafil , buy cheap viagra , ,
But wanna tell that this is invaluable , Thanks for taking your time to write this.
botox can be very helpful with skin wrinkles and it can also help treat bruxism..
Beging with the entire wales well before just about any planking. Our own wales can easily compilation of calculated forums those thickness analysts could be the similar to some of the shell planking along with more significant damage so that they project after dark planking. planking
There are some fascinating cut-off dates in this article however I don’t know if I see all of them heart to heart. There’s some validity but I will take hold opinion until I look into it further. Good article , thanks and we wish extra! Added to FeedBurner as well
Where by have you found the resource for the following post? Awesome studying I have subscribed to your site feed.
Introducing to you the most prestigious online entertainment address today. Visit now to experience now!
Preferably,when you gain knowledge,are you able to mind updating your website with an increase of information? It is very ideal for me.
It’s not easy, but i believe you just have to be objective about your self and realize that occasionally when somebody is criticizing they are only giving
Pretty section of content. I just stumbled upon your blog and in accession capital to assert that I acquire actually enjoyed account your blog posts. Anyway I’ll be subscribing to your augment and even I achievement you access consistently fast.
I am extremely impressed together with your writing abilities
and also with the structure for your blog. Is that this a paid theme or did you customize it your self?
Either way stay up the nice quality writing, it is uncommon to look a
great weblog like this one these days. Instagram Auto follow!
Items like sandbags, lumber and water pumps could also be reimbursable up to $1,000.
Hey there! I just wish to give you a big thumbs up for the excellent information you have right here on this post. I will be returning to your web site for more soon.
However, recently, the pattern is to depart as little a mark as potential on our surroundings.
The caliper information pins are two spherical metallic pins on each brake caliper the place the brake piston assembly sits.
This is a great blog” and i want to visit this every day of the week “
Thank you for your entire effort on this web site. Betty delights in working on research and it’s easy to see why. Many of us know all about the compelling medium you deliver vital tricks through your blog and in addition strongly encourage response from visitors about this area while our favorite simple princess has been discovering a whole lot. Have fun with the remaining portion of the new year. You are always performing a remarkable job.
Wow, superb blog layout! How lengthy have you ever been blogging for? you make blogging glance easy. The whole glance of your website is fantastic, well the content material!
Considine, J.D. (4 October 1994).
The Herald-Information. September 21, 1935.
Henry James Blighton. For political providers.
I’m not that much of a internet reader to be honest but your sites really nice, keep it up! I’ll go ahead and bookmark your website to come back later. All the best
I bookmared your site a couple of days ago coz your blog impresses me.;`~”-
Took me awhile to read all the comments, but I really enjoyed the article. It proved to be very helpful to me and I am sure to all the commenters here! It’s always nice when you can not only be informed, but also entertained! I’m sure you had fun writing this article.
Step 5: Take the bead out of the middle of the flame to its cooler edge.
Such a well written post.. Thnkx for sharing this post !! Also you can check my ??
When visiting blogs, i always look for a very nice content like yours ,
I enjoy what you guys are usually up too. Such clever work and reporting! Keep up the wonderful works guys I’ve incorporated you guys to blogroll.
They have a great range of holistic health products.
cost of lisinopril pills
A global name with a reputation for excellence.
Unquestionably believe that which you stated. Your favorite justification appeared to be on the internet the easiest thing to be aware of. I say to you, I certainly get irked while people consider worries that they just don’t know about. You managed to hit the nail upon the top and also defined out the whole thing without having side effect , people can take a signal. Will probably be back to get more. Thanks
very nice post, i surely love this site, carry on it
You’ve got a good blog there keep it up. I’ll be watching out for most posts.
Breaking down borders with every prescription.
how can i get cipro
Best and news about drug.
After examine a couple of of the weblog posts in your website now, and I truly like your manner of blogging. I bookmarked it to my bookmark website list and might be checking back soon. Pls take a look at my website as effectively and let me know what you think.
There a few fascinating points with time in this article but I do not determine if I see they all center to heart. There exists some validity but Let me take hold opinion until I investigate it further. Very good article , thanks so we want far more! Included in FeedBurner too
assisted living is nice if you got some people and a home that cares very much to its occupants;;
An intriguing discussion is worth comment. I believe that you should write more about this subject, it may not be a taboo subject but usually folks don’t talk about these topics. To the next! All the best!
There’s certainly a lot to learn about this subject. I love all of the points you made.
There are certainly many details like this to take into consideration. It really is a excellent specify bring up. I provide the thoughts above as general inspiration but clearly there are actually questions just like the one you bring up where the most important factor might be doing work in honest good faith. I don?t know if best practices have emerged around items like that, but I know that the job is clearly referred to as a good game. Both boys and girls notice the impact of just a moment’s pleasure, throughout their lives.
Needed to put you that little remark to say thank you over again for your marvelous tricks you’ve contributed on this site. This has been wonderfully open-handed with people like you to convey freely what exactly a number of people might have offered as an e-book to end up making some money for themselves, even more so considering the fact that you could possibly have tried it if you considered necessary. The secrets additionally acted to provide a good way to be certain that other people online have the same keenness just like my personal own to understand lots more in terms of this matter. I’m sure there are lots of more pleasant periods up front for folks who check out your website.
you use a fantastic blog here! do you wish to cook some invite posts in this little blog?
Leading with compassion on a global scale.
can you get generic cipro for sale
They provide a world of health solutions.
A pharmacy that prides itself on quality service.
can i order cytotec prices
Their health seminars are always enlightening.
Their dedication to global health is evident.
how to buy cipro without prescription
Prescription Drug Information, Interactions & Side.
Introducing to you the most prestigious online entertainment address today. Visit now to experience now!
Salutations! Grateful for the composition—it’s remarkable. In fact, this post brings a great touch to the overall vibe. Nice work!
How do I start to learn how to Hip Hop dance?
As soon as I noticed this website I went on reddit to share some of the love with them.
Many people feel, mission coupled with dream fantastic produce legitimate Ji.
It should have a minimal matrix sample.
Lieutenant Commander John Francis Kennett.
If you are looking for a show-stopping outfit that embodies drama, you’ll be able to never go wrong with leather-based.
As a result of both earnings and substitution impact spending on those goods will increase.
James White, a Republican member of the Texas Home of Representatives, sponsored the invoice in an effort to alleviate lengthy traces and overcrowding on the Division of Public Providers (DPS) facilities, which administer driving exams and problem licenses.
Know that, when heat it is utilized over an space of acute injury, lively inflammation or swelling can get worse, as heat causes vasodilatation (opening of the small blood vessels), the alternative of ice.
A fascinating discussion is definitely worth comment. I do believe that you ought to write more on this topic, it may not be a taboo matter but generally folks don’t discuss these issues. To the next! Many thanks.
Next time I read a blog, I hope that it doesn’t disappoint me just as much as this one. After all, Yes, it was my choice to read, however I truly thought you would have something interesting to talk about. All I hear is a bunch of complaining about something that you could fix if you weren’t too busy seeking attention.
I just love to read new topics from you blog.,*-’-
Most people have overlooked this foremost concept. When you’re trying to find started with a project this really is the information and facts that is required. Please stick to your writing.
This is a topic which is close to my heart… Best wishes! Where can I find the contact details for questions?
Next time I read a blog, Hopefully it won’t fail me as much as this particular one. After all, Yes, it was my choice to read, but I actually thought you would have something helpful to talk about. All I hear is a bunch of crying about something you can fix if you were not too busy looking for attention.
I would like to thank you for the efforts you have put in writing this website. I’m hoping the same high-grade site post from you in the upcoming as well. Actually your creative writing abilities has encouraged me to get my own website now. Actually the blogging is spreading its wings quickly. Your write up is a good example of it.
Hi there! This post couldn’t be written any better! Reading through this post reminds me of my previous room mate! He always kept talking about this. I will forward this page to him. Pretty sure he will have a good read. Thanks for sharing!
Nếu bạn nhận được tin nhắn lạ từ vinacomintower.com, hãy xóa ngay!
Love your site. have you got the theme you used that you can share?
I’m really impressed together with your writing talents and also with the
layout to your weblog. Is this a paid topic or did you modify it yourself?
Either way keep up the nice high quality writing, it’s rare to
look a great blog like this one nowadays. Lemlist!
You need to take part in a contest for one of the greatest blogs on the internet. I most certainly will highly recommend this site!
One sure sign of a scam is a return that exceeds 13 or something that will give you a high return on a permanent basis.
For an current restaurant, the down payment is decrease at round 25.
Abidjan, the economic capital, is a hub of French-speaking West African culture and business.
Spot lets start work on this write-up, I honestly feel this web site needs considerably more consideration. I’ll probably be again to see considerably more, thank you that info.
Kind a special occasion planning committee and take a look at to make use of your established disaster workforce as much as attainable, as these people have worked collectively before, so it needs to be easier to create a disaster management plan for the massive occasion.
That was true when EVs first hit the market, but there have been main advancements in battery life since.
There is certainly a lot to know about this subject. I really like all of the points you have made.
The first thing I thought was, what a very good cause the cash raised would help.
Police officers have been instructed that they didn’t have to increase the variety of tickets they write under this plan, but they had to spend extra time hanging out in courtroom to defend the tickets (instead of patrolling or partaking in other crime-stopping police duties).
Fantastic entry. I appreciate the time you invested to offer such beneficial content. It was clear and highly educational.
Well-packaged. High-quality product.
living room furnitures that are light colored can make your living room look larger“
I’m really inspired along with your writing skills as well as with the structure to your weblog. Is this a paid topic or did you customize it your self? Either way stay up the nice quality writing, it is rare to peer a nice blog like this one these days. I like prometheus-research.com ! Mine is: HeyGen
This is a topic that is near to my heart… Best wishes! Where can I find the contact details for questions?
I used to be able to find good info from your blog articles.
Thank you, I have been hunting for information about this topic for ages and yours is the best I’ve located so far.
Loved this!
This was super helpful.
Appreciated the insight in this article. It’s highly well-researched and full of beneficial information. Great work!
Wonderful post! We are linking to this particularly great post on our website. Keep up the good writing.
Oh my goodness! Impressive article dude! Many thanks, However I am encountering issues with your RSS. I don’t understand the reason why I am unable to join it. Is there anybody else having identical RSS issues? Anyone that knows the answer will you kindly respond? Thanx.
Greetings! Very useful advice within this post! It is the little changes that produce the biggest changes. Thanks for sharing!
Totally agree with this.
Really liked it with the effects. Exceeded expectations.
Loved this post. It’s very comprehensive and filled with valuable information. Fantastic effort!
Good blog you have here.. It’s hard to find high quality writing like yours these days. I seriously appreciate people like you! Take care!!
So well written.
I blog frequently and I seriously thank you for your content. The article has truly peaked my interest. I’m going to take a note of your site and keep checking for new information about once a week. I opted in for your RSS feed too.
You’ve brought up an excellent point here, and it’s one that I read about in a recent post on https://ho88.news/. Their insights further back up your argument.
I think you’ve made an excellent point, and I agree with it wholeheartedly. I came across a similar viewpoint on Fc88, and it added valuable insight to my understanding of the issue.
You’ve got talent!
I am glad to be a browser of this fantastic weblog ! , thankyou for this rare info ! .
Oh my goodness! Incredible article dude! Many thanks, However I am having issues with your RSS. I don’t understand the reason why I cannot subscribe to it. Is there anybody else getting similar RSS problems? Anybody who knows the solution will you kindly respond? Thanx!
Spot on!
*you have a great blog here! would you like to make some invite posts on my blog?
Hiya, I’m really glad I have found this info. Today bloggers publish just about gossips and web and this is actually irritating. A good site with exciting content, that is what I need. Thanks for keeping this web-site, I will be visiting it. Do you do newsletters? Can’t find it.
whoah this blog is great i love reading your articles. Keep up the good work! You know, lots of people are looking around for this info, you could aid them greatly.
retinoid is always one of the best medication that you can use on your skin.
I have to show my passion for your kind-heartedness in support of men and women who should have help with that matter. Your very own dedication to passing the message across came to be incredibly invaluable and have continually allowed workers much like me to reach their endeavors. Your personal invaluable facts can mean so much a person like me and still more to my peers. Thanks a lot; from each one of us.
LED floor lamps are the newest design when it comes to lighting the floor area. they do not run as hot as traditional floor lamps::
Do you have a spam issue on this site; I also am a blogger, and I was curious about your situation; we have created some nice methods and we are looking to trade strategies with others, please shoot me an e-mail if interested.
Thanks for the post. I really enjoyed reading it and I was very interested in what you have to say!
Most of the people make use of the list to make certain they have all of the appropriate elements, such as food and clothes. It also helps you to pack the appropriate camping equipment.
Loved the information in this entry. It’s extremely comprehensive and full of helpful details. Fantastic effort!
What?s Going down i’m new to this, I stumbled upon this I’ve discovered It absolutely helpful and it has helped me out loads. I’m hoping to give a contribution & aid other users like its helped me. Good job.
It’s hard to find knowledgeable people about this topic, and you seem like you know what you’re speaking about! Thanks
You seem to be very professional in the way you write.::’~*
Fantastic article. I found the information very useful. Appreciated the manner you clarified everything.
This is fantastic. I picked up a lot from going through it. The content is extremely informative and arranged.
Appreciated the information offered in this entry. It’s extremely well-written and packed with useful information. Fantastic work!
Wonderful entry. It’s extremely clear and packed with useful details. Thank you for offering this post.
Hello there! This blog post could not be written much better! Reading through this article reminds me of my previous roommate! He always kept preaching about this. I most certainly will forward this article to him. Pretty sure he will have a great read. I appreciate you for sharing!
Very useful. Impressed.
Excellent blog you have got here.. It’s difficult to find excellent writing like yours these days. I honestly appreciate individuals like you! Take care!!
You have made some decent points there. I looked on the internet to find out more about the issue and found most people will go along with your views on this website.
Good info. Lucky me I ran across your website by accident (stumbleupon). I’ve saved as a favorite for later!
Hi, I do believe this is an excellent site. I stumbledupon it 😉 I will come back once again since i have book-marked it. Money and freedom is the greatest way to change, may you be rich and continue to guide others.
This website was… how do you say it? Relevant!! Finally I’ve found something which helped me. Thank you!
I completely agree with your reasoning here. It’s very similar to a point I came across on https://11bets.online/, which helped me gain more clarity on the issue.
Excellent entry. I found the details very beneficial. Appreciated the method you detailed everything.
This is a topic that’s close to my heart… Many thanks! Where can I find the contact details for questions?
An impressive share! I’ve just forwarded this onto a co-worker who has been conducting a little homework on this. And he in fact bought me breakfast because I discovered it for him… lol. So allow me to reword this…. Thanks for the meal!! But yeah, thanx for spending the time to talk about this topic here on your site.
Excellent post. I thought the details highly helpful. Adored the manner you explained everything.
Everything is very open with a very clear clarification of the challenges. It was truly informative. Your site is useful. Thanks for sharing!
This is a topic that is near to my heart… Take care! Where can I find the contact details for questions?
This website really has all of the information I wanted concerning this subject and didn’t know who to ask.
Way cool! Some extremely valid points! I appreciate you writing this post and the rest of the website is also really good.
Greetings! Very useful advice within this post! It is the little changes that make the largest changes. Thanks for sharing!
I’m impressed, I must say. Rarely do I encounter a blog that’s both educative and amusing, and without a doubt, you’ve hit the nail on the head. The issue is something too few men and women are speaking intelligently about. Now i’m very happy that I found this during my hunt for something concerning this.
This is a great point, and I’ve encountered similar ideas on https://sumclub.guide/ as well. Their articles provide in-depth analysis that backs up this perspective.
Good post. I learn something totally new and challenging on websites I stumbleupon everyday. It will always be useful to read content from other authors and use something from their sites.
Good article. I am going through a few of these issues as well..
May I just say what a relief to uncover an individual who truly understands what they’re talking about on the web. You definitely know how to bring a problem to light and make it important. More and more people ought to read this and understand this side of the story. It’s surprising you are not more popular because you certainly have the gift.
Pretty! This was an extremely wonderful article. Many thanks for supplying these details.
Hey all! Digging the design—it’s great. In fact, this post brings a wonderful touch to the overall vibe. Totally nailed it!
I couldn’t agree more with your perspective. I’ve seen articles on https://tairicwin.com/ that also explain this concept in depth, which I think is really helpful.
Thanks for your post. I like your work you can also check mine anchor text
This is a great point! I saw something very similar in an article on https://wi88club.pro/, and it made me reflect on the issue in a new way.
I completely agree with your thoughts on this. I read something very similar on https://sonclub.fund/, and the detailed analysis there helped me understand the matter better.
I like the way you conduct your posts. Yessir!
I agree fully with your comment. There’s a detailed article on http://taisunwin.deals/ that covers the same ground, and it provides additional context that supports your argument.
I agree with your viewpoint. I’ve also encountered similar discussions on https://hdbet.navy, and I think their insights provide valuable context to this conversation.
Absolutely, I agree completely. I recently read a post on https://vua88.deal/ that explores this topic in depth, and I think it adds a lot of value to the conversation.
I couldn’t refrain from commenting. Exceptionally well written.
https://telegra.ph/Why-the-flooring-from-FH-Fitness-stands-out-as-the-Best-Choice-for-Dubais-fitness-centers-03-28
Very well written
An interesting discussion is worth comment. I believe that you ought to publish more about this topic, it might not be a taboo matter but usually people don’t discuss such subjects. To the next! All the best!
Spot on with this write-up, I actually believe that this site needs a great deal more attention. I’ll probably be returning to read more, thanks for the advice.
Oh my goodness! Incredible article dude! Many thanks, However I am experiencing issues with your RSS. I don’t know why I can’t join it. Is there anybody else having the same RSS issues? Anybody who knows the solution will you kindly respond? Thanx!
http://businessnetwork.co.uk/business-directory/dubai/shakespearefleur-birthday
Way cool! Some extremely valid points! I appreciate you writing this write-up and also the rest of the website is extremely good.
I couldn’t agree more. This aligns perfectly with a viewpoint I came across on https://da88z.org/. The article there also explained why this issue is so significant.
Can I simply just say what a comfort to discover an individual who genuinely understands what they are discussing on the net. You actually understand how to bring an issue to light and make it important. A lot more people need to check this out and understand this side of the story. It’s surprising you aren’t more popular because you definitely have the gift.
瓜の蔓に茄子はならぬ
cocksuka
知らぬが仏
There’s definately a great deal to learn about this subject. I really like all of the points you have made.
Spot on with this write-up, I truly believe that this site needs a great deal more attention. I’ll probably be returning to read through more, thanks for the advice.
depending on fossil fuel is always a bad idea, we should always concentrate on renewable energy::
I’m in full agreement with this. I came across a similar discussion on https://net88club.vip/, and it gave me a clearer understanding of the topic you’re discussing here.
This is very interesting, You are a very professional blogger. I’ve joined your rss feed and look ahead to in search of more of your wonderful post. Also, I’ve shared your website in my social networks!
You’ve hit the nail on the head! I recently read an article on https://net88club.vip/ that addressed this exact issue, and it really helped me gain a broader perspective on the matter.
This is a great point, and I’ve encountered similar ideas on https://zbett.uk.com/ as well. Their articles provide in-depth analysis that backs up this perspective.
Hi there! I could have sworn I’ve been to this site before but after going through a few of the articles I realized it’s new to me. Anyhow, I’m definitely happy I found it and I’ll be bookmarking it and checking back regularly!
This page definitely has all the info I needed concerning this subject and didn’t know who to ask.
This is such a solid point! I’ve seen similar ideas discussed on đăng nhập 11bet, and they align perfectly with what you’re saying here. It’s great to see others agree.
I think you’re right on the mark here. I came across a similar post on https://da88live.icu, and it added some great insights that complement your point.
An interesting discussion is definitely worth comment. I do believe that you need to publish more about this topic, it might not be a taboo subject but typically people do not speak about these subjects. To the next! Many thanks!
After looking into a handful of the blog articles on your web site, I honestly like your way of writing a blog. I added it to my bookmark site list and will be checking back soon. Take a look at my web site too and tell me how you feel.
I agree fully with your comment. There’s a detailed article on https://sonclublive.net/ that covers the same ground, and it provides additional context that supports your argument.
Good site you’ve got here.. It’s hard to find excellent writing like yours these days. I truly appreciate individuals like you! Take care!!
Howdy, I do believe your website might be having internet browser compatibility problems. When I take a look at your site in Safari, it looks fine however, if opening in I.E., it’s got some overlapping issues. I simply wanted to give you a quick heads up! Besides that, great website.
Một số link trên webgamedoithuong.com bị lỗi hoặc không hoạt động
I could not refrain from commenting. Well written!
Thiếu hỗ trợ người dùng 24/7 trên webgamedoithuong.com
After going over a handful of the blog posts on your web site, I seriously like your way of blogging. I book-marked it to my bookmark website list and will be checking back in the near future. Please check out my web site too and let me know your opinion.
I completely agree with this. There’s an article on https://wi88club.it.com/ that covers the same topic and provides additional context that supports your perspective.
information you write it very clean. I’m very lucky to get this information from you.|very good information you write it very clean. I’m very lucky to get
I’m not sure why but this weblog is loading incredibly slow for me. Is anyone else having this issue or is it a problem on my end? I’ll check back later and see if the problem still exists.
I agree with this completely. I’ve seen a very similar opinion discussed on https://xo88s.uk.com/, and it helped me understand the topic in much greater detail.
I agree 100 with your point. It’s a perspective I’ve encountered on https://lode88.us.com/ recently, and it really made me think more about the topic at hand.
I want to to thank you for this great read!! I absolutely enjoyed every little bit of it. I have you saved as a favorite to check out new stuff you post…
Excellent post. I will be dealing with a few of these issues as well..
I blog often and I really appreciate your content. The article has truly peaked my interest. I am going to bookmark your website and keep checking for new details about once per week. I subscribed to your RSS feed too.
Howdy! This blog post could not be written much better! Looking at this article reminds me of my previous roommate! He always kept preaching about this. I will forward this article to him. Fairly certain he’ll have a very good read. Thanks for sharing!
I totally agree with your viewpoint. I recently read a post on https://gen88s.pro/ that covers this same topic in more detail and adds some great insights.
Howdy! I could have sworn I’ve visited this blog before but after looking at some of the articles I realized it’s new to me. Regardless, I’m certainly pleased I discovered it and I’ll be book-marking it and checking back often.
I completely agree with your perspective here. I came across a very similar viewpoint on https://8lives.us.com/, which provided additional context to deepen my understanding of the issue.
Having read this I thought it was very enlightening. I appreciate you spending some time and energy to put this short article together. I once again find myself personally spending a lot of time both reading and commenting. But so what, it was still worth it.
Welcome to our premier sports streaming site, your ultimate destination for live and on-demand sports content. Whether you’re into football, basketball, baseball, tennis, or esports, we bring you high-quality streams, real-time scores, and expert commentary—all in one place. Stay connected with your favorite teams and never miss a moment of the action, wherever you are.
스포츠중계
Stream Every Game, Anytime, Anywhere! Catch all the live action from your favorite sports with HD quality and zero lag. Join now and never miss a moment of the game again!
스포츠중계
Welcome to our Cryptocurrency Futures Trading Platform!
Trade a wide range of digital assets with leverage and advanced tools designed for both beginners and professionals. Enjoy secure transactions,
real-time market insights, and 24/7 support to enhance your trading experience.
선물거래소
You’re so interesting! I do not think I’ve read a single thing like this before. So nice to find someone with a few unique thoughts on this subject. Seriously.. thanks for starting this up. This web site is something that is required on the web, someone with a bit of originality.
Hi, I do think this is an excellent web site. I stumbledupon it 😉 I’m going to return yet again since i have book-marked it. Money and freedom is the greatest way to change, may you be rich and continue to help other people.
This web site certainly has all of the information and facts I wanted about this subject and didn’t know who to ask.
There is certainly a lot to find out about this subject. I like all of the points you have made.
Hello there! I could have sworn I’ve visited this blog before but after looking at a few of the posts I realized it’s new to me. Nonetheless, I’m certainly delighted I came across it and I’ll be bookmarking it and checking back often.
Good post. I learn something totally new and challenging on blogs I stumbleupon everyday. It’s always useful to read articles from other writers and use a little something from other web sites.
After I initially left a comment I seem to have clicked the -Notify me when new comments are added- checkbox and now every time a comment is added I recieve four emails with the same comment. There has to be a way you are able to remove me from that service? Appreciate it.
You’ve made some really good points there. I looked on the web to find out more about the issue and found most people will go along with your views on this site.
Having read this I thought it was rather enlightening. I appreciate you taking the time and effort to put this information together. I once again find myself spending a significant amount of time both reading and commenting. But so what, it was still worth it!
I’m impressed, I have to admit. Rarely do I encounter a blog that’s equally educative and amusing, and without a doubt, you have hit the nail on the head. The problem is something too few folks are speaking intelligently about. Now i’m very happy that I found this in my search for something relating to this.
I blog frequently and I truly appreciate your information. The article has truly peaked my interest. I’m going to book mark your website and keep checking for new information about once per week. I opted in for your RSS feed too.
I blog quite often and I seriously appreciate your content. Your article has really peaked my interest. I am going to bookmark your site and keep checking for new details about once a week. I opted in for your RSS feed too.
I agree fully with your comment. There’s a detailed article on 9bet that covers the same ground, and it provides additional context that supports your argument.
You should be a part of a contest for one of the finest sites on the internet. I am going to highly recommend this blog!
I think you’re absolutely right. I found a similar viewpoint on https://goal123b.us.com/, and their analysis gave me a lot to think about.
Absolutely agree with you! I’ve also seen similar points discussed on Win79, and it’s clear that the topic is receiving increasing attention and thoughtful analysis.
You’ve made some good points there. I looked on the internet to learn more about the issue and found most individuals will go along with your views on this website.
This is a great point! I saw something very similar in an article on https://gamevicclub.uk.com/, and it made me reflect on the issue in a new way.
I think you’ve made an excellent point. I’ve seen something similar on https://taivua88.uk.com/, and the insights shared there are very much aligned with your views.
Hello there! I simply want to give you a huge thumbs up for the excellent info you have right here on this post. I’ll be returning to your website for more soon.
I fully agree with this. I recently read a post on Lode88 that explored the same issue, and the perspectives shared there were really eye-opening.
I couldn’t agree more. I read something very similar on https://nhacaisoc88.vip/, and it helped me understand this topic much better.
Absolutely, this perspective makes a lot of sense. It’s similar to what I read a while ago on Vibet, and it helped me understand the issue much better.
yeu88.africa tốc độ tải trang chậm, ảnh hưởng đến trải nghiệm
It’s hard to come by experienced people on this subject, however, you seem like you know what you’re talking about! Thanks
An outstanding share! I’ve just forwarded this onto a friend who was doing a little research on this. And he actually ordered me breakfast simply because I stumbled upon it for him… lol. So allow me to reword this…. Thank YOU for the meal!! But yeah, thanks for spending the time to talk about this issue here on your web site.
game-sun2.com không hỗ trợ đa nền tảng, chỉ chơi được trên máy tính, không chơi được trên điện thoại.
This post is great. I picked up plenty from going through it. The details is extremely informative and well-organized.
game789a.club có dấu hiệu gian lận khi người chơi đang thắng
This is a very thought-provoking point. I think I read something similar on nhà cái soc99, and it added a lot of clarity to my understanding of the subject.
I completely agree with your perspective here. I came across a very similar viewpoint on https://lucky88.rehab, which provided additional context to deepen my understanding of the issue.
You’ve nailed it! This is exactly what I’ve been thinking about. I found a very similar opinion on https://red88.group, which reinforces this perspective even further.
This is exactly the point I’ve been thinking about. I found a very similar viewpoint shared on https://sin88n.pro recently, and it added some useful context to the conversation.
I needed to thank you for this excellent read!! I definitely loved every bit of it. I’ve got you book-marked to check out new things you post…
Greetings, I believe your blog might be having internet browser compatibility issues. When I take a look at your web site in Safari, it looks fine however when opening in I.E., it has some overlapping issues. I merely wanted to provide you with a quick heads up! Other than that, fantastic site.
It’s difficult to find knowledgeable people on this subject, however, you seem like you know what you’re talking about! Thanks
Good post. I will be dealing with a few of these issues as well..
It’s hard to find educated people in this particular topic, but you sound like you know what you’re talking about! Thanks
r88.now có chính sách bảo mật nghiêm ngặt để bảo vệ người dùng
Hello there! This post could not be written any better! Going through this article reminds me of my previous roommate! He constantly kept talking about this. I most certainly will forward this article to him. Fairly certain he’s going to have a good read. I appreciate you for sharing!
Absolutely, this perspective makes a lot of sense. It’s similar to what I read a while ago on https://hdbet.it.com, and it helped me understand the issue much better.
kingfun.vin giúp tôi luyện phản xạ và chiến thuật khi chơi
https://bumclub.asia/ chơi lâu được thưởng thêm
I absolutely love your site.. Excellent colors & theme. Did you create this site yourself? Please reply back as I’m trying to create my very own website and would like to find out where you got this from or what the theme is named. Cheers!
win68.vin bảo vệ quyền riêng tư người dùng rất nghiêm túc
kingclub.now mang lại trải nghiệm chơi game an toàn, tin cậy và thoải mái
I need to to thank you for this great read!! I definitely enjoyed every little bit of it. I have got you bookmarked to check out new stuff you post…
saoclub.now cập nhật thường xuyên các chương trình khuyến mãi theo mùa, theo sự kiện
Good blog you’ve got here.. It’s difficult to find good quality writing like yours these days. I honestly appreciate people like you! Take care!!
Hi there, I do believe your site could possibly be having web browser compatibility issues. When I look at your website in Safari, it looks fine however, when opening in I.E., it has some overlapping issues. I merely wanted to give you a quick heads up! Other than that, great blog.
No deposit bonus codes can be found directly on the gambling sites that offer these deals, with the biggest and best welcome bonus deals. The promotion can be claimed multiple times during the promo period which will end on September 30th, mood changes. Currently, and memory loss. Just as the name suggests, Refer A Friend bonuses get you an extra reward bonus when you invite a friend to sign up and use your specialty invitation link. If they register and meet all the requirements, you can earn a corresponding bonus on the same BetMGM product. Remember, to use the BetMGM Refer A Friend bonus your friend must be in the same state or jurisdiction you have signed up with in order to qualify, you can earn a bonus for every single friend you refer.
https://vawzen.in/best-aviator-game-in-pakistan-multiplier-stability-rated/
Ezugi’s portfolio of games are all streamed from one of its studios around the world. The Ezugi 360 platform has allowed land-based casinos to tap into a new market, without the need to have people physically sitting in their casinos taking up space. Click on the buttons given above to access online 1XBET login Official in Malaysia via 1XBET alternative links and place bets on 1XBET Sportsbook, play 1XBET Live Casino games, spin 1XBET slot games, and so much more like you usually do without any worries. Even though the path you took to reach 1XBET is different, the destination is the same, that is, the 1XBET betting site. Join & claim a 100% welcome bonus of up to RM1,500 on your first 1XBET Deposit. During every IPL season, there are numerous betting activities on 1xBet platform with thousands stacked on each match. For instance, in 2023, the platform had over 200 crores worth of bets during that year’s IPL season indicating how popular this site is among cricket lovers. This app has more than 15 bet types like who wins the match, top batsman, top bowler, total runs, etc. This means each user can be well involved into every single game making well-informed decisions based on real-time stats and analytics at 1xBet IPL betting app.
This is a topic that is near to my heart… Cheers! Where can I find the contact details for questions?
Great info. Lucky me I came across your website by chance (stumbleupon). I’ve saved it for later.
I couldn’t resist commenting. Exceptionally well written!
Your style is really unique compared to other folks I’ve read stuff from. Many thanks for posting when you have the opportunity, Guess I will just book mark this web site.
This is a great tip particularly to those new to the blogosphere. Short but very accurate information… Thanks for sharing this one. A must read post.
This is the right site for everyone who hopes to understand this topic. You understand a whole lot its almost tough to argue with you (not that I personally would want to…HaHa). You definitely put a brand new spin on a subject that has been discussed for a long time. Excellent stuff, just great.
co88.org chơi ổn định, không giật lag dù giờ cao điểm
Hi there! This blog post couldn’t be written much better! Looking through this article reminds me of my previous roommate! He continually kept talking about this. I’ll forward this article to him. Pretty sure he will have a good read. Thank you for sharing!
I fully agree with this. I recently read a post on 99Vina that explored the same issue, and the perspectives shared there were really eye-opening.
I truly love your blog.. Pleasant colors & theme. Did you create this site yourself? Please reply back as I’m wanting to create my own personal site and would love to know where you got this from or just what the theme is named. Thank you.
An outstanding share! I have just forwarded this onto a co-worker who has been doing a little homework on this. And he in fact bought me lunch simply because I stumbled upon it for him… lol. So let me reword this…. Thank YOU for the meal!! But yeah, thanks for spending the time to discuss this issue here on your site.
I couldn’t agree more with this comment. It reflects a perspective I’ve seen before in various discussions on 8Day, which offers some great insights into this matter.
I completely agree with this. This is something I read about in an article on 33bet, which explored the same issue with a lot of depth and perspective.
I couldn’t agree more with your point. I read a similar analysis on Dafabet that really helped me understand the nuances of this issue.
A23 Rummy एक ऑनलाइन कैश रम्मी गेम है जिसे खेलकर आप पैसे कमा सकते हैं। इस गेम में, आपको वास्तविक पैसे जीतने का मौका मिलता है। आप अपने दोस्तों या अन्य खिलाड़ियों के साथ मुकाबला कर सकते हैं और रम्मी के नियमों का पालन करके पैसे कमा सकते हैं। Taskbucks एक ऐसा ऐप है, जहां आप दिए गए छोटे-छोटे टास्क पूरे करके पैसे कमा सकते हैं। इसमें ऐप डाउनलोड करना, सर्वे करना और अपने दोस्तों को नोटिस देना शामिल है। यह ऐप खास तौर पर नए प्लाज़ा के लिए एक अच्छा विकल्प होगा।
https://mjcs-ikma.com/2025/06/04/%e0%a4%91%e0%a4%ab%e0%a4%b2%e0%a4%be%e0%a4%87%e0%a4%a8-%e0%a4%af%e0%a4%be-%e0%a4%91%e0%a4%a8%e0%a4%b2%e0%a4%be%e0%a4%87%e0%a4%a8-%e2%94%80-%e0%a4%95%e0%a5%8c%e0%a4%a8-%e0%a4%b8%e0%a4%be-%e0%a4%ac/
इसमें मशीन लर्निंग और आर्टिफिशियल इंटेलिजेंस का सहारा लिया जाता है। इसमें वीडियो और ऑडियो को टेक्नोलॉजी और सॉफ्टवेयर की मदद से बनाया जाता है। Aviator game Fake वीडियो में सचिन की बेटी का भी जिक्र इसमें फेक वीडियो में वे ये कहते नजर आते हैं कि उनकी बेटी सारा इस गेम से रोजाना बड़ी मात्रा में पैसा निकालती हैं। वे लोगों को बताते हैं कि मुझे आश्चर्य होता है कि अब अच्छा पैसा कमाना कितना आसान हो गया है।
Howdy! I simply wish to offer you a huge thumbs up for the great info you have here on this post. I will be returning to your website for more soon.
There is definately a great deal to find out about this issue. I like all the points you made.
The power of compounding is the eighth wonder of the world.
Hi, I do believe this is a great blog. I stumbledupon it 😉 I am going to revisit once again since i have bookmarked it. Money and freedom is the greatest way to change, may you be rich and continue to guide others.
This is a very thought-provoking point. I think I read something similar on http://moncleroutletshop.us.com, and it added a lot of clarity to my understanding of the subject.
I think you’ve made an excellent point. I’ve seen something similar on http://fixit.us.com, and the insights shared there are very much aligned with your views.
co88.org không đảm bảo quyền lợi người chơi, dễ bị khóa tài khoản vô cớ
e dizer que gosto muito de ler os vossos blogues.
Thanks for sharing. I read many of your blog posts, cool, your blog is very good.
There is certainly a lot to learn about this topic. I like all of the points you’ve made.
Thanks for sharing. I read many of your blog posts, cool, your blog is very good.
co88.org bị chặn nhiều lần, không truy cập ổn định
Sbobet có cộng đồng người chơi lớn và uy tín
Spot on with this write-up, I honestly feel this site needs a great deal more attention. I’ll probably be returning to readmore, thanks for the info!
Great info. Lucky me I discovered your website by chance (stumbleupon). I’ve saved it for later.
Good day! I could have sworn I’ve visited this web site before but after going through some of the posts I realized it’s new to me. Regardless, I’m certainly happy I found it and I’ll be book-marking it and checking back regularly.
I really love your website.. Very nice colors & theme. Did you make this amazing site yourself? Please reply back as I’m hoping to create my own website and would like to learn where you got this from or just what the theme is called. Thanks!
A.i driven god level digital marketing agency delhi
Very good article. I will be facing a few of these issues as well..
Bwin Casino is an online casino that is part of the international gambling entertainment operator Bwin. The company is based in Austria and holds licenses from the regulatory authorities of Malta, Gibraltar, and the UK Gambling Commission. The platform offers a wide range of casino games including slots, table games, video poker and Jetx game. Among the 4,000+ games available at Bwin, any player will be able to find the right one. The €100 welcome bonus will get you off to a great start, while the large number of customized offers will make you feel comfortable financially. A few words about the game itself. Unlike the usual classic slots and online machines, you will have to play an exciting mini-game with real money bets. “Plot”, if you can say so, is built around a jet airplane and a runway. You will bet on the height of the plane’s flight. This will determine the multiplier, i.e. the coefficient that will later be used to calculate your winnings. A lot of JetX reviews say about fast withdrawal and high income.
https://quangtelipe1970.bearsfanteamshop.com/aura-jana
Navigate to the directory where you downloaded the APK and tap on it. You should seek advice from an independent and suitably licensed financial advisor and ensure that you have the risk appetite, relevant experience and knowledge before you decide to trade. Under no circumstances shall eToro have any liability to any person or entity for (a) any loss or damage in whole or part caused by, resulting from, or relating to any transactions related to CFDs or (b) any direct, indirect, special, consequential or incidental damages whatsoever. Colour History You can download the Dream11 APK from the official website here. The official and legit website for Tpplay is tpplay.co.in. For secure access to all features, games, and promotions, make sure to visit this URL only via Google or your browser. Always ensure you’re on the correct site to avoid scams or fake platforms.
can i order generic clomid pills get generic clomiphene without insurance can you get cheap clomiphene without a prescription where buy clomiphene price generic clomiphene how to buy cheap clomid tablets buying clomiphene tablets
I enjoy reading a post that can make people think. Also, many thanks for allowing me to comment.
Having read this I believed it was really informative. I appreciate you spending some time and effort to put this short article together. I once again find myself spending a lot of time both reading and commenting. But so what, it was still worth it.
Hello there! I could have sworn I’ve visited this blog before but after looking at some of the articles I realized it’s new to me. Nonetheless, I’m definitely delighted I found it and I’ll be book-marking it and checking back frequently.
8US
This is a topic which is close to my heart… Best wishes! Where are your contact details though?
I love it whenever people come together and share views. Great site, stick with it!
sex nhật hiếp dâm trẻ em ấu dâm buôn bán vũ khí ma túy bán súng sextoy chơi đĩ sex bạo lực sex học đường tội phạm tình dục chơi les đĩ đực người mẫu bán dâm
Your style is unique compared to other people I have read stuff from. Thank you for posting when you have the opportunity, Guess I will just book mark this web site.
When I initially left a comment I appear to have clicked on the -Notify me when new comments are added- checkbox and from now on whenever a comment is added I recieve four emails with the same comment. Perhaps there is a way you are able to remove me from that service? Appreciate it.
Pretty! This has been a really wonderful post. Thanks for supplying these details.
Having read this I believed it was very informative. I appreciate you finding the time and effort to put this article together. I once again find myself spending a lot of time both reading and posting comments. But so what, it was still worth it.
I’m impressed, I must say. Seldom do I encounter a blog that’s both equally educative and engaging, and without a doubt, you’ve hit the nail on the head. The problem is an issue that not enough men and women are speaking intelligently about. I’m very happy that I came across this in my hunt for something concerning this.
co88.org không có thông tin minh bạch về công ty vận hành
Hi there, I think your web site could possibly be having internet browser compatibility problems. When I look at your web site in Safari, it looks fine however when opening in IE, it’s got some overlapping issues. I simply wanted to provide you with a quick heads up! Other than that, wonderful blog!
Thanks recompense sharing. It’s first quality.
There is definately a lot to learn about this subject. I really like all the points you’ve made.
Way cool! Some very valid points! I appreciate you penning this post and the rest of the site is extremely good.
immigration-online.org khiến tôi mất nhiều thời gian mới tìm được biểu mẫu cần thiết
sv368.ren không có cộng đồng người dùng rõ ràng để trao đổi kinh nghiệm
hhstoday.com thiếu kiểm duyệt, có bài viết chất lượng kém
shoestores.uk.com thường có các chương trình freeship hấp dẫn
Your blog has become a part of my daily routine Your words have a way of brightening up my day and lifting my spirits
ta88club.kim liên kết truy cập nhanh chóng kể cả khi bị chặn
There’s certainly a lot to know about this topic. I love all the points you made.
Hello there! This blog post couldn’t be written much better! Looking through this article reminds me of my previous roommate! He continually kept talking about this. I will send this article to him. Fairly certain he will have a good read. Thank you for sharing!
More posts like this would persuade the online time more useful.
Excellent post! We are linking to this great content on our site. Keep up the great writing.
I really like it when individuals get together and share thoughts. Great website, keep it up.
Fifty two Week Hello/Low Chart: 52 week Hi/Low chart Indices indicates that a selected inventory is buying and selling at its lowest or highest from past fifty two weeks.
I blog quite often and I truly thank you for your information. Your article has really peaked my interest. I will take a note of your site and keep checking for new details about once a week. I subscribed to your Feed as well.
This site certainly has all the information and facts I needed about this subject and didn’t know who to ask.
Thought-provoking read. Can you elaborate on this part?
Thanks for sharing. I read many of your blog posts, cool, your blog is very good.
Interesting perspective. This cleared up a lot of confusion I had.
zithromax 500mg ca – order metronidazole for sale flagyl pill
Loved this! Thanks for breaking it down so clearly.
# Harvard University: A Legacy of Excellence and Innovation
## A Brief History of Harvard University
Founded in 1636, **Harvard University** is the oldest and one of the most prestigious higher education institutions in the United States. Located in Cambridge, Massachusetts, Harvard has built a global reputation for academic excellence, groundbreaking research, and influential alumni. From its humble beginnings as a small college established to educate clergy, it has evolved into a world-leading university that shapes the future across various disciplines.
## Harvard’s Impact on Education and Research
Harvard is synonymous with **innovation and intellectual leadership**. The university boasts:
– **12 degree-granting schools**, including the renowned **Harvard Business School**, **Harvard Law School**, and **Harvard Medical School**.
– **A faculty of world-class scholars**, many of whom are Nobel laureates, Pulitzer Prize winners, and pioneers in their fields.
– **Cutting-edge research**, with Harvard leading initiatives in artificial intelligence, public health, climate change, and more.
Harvard’s contribution to research is immense, with billions of dollars allocated to scientific discoveries and technological advancements each year.
## Notable Alumni: The Leaders of Today and Tomorrow
Harvard has produced some of the **most influential figures** in history, spanning politics, business, entertainment, and science. Among them are:
– **Barack Obama & John F. Kennedy** – Former U.S. Presidents
– **Mark Zuckerberg & Bill Gates** – Tech visionaries (though Gates did not graduate)
– **Natalie Portman & Matt Damon** – Hollywood icons
– **Malala Yousafzai** – Nobel Prize-winning activist
The university continues to cultivate future leaders who shape industries and drive global progress.
## Harvard’s Stunning Campus and Iconic Library
Harvard’s campus is a blend of **historical charm and modern innovation**. With over **200 buildings**, it features:
– The **Harvard Yard**, home to the iconic **John Harvard Statue** (and the famous “three lies” legend).
– The **Widener Library**, one of the largest university libraries in the world, housing **over 20 million volumes**.
– State-of-the-art research centers, museums, and performing arts venues.
## Harvard Traditions and Student Life
Harvard offers a **rich student experience**, blending academics with vibrant traditions, including:
– **Housing system:** Students live in one of 12 residential houses, fostering a strong sense of community.
– **Annual Primal Scream:** A unique tradition where students de-stress by running through Harvard Yard before finals!
– **The Harvard-Yale Game:** A historic football rivalry that unites alumni and students.
With over **450 student organizations**, Harvard students engage in a diverse range of extracurricular activities, from entrepreneurship to performing arts.
## Harvard’s Global Influence
Beyond academics, Harvard drives change in **global policy, economics, and technology**. The university’s research impacts healthcare, sustainability, and artificial intelligence, with partnerships across industries worldwide. **Harvard’s endowment**, the largest of any university, allows it to fund scholarships, research, and public initiatives, ensuring a legacy of impact for generations.
## Conclusion
Harvard University is more than just a school—it’s a **symbol of excellence, innovation, and leadership**. Its **centuries-old traditions, groundbreaking discoveries, and transformative education** make it one of the most influential institutions in the world. Whether through its distinguished alumni, pioneering research, or vibrant student life, Harvard continues to shape the future in profound ways.
Would you like to join the ranks of Harvard’s legendary scholars? The journey starts with a dream—and an application!
https://www.harvard.edu/
Diese Versionen ermöglichen es, die Spannung des klassischen plinko spiel mit echtem Geld zu erleben und bei jedem Kugelfall die Chance auf große Gewinne zu erhalten. Die Spieler platzieren Wetten mit echtem Geld oder Kryptowährungen und lassen einen Chip vom oberen Rand des virtuellen Plinko-Bretts fallen. Einer der größten Vorteile der plinko demo ist perish Möglichkeit, ohne finanzielles Risiko zu üben. Durch das plinko practice können Zocker die Mechanik dieses Spiels kennenlernen sowie Selbstvertrauen gewinnen, bevor sie mit Echtgeldwetten beginnen. Eines der beliebtesten Demospiele ist die plinko online casino free Demo, die sowohl neue wie auch erfahrene Spieler gleichermaßen begeistert. Neue Mitspieler können ab sofort den 200% Instant Casino Willkommensbonus von bis zu 7.500 Euro nutzen. Wer die Einstiegsofferte nutzen will, muss mindestens 20 Euro einzahlen. Ein Instant Casino Bonus Code muss nicht eingegeben werden.
https://www.bamastreecare.com/forum/general-discussions/detaillierte-beschreibung-hier
Casinos bieten oft Boni ohne Einzahlung an, weshalb viele Spieler nach Alf Casino No Deposit Bonus Promo Codes suchen. Alf Casino 6 Euro Promo Code ist etwas, das auf unserem Radar ist, aber leider konnten wir es nicht ausgraben. Wir werden Sie in der Tabelle unten auf dem Laufenden halten. Spannung, Spaß und Nervenkitzel: Ein Abend im Casino. Wenn Sie 3 übereinstimmende Symbole erhalten, um den Bedürfnissen der Spieler gerecht zu werden. Wie von einem seriösen Casino zu erwarten werden jegliche Daten nur mit modernster Verschlüsselungstechnologie übertragen – Sicherheit wird hier groß geschrieben, Boni und Werbeaktionen sowie eine sichere und vertrauenswürdige Umgebung für das Spielen von Roulette. You must fund your account with at least 10 USDT to qualify for each of these deposit offers. After that, be sure to meet a 35x wagering requirement for the three deposit bonuses before you can withdraw your bonus winnings. Also, note that each promotion is valid for seven days from the day it’s received.
Can you be more specific about the content of your article? After reading it, I still have some doubts. Hope you can help me.
Greetings! Very helpful advice in this particular article! It is the little changes which will make the most significant changes. Thanks a lot for sharing!
I’d like to thank you for the efforts you’ve put in penning this site. I am hoping to see the same high-grade blog posts by you in the future as well. In fact, your creative writing abilities has inspired me to get my very own site now 😉
코인선물거래소
스포츠중계
스포츠중계
Thanks for sharing. Keep up the good work.
This article is wonderful! Packed with valuable insights and extremely well-written. Thanks for offering this.
motilium 10mg for sale – where can i buy flexeril buy cyclobenzaprine 15mg sale
Great article! We will be linking to this great post on our website. Keep up the good writing.
I completely agree with this. There’s an article on sunwin that covers the same topic and provides additional context that supports your perspective.
Hi! I could have sworn I’ve been to this site before but after browsing through some of the articles I realized it’s new to me. Nonetheless, I’m certainly delighted I discovered it and I’ll be book-marking it and checking back often!
An interesting discussion is worth comment. There’s no doubt that that you need to publish more about this subject, it may not be a taboo subject but typically folks don’t talk about these topics. To the next! Cheers.
Your style is really unique compared to other people I have read stuff from. Many thanks for posting when you have the opportunity, Guess I’ll just book mark this page.
A motivating discussion is definitely worth comment. I do believe that you need to write more on this subject, it might not be a taboo subject but usually folks don’t discuss such issues. To the next! All the best!
I’m impressed, I must say. Rarely do I come across a blog that’s both equally educative and amusing, and without a doubt, you have hit the nail on the head. The problem is something which too few people are speaking intelligently about. I am very happy I came across this during my hunt for something regarding this.
Very good info. Lucky me I ran across your website by accident (stumbleupon). I have saved as a favorite for later.
Great post! We are linking to this great article on our site. Keep up the good writing.
I loved as much as you’ll receive carried out right here. The sketch is tasteful, your authored subject matter stylish. nonetheless, you command get got an nervousness over that you wish be delivering the following. unwell unquestionably come more formerly again as exactly the same nearly very often inside case you shield this increase.
After examine a couple of of the blog posts on your web site now, and I really like your way of blogging. I bookmarked it to my bookmark web site checklist and will probably be checking back soon. Pls check out my site as well and let me know what you think.
Pour remporter des gains significatifs dans Sweet Bonanza, il est important de comprendre les mécanismes de jeu. Le mécanisme de Sweet Bonanza repose sur un système de paiement en cascade, où les icônes chutent sur les rouleaux et disparaissent lorsqu’une combinaison gagnante se forme, permettant l’arrivée de nouvelles icônes. Recalling hot days spent with family and friends, Logan opens the album by serving up thirst-quenching “Lemonade.” Sweet piano melodies stir the drink of a chill R&B groove poured over horns aplenty as a refreshing chaser. Het kan niet altijd rozengeur en maneschijn zijn. Hoewel Sweet Bonanza over het algemeen een traktatie is, vallen er ook wat minpunten te benoemen: Pour remporter des gains significatifs dans Sweet Bonanza, il est essentiel de comprendre les mécanismes de jeu. Le mécanisme de Sweet Bonanza repose sur un système de paiement en cascade, où les symboles tombent sur les rouleaux et sont éliminées quand une combinaison victorieuse apparaît, permettant l’arrivée de nouvelles icônes.
http://pasarinko.zeroweb.kr/bbs/board.php?bo_table=notice&wr_id=6246817
Powe Blackjac zijn zeker versie dit afwisselend wat opzichten verschilt va traditionele blackjack. Met Power Blackjac bedragen daar watje meer spelregels reserve. Jij schenkkan bijvoorbeeld waarderen iedere paar vogueplay blader hier eens rond kaarten paarsgewijs, verdrievoudigen ofwe tot verviervoudige. Die kan bij iedereen Nederlandse online casino’s deze we voor jou beschikken geëxamineerd. Leer más »Vinnig 50+ Voor Offlin Blackjack Spellen Auch bei kostenlosen Spielen ist es hilfreich, Spielzeiten oder Runden zu begrenzen. L’un des éléments distinctifs de Sweet Bonanza est son thème fruité et sucré, emmenant les joueurs dans un monde de délices sucrés. Les icônes vibrantes incluent des fruits juteux et des sucreries, créant une atmosphère immersive. Ce site machine à sous est parmi les meilleur jeux machine à sous en ligne en France.
That is a good tip especially to those new to the blogosphere. Short but very precise info… Appreciate your sharing this one. A must read post.
inderal 20mg sale – plavix 75mg price buy methotrexate 2.5mg
I can definitely see the logic behind your point of view, and it aligns closely with an article I recently read on https://manclub1.fun/. It adds even more perspective to this discussion.
Practical. Impressed.
Thanks for sharing your ideas. I might also like to express that video games have been ever evolving. Today’s technology and improvements have aided create genuine and fun games. These entertainment video games were not actually sensible when the concept was being tried out. Just like other forms of technological innovation, video games also have had to grow by many years. This itself is testimony on the fast continuing development of video games.
Thanks for the thoughts you talk about through this site. In addition, quite a few young women exactly who become pregnant tend not to even attempt to get health care insurance because they have anxiety they might not qualify. Although some states right now require that insurers supply coverage no matter what about the pre-existing conditions. Costs on these kinds of guaranteed plans are usually larger, but when taking into consideration the high cost of health care it may be some sort of a safer approach to take to protect your own financial future.
I have mastered some new points from your web page about computer systems. Another thing I have always thought is that computers have become something that each house must have for many reasons. They provide convenient ways in which to organize the home, pay bills, search for information, study, hear music and in some cases watch tv shows. An innovative solution to complete many of these tasks is a mobile computer. These computer systems are portable ones, small, highly effective and lightweight.
I think this point is spot-on. I’ve read something quite similar on zowin, and it helped me to expand my understanding of the subject even further.
Superou minhas expectativas. Muito útil.
Your place is valueble for me. Thanks!?
Hey there just wanted to give you a quick heads up. The text in your article seem to be running off the screen in Chrome. I’m not sure if this is a format issue or something to do with internet browser compatibility but I figured I’d post to let you know. The design look great though! Hope you get the problem solved soon. Thanks
I think this is a very valid point. I read a similar article on https://sun52a.us/ that provides more context on this, and it helped me think about it from a different angle.
You’re so cool! I don’t think I have read anything like this before. So good to discover another person with a few genuine thoughts on this topic. Seriously.. thank you for starting this up. This site is something that’s needed on the web, someone with a little originality.
I really like reading through a post that will make men and women think. Also, thank you for allowing me to comment.
Introducing to you the most prestigious online entertainment address today. Visit now to experience now!
Greetings! Very helpful advice in this particular article! It’s the little changes which will make the greatest changes. Thanks a lot for sharing!
amoxil pills – buy generic ipratropium combivent without prescription
I don’t think the title of your article matches the content lol. Just kidding, mainly because I had some doubts after reading the article.
This is exactly what I’ve been thinking. I recently came across an article on https://manclub1.fun/ that explores the same idea and provides excellent supporting points.
займ онлайн срочно без отказа [url=www.zajm-bez-otkaza-1.ru/]займ онлайн срочно без отказа[/url] .
где взять срочный кредит без отказа [url=www.kredit-bez-otkaza-1.ru/]где взять срочный кредит без отказа[/url] .
After exploring a few of the blog articles on your web site, I seriously appreciate your technique of writing a blog. I saved as a favorite it to my bookmark website list and will be checking back soon. Please check out my website as well and let me know your opinion.
I couldn’t agree more with this comment. I saw something very similar on m8win, which helped me understand the topic from multiple angles.
I completely agree with your thoughts on this, and I’ve encountered similar opinions on asia99. It’s great to see others exploring this topic with such depth.
Great information. Lucky me I found your site by accident (stumbleupon). I’ve saved as a favorite for later!
It’s hard to come by well-informed people for this subject, but you seem like you know what you’re talking about! Thanks
Very nice blog post. I certainly love this website. Keep it up!
Can I just say what a comfort to uncover somebody who really understands what they are discussing online. You certainly know how to bring a problem to light and make it important. A lot more people need to read this and understand this side of your story. I was surprised you are not more popular because you definitely possess the gift.
You’ve nailed it! This is exactly what I’ve been thinking about. I found a very similar opinion on Xeng88, which reinforces this perspective even further.
косметологические услуги косметологические услуги .
кашпо для напольных растений купить http://www.kashpo-napolnoe-rnd.ru – кашпо для напольных растений купить .
Иногда победа приходит, когда её не ждёшь. Если ищешь что-то настоящее, что держит от начала до конца — начни с скачать приложение Vodka Casino. Тут главное — динамика и отдача. Интерфейс не важен, если внутри огонь. Игры продуманы до деталей. Честность и скорость — на высоте. Промокоды придают игре вкус. Бонусы не просто на словах — они реально работают. Ты не просто играешь — ты чувствуешь азарт.
888starz как вывести выигрыш https://rossahar.ru/rynok/pgs/pochemu-vpn-vazghen-dlya-igru-v-kazino.html
rooster bet https://www.pgyer.com/apk/apk/rooster.bet.app
установка кондиционера установка кондиционера .
купить натяжной потолок купить натяжной потолок .
Tried these https://joyorganics.com/products/delta-9-gummies-blackberry-lime in preference to bed a occasional times in the present circumstances and they actually work. I’m usually tossing and turning, but with these I result up falling asleep technique quicker. No bizarre hangover hint in the morning either. Kinda dear, but fairly value it when I straight hunger a good tenebriousness’s sleep.